2 The Sun as a star General properties


")


: The position angle between the geocentric north pole")


 composition is determined by the fractional percentage of hydrogen,")
 abundances Recent development of 3 D models")
 3")


 X Y Hydrogen Helium Z Oxygen The")


 lines")

 model of the solar atmosphere")


")

- Slides: 56
2. The Sun as a star General properties, place in the Hertzsprung. Russell diagram. Distance, mass, radius, luminosity, composition, age, evolution, spectral energy distribution.
General Properties of the Sun. Hertzsprung-Russel Diagram. Sun Hertzsprung-Russel Diagram. Numbers in the mainsequence band stars are stellar masses in units ofcatalog the solar mass. 22, 000 from Hipparcos Dotted lines correspond to constant radius in units of the solar radius. RW - radiatively driven wind. • In 1911 -13, Ejnar Hertzsprung and Henry Norris Russell independently developed H-R diagram • Horizontal axis - spectral type (or, equivalently, color index or surface temperature) • Vertical axis - absolute magnitude (or luminosity) • Data points define definite regions, suggesting common relationship exists for stars composing region. Each region represents stage in evolution of stars. • The place of a star on the H-R diagram also tells us about its radius, energy generation and transport, periods and growth rates of pulsations, rotation rate, stellar activity, X-ray coronas, etc. • Sun is G 2 main-sequence star. Lies roughly in middle of diagram among what are referred to as yellow dwarfs.
Overall properties
Sun’s age Radioactive decay Does not change over time Measured by mass spectrometer
The age is determined from the slope
New solar parameters adopted by the International Astronomical Union (2015)
Distance - I
Distance - II Kepler’s law Triangulation Measure the distance between the planets, D, the orbital periods, t 1 and t 2, and then calculate their distances to the Sun, a 1 and a 2.
Distance - III The Sun's angular size varies from 31' 27. 7" to 32' 31. 9" during the course of a year because the distance changes from 1. 471 x 1011 m in January to 1. 521 x 1011 m in July. 1 arcsec varies from 710 km to 734 km.
The Solar Mass
Sun’s rotation axis is inclined by 7. 23 degrees to the ecliptic
Solar coordinates • P-angle (or P): The position angle between the geocentric north pole and the solar rotational north pole measured eastward from geocentric north. The range in P is +/- 26. 31 degrees. • B 0: Heliographic latitude of the central point of the solar disk; also called the Bangle. The range of B 0 is +/- 7. 23 degrees, correcting for the tilt of the ecliptic with respect to the solar equatorial plane. • L 0: Heliographic longitude of the central point of the solar disk. The longitude value is determined with reference to a system of fixed longitudes rotating on the Sun at a rate of 13. 2 degrees/day (the mean rate of rotation observed from central meridian transits of sunspots). The standard meridian on the Sun is defined to be the meridian that passed through the Sun's equator on 1 January 1854 at 1200 UTC and is calculated for the present day by assuming a uniform sidereal period of rotation of 25. 38 days. (Carrington longitude).
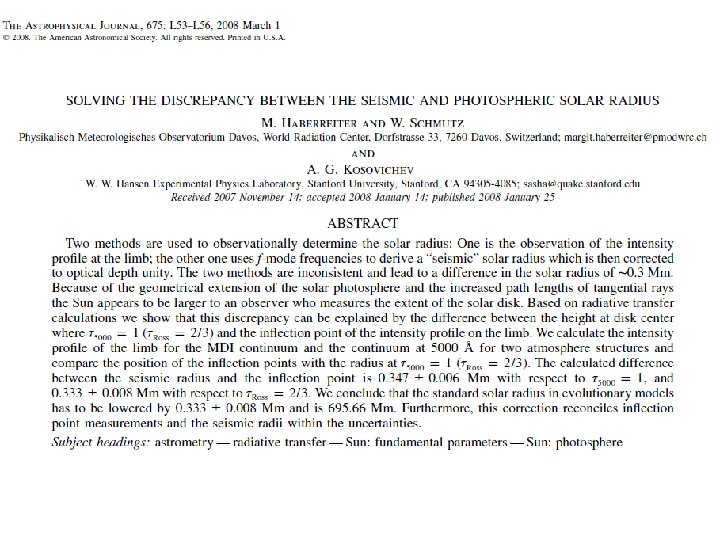
The Solar Radius
Determination of the seismic radius
Helioseismic estimate of the solar radius
Measurements of f-mode frequencies and comparison with solar models f-mode
Calibration of solar models to match the helioseismology data Old standard model Seismic radius
Radiative transfer calculations to determine the precise surface location At the limb we see higher layers of the solar atmosphere because of the higher optical depth. The reference wavelength is 5000 A. To observer atmosphere
The apparent solar radius depends on wavelength (the standard value is for 5, 000 A=500 nm) Radio EUV V Rozelot, Kosovichev, Kilcik, 2015
Oblateness
Quadrupole moment
Composition
The Periodic Table for Astronomy
Solar composition • Solar (stellar) composition is determined by the fractional percentage of hydrogen, X, helium, Y, and the heavier elements, Z: • X+Y+Z=1 • X=m. H/M (M is the total mass) • Y=m. He/M • Z=1 -X-Y Canonical values: Hydrogen mass fraction Helium mass fraction Heavy elements Logarithmic abundances are defined relatively to the number density of hydrogen: log e. X=log(NX/NH)+12 NX – number density of element X NH – number density of hydrogen H Stellar “metallicity” is defined relative to the Sun [Fe/H]: measured in dex (e. g. if [Fe/H]=-1 the number density is 10 times smaller than on the Sun).
Determination of solar (stellar) abundances Recent development of 3 D models
10 7 1 million K 60, 000 K 6, 000 K Temperature (K) 3 million K Corona n. H 10 6 T 10 5 10 4 10 3 10 16 10 Transition Region Chromosphere 14 10 12 10 10 10 8 10 2 10 3 10 4 Height Above Photosphere (km) 10 5 -3 Total Hydrogen Density (cm ) Temperature & Density Structure of the Solar Atmosphere
3 D realistic simulation of the solar surface take into account all essential physics: stratification, gravity, radiative energy transfer, ionization, detailed chemical composition Vz T Only small surface areas can be simulated on modern supercomputers
Example of fitting synthetic spectral line of Fe I from 1 D and 3 D models to observations Much better fit with the 3 D model
Illustration of the solar abundances (mass fractions) X Y Hydrogen Helium Z Oxygen The result of the 3 D models was a substantially lower abundance of the heavy elements: Z=0. 014 instead of 0. 02 found using 1 D models.
The low Z led to a “crisis” in helioseismology and solar modeling • For a given chemical composition, X, Y, Z, the structure of the Sun is calculated using the Standard Stellar Evolution Theory. • The distribution of the sound speed as a function of radius is determined by helioseismology, and can be compared with the solar model. • For Z=0. 02 the solar model is in excellent agreement with helioseismology. • However, for Z=0. 014 the disagreement is very large. The source of discrepancy is still unknown. Asplund, Grevesse & Sauval, 2005 -9 Z=0. 014 Z=0. 02 Grevesse & Sauval, 1998
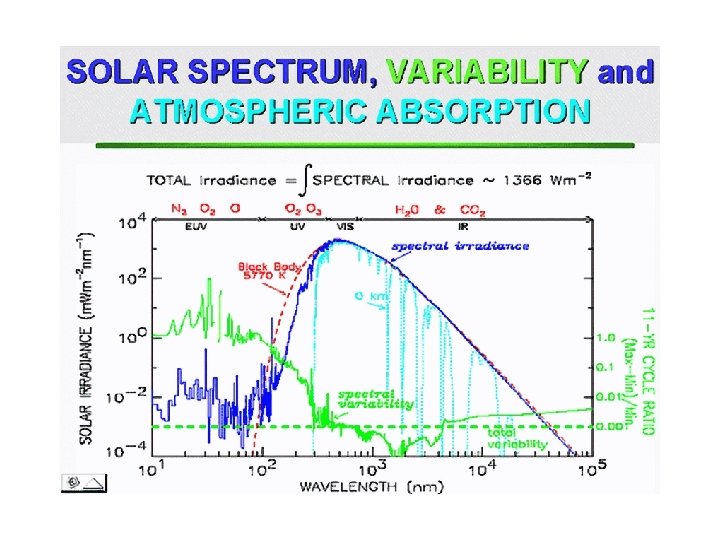
Luminosity Absorption in the Earth’s atmosphere. The edge of the shaded area marks the height where the radiation is reduced to 1/2 of its original strength. UV - ultraviolet; V- visible; IR infrared.
Irradiance variations The composite total irradiance from 1977 to 2018. Note the variation with the solar activity cycle of order 0. 1%
Faint young Sun paradox • The Standard Stellar Evolution theory shows that the Sun’s luminosity increased by 28% over the Sun’s life of 4. 6 billion years. • If the solar energy output was 28% lower then oceans would freeze. But geological records show that this was not the case, and the surface was warm. • Possible solutions: – Earth’s atmosphere had more greenhouse gases – Earth produced more internal heat – The Sun was more massive, and lost mass because of strong solar wind – this is a hot topic of current research in astronomy (“The Sun in Time” project).
Effective temperature of the Sun
Spectral energy distribution
Solar irradiance spectrum 1 Angstrom = 10 -10 m = 10 -8 cm = 0. 1 nm = 10 A
Black body radiation Black body spectrum depends only on temperature
Spectral energy distribution
Visible spectrum H-alpha line 6563 A
Hydrogen series Lya Ha Hb Hg
Visible spectrum Hb Hg Ca. II H&K Ha line 6553 A
Ha image from BBSO September 9, 2018
Magnetogram SDO/HMI
Continuum Image SDO/HMI
Visible solar spectrum with absorption (Fraunhofer) lines
Different parts of Fraunhofer lines are formed in different layers: the line core is formed higher than the line wings
VAL (Vernazza, Avrett, Loeser) model of the solar atmosphere
Color indices
Infrared spectrum The infrared spectral irradiance.
Radio spectrum
UV spectrum Lya
EUV and X-ray spectrum
X-ray emission is highly variable Soft X-ray from GOES satellite (last 2 days)
Real-time solar images http: //jsoc. stanford. edu/data/hmi/images/latest/ http: //sdowww. lmsal. com/suntoday/ http: //helioviewer. org/ http: //www. bbso. njit. edu/cgi-bin/Latest. Images http: //sohowww. nascom. nasa. gov/ http: //www. raben. com/maps/