WHY USE MEASURES OF CENTRAL TENDENCY The significance


 OF THE MEDIAN When there an even number of data, the")
 Determine the median of 8, 21, 14,")
 Determine the median of 8, 21, 14,")
 Determine the median of 7, 8, 21,")
 Determine the median of 7, 8, 21,")
.")


")


 x (91. 24) x (114. 50)")


- Slides: 67
WHY USE MEASURES OF CENTRAL TENDENCY The significance of large sets of numbers can be difficult to comprehend. Although Pictograms and Tables can present summaries that can be readily understood, it is often more convenient to describe a set of numbers by condensing them down to a single number.
SUMMARISING DATA Consider this set of subject marks data 52, 64, 16, 48, 35, 52, 85, 96, 90, 87, 78, 37, 68, 62, 60, 51, 55, 57, 64, 51, 62, 43, 68, 71, 76, 68, 65, 83, 47, 44, 76 This set of data represents univariate (single or, one variable) observations. Knowing the context of these data allows you to make some assumptions about the data. For example, you might assume that since these data are subject marks, and the highest is 96, the range for these marks could be 0100.
SAMPLE STATISTICS Sample statistics can be used to examine the distribution of the data. Remember a statistic is defined as a numerical characteristic (or measure) of a sample. A parameter is a numerical characteristic (measure) of a population. Usually the values of parameters are not known so a statistic is used to make inferences about a population. For this inference step (from sample to population) the sample must be representative of the population.
THE DISTRIBUTION OF DATA Using statistics you can say something about 1. the centre of the distribution of data 2. the shape of the distribution 3. the spread of distribution
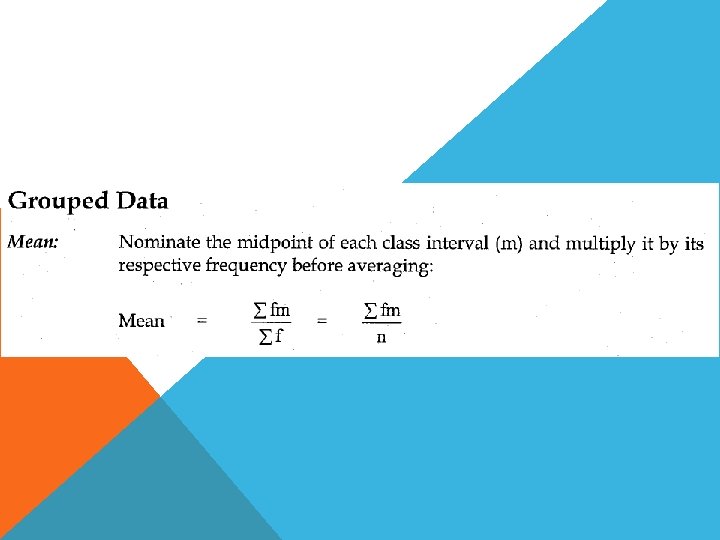
MEASURING THE CENTRE OF A DISTRIBUTION There are several measures of centre but here we consider three i. Median ii. Mean iii. Mode
WHAT IS THE MEDIAN? The median is the middle value of a ranked data set - so that half of the data falls above it and half below it. This is easy if there is an odd number of data, but when there is an even number of data you need to find the two central values, add them together and then divide them by two to obtain the median. Let’s look at those student results again. 52, 64, 16, 48, 35, 52, 85, 96, 90, 87, 78, 37, 68, 62, 60, 51, 55, 57, 64, 51, 62, 43, 68, 71, 76, 68, 65, 83, 47, 44, 76
CALCULATING THE MEDIAN Consider a smaller data set of 8 dollar values: 32 30 40 25 22 18 31 37 31 32 37 40 Rank the data (smallest to largest) 18 22 25 30
THE VALUE (SIZE) OF THE MEDIAN When there an even number of data, the data set splits evenly and the median is not a member of the data set. In this case, the median will be at position halfway between the data in the 4 th position (30) and the data in the 5 th position (31). Therefore, the value (size) of the median is
YOUR TURN …. Page 58 Lynch text) Determine the median of 8, 21, 14, 18, 13, 12 = ?
YOUR TURN …. Page 58 Lynch text) Determine the median of 8, 21, 14, 18, 13, 12 8, 12, 13, 14, 18, 21 = 13. 5
YOUR TURN …. Page 58 Lynch text) Determine the median of 7, 8, 21, 14, 18, 13, 12
YOUR TURN …. Page 58 Lynch text) Determine the median of 7, 8, 21, 14, 18, 13, 12 7, 8, 12, 13, 14, 18, 21 = 13 Now we have an odd number in our data set – 13 has three scores below it and three scores above it
RECAP To find the median 1. Identify the size of the data set (n). 2. Rank the values of the data set (usually lowest to highest). 3. Locate the position of the median 4. Last, identify the size (value) of the data value at that position and quote it as the median
STEM-AND-LEAF PLOT Return to the student marks data set:
STEAM AND LEAF STRUCTURE The structure that has been drawn here is a table but it is also drawn in graphical form. In this type of frequency histogram (frequency is really just another name for counts), data have been collected into cells. This allows you to get an idea of the shape of the distribution of the data. A stem and leaf plot is a shorthand way of doing the same thing without sacrificing information. With a stem-and-leaf plot you must always include a statement about the size of the data. In the example above, the stems are tens, as shown in the key and the leaves are units (values of one). This means the size of the ‘ 5’ in the stem is actually ‘ 50’. And that stem really includes all marks from 50 to 59 inclusive.
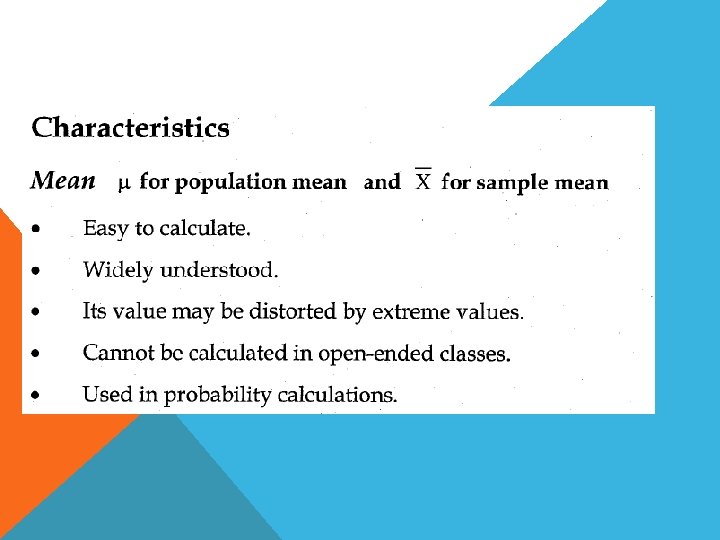
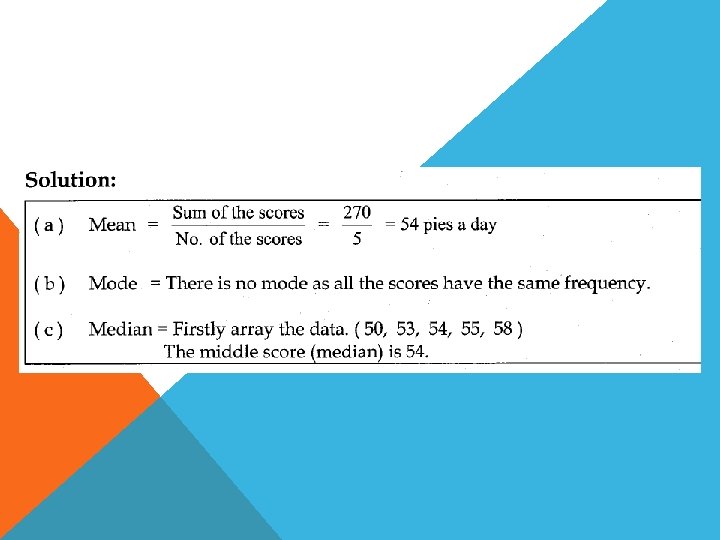
Arithmetic Mean - the average of the scores It is the ‘typical’ value of a variable x = For example, the mean age of students. Divide the total of students’ ages by the number of students x x Σx n the arithmetic mean calculated from a sample pronounced ‘x bar ’ the symbol for the variable (an element of the data set) the sum of the observations pronounced ‘sigma x ’ the number of observations in the sample
Remember, to calculate the mean is to calculate the mathematical average. Therefore, essentially you are adding together all the measurements and then dividing that total by the number of measurements. For this set of student marks the total number of measurements is 33. The sum of these 33 measurement values is 1964. The mean is calculated by dividing 1964 by 33 and is 59. 58. Rounding gives a mean of approximately 60. It is often useful to round statistics, especially summary statistics such as the mean, for presentation purposes. Let’s use the Financial Calculator to find the mean … 52, 64, 16, 48, 35, 52, 85, 96, 90, 87, 78, 37, 68, 62, 60, 51, 55, 57, 64, 51, 62, 43, 68, 71, 76, 68, 65, 83, 47, 44, 76
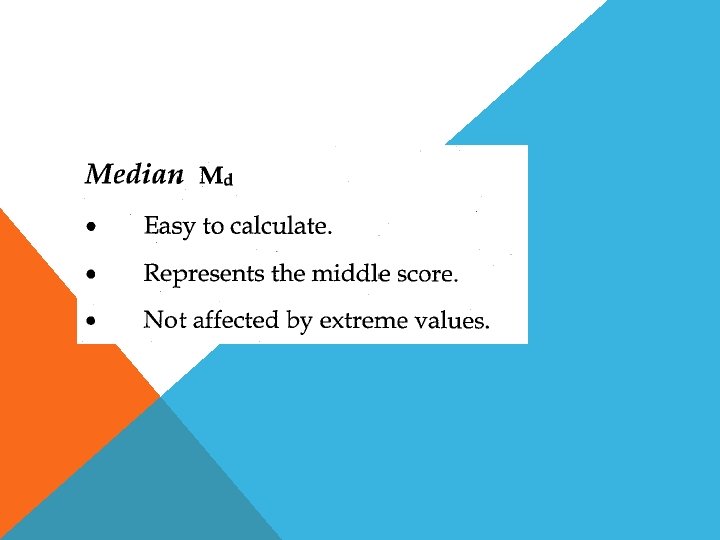
TAKE NOTE For this data set, the mean of 60 is slightly smaller than the median. This is because the mean is affected by the numerical value of every measurement, so a very low score like 16 affects the mean. Likewise, a very large data will drag the mean upwards. The median is affected only by the relative position of measurements and so 16 has the same effect on the median as any other number below 62. The median is not affected by the size of extreme data values; it is affected by the number of data in the data set.
TO AVOID CONFUSION Statisticians simply use the term Measure of Central Tendency to describe the general idea of a typical value Mean is used to describe the mathematical average
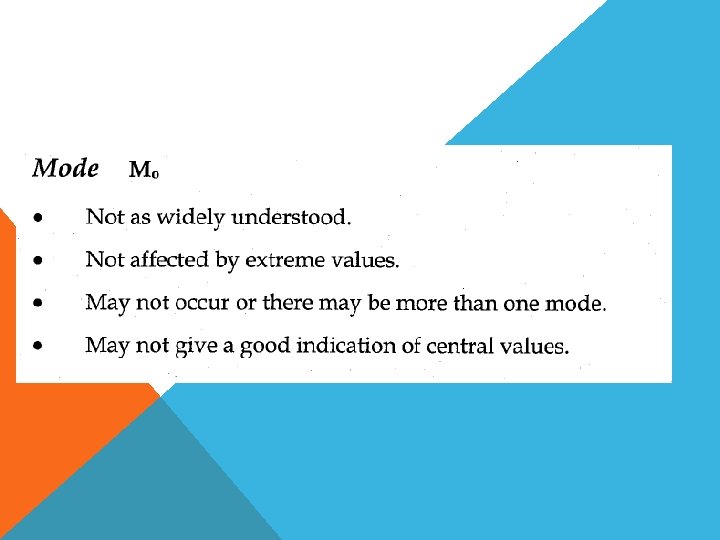
WHAT IS THE MODE? The mode is the most common value in a data list. It is the value with the highest frequency. In the example of student marks, the mode is 68 because it occurs three times (i. e. three students obtained 68). Note it is the value of the highest frequency not the highest frequency – the mode is 68 not 3
. The mode can be useful with categorical or discrete variables. For example, if you managed a shoe shop you might find the mode a useful concept because it could tell you which men's and women's shoe sizes are the most common among your customers.
APPROPRIATE USE OF MEAN, MEDIAN AND MODE It seems that it can be relatively easy to work out the mode, median and mean. But why would anyone want to know all or any of these values? All of these can tell us something about a set of observations. Generally the mode tends to be reported little. It is not a measure of centre in the same way that median and mean can be.
MORE ON THE MODE The mode is the only measure of centre appropriate for nominal data. For example, if we were looking at the most frequently purchased food item in the Foodhall in 2011, it does not make sense to talk about the median food or the mean food but it does make sense to say that the most frequent (modal) food purchased was (shall we say) mini chocolate bars. Sometimes there might be more than one mode in a set of data – it is possible that the most popular food item purchased was lamingtons and mini chocolate bars
MORE ON THE MEDIAN The median is at the middle of an ordered (ranked) data set and is a useful measure for ordinal variables. Strictly speaking, the mean only makes sense for interval and ratio scales of measurement. However, there is a tendency to calculate means for ordinal variables as well. The calculation of a mean for ordinal scales of measure assumes that the interval between the rankings is the same between each ranking. But, can we be sure that my idea of the interval between 'agree' and 'strongly agree', for example, is the same as yours?
RATING SCALES An example of this type of scale is rating scales. These scales are divided into intervals and usually numbered similar to the method used in the example below. However, although the scale implies that the intervals are equal, they are not intrinsically equal.
USAGE OF MEAN AND MEDIAN COMPARED Sometimes the mean is thought of as an economic measure and the median as a social measure. For example, the mean income of a group of people might be of more interest to retailers and the tax office, but the median income might be of more interest to welfare organisations. In the calculation of the mean, these groups are interested in the total amount that is available (in this case it is money) but welfare groups are interested in the number of units that this amount is distributed amongst.
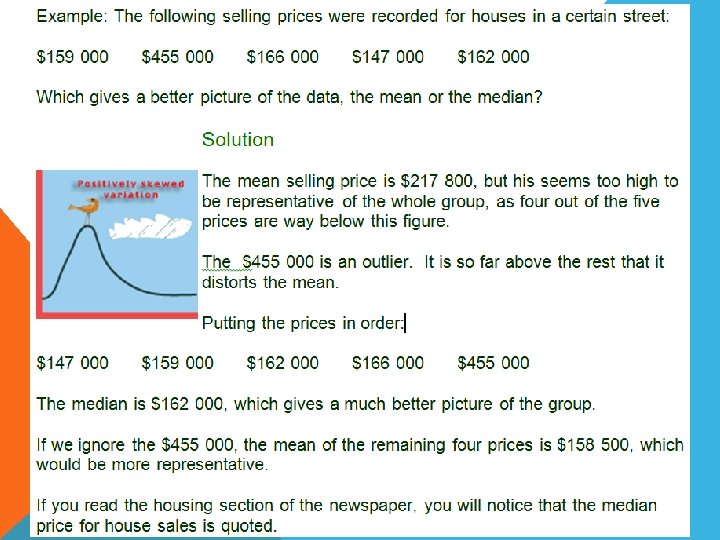
AN EXAMPLE In real estate usage, the mean would be used to describe the average value of a portfolio of houses being offered for sale by a real estate agent. However, someone wanting to buy a home from that real estate agent would use the median or middle house value. This is because the median does not alter when there are extreme values (outliers) in a data set.
TO ILLUSTRATE. Set A: 30 40 50 60 70 mean = 50 & median = 50 Set B; 30 40 50 60 700 mean = 176 & median = 50 The value 700 is an outlier because it is a long way from the next nearest data value, 60.
OUTLIERS An outlier can be an unusual, important observation. Alternatively, it could be a mismeasurement. Understanding the context and checking the data might resolve questions associated with the outlier, but often there is a dilemma about how outliers should be treated.
OUTLIERS DISTORT Outliers can distort the mean of a set of data. Data involving income or pricing is often summarised using the median. For example, in the real estate section of the newspaper, the median house price for a suburb is often used rather than the mean price because an outlier such as a very high priced mansion will have less effect on the median price than it would on the mean house price. You might also note that the highest and lowest prices will also be reported so that potential buyers or sellers have some idea of the range of prices paid for a house in that suburb.
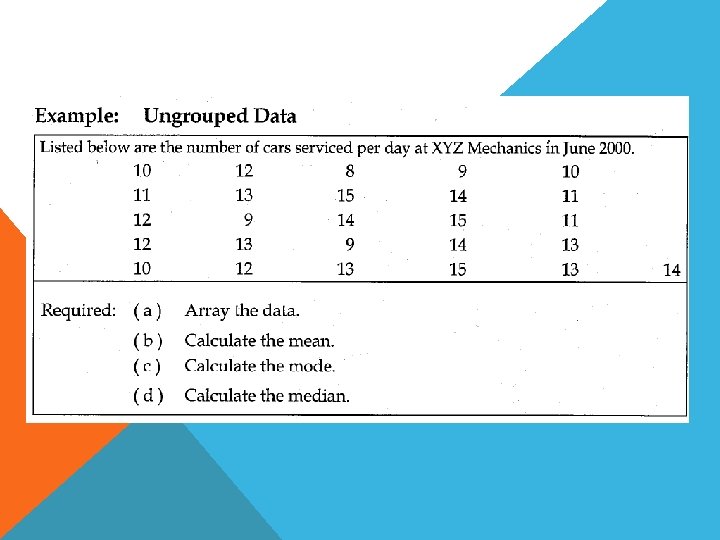
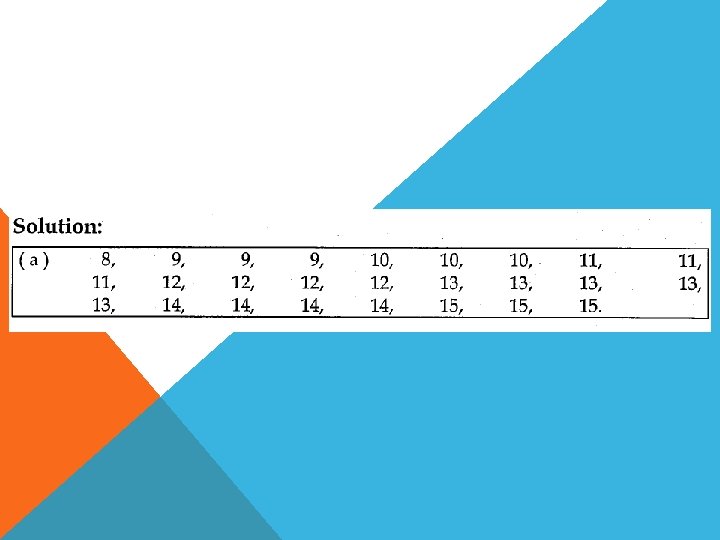
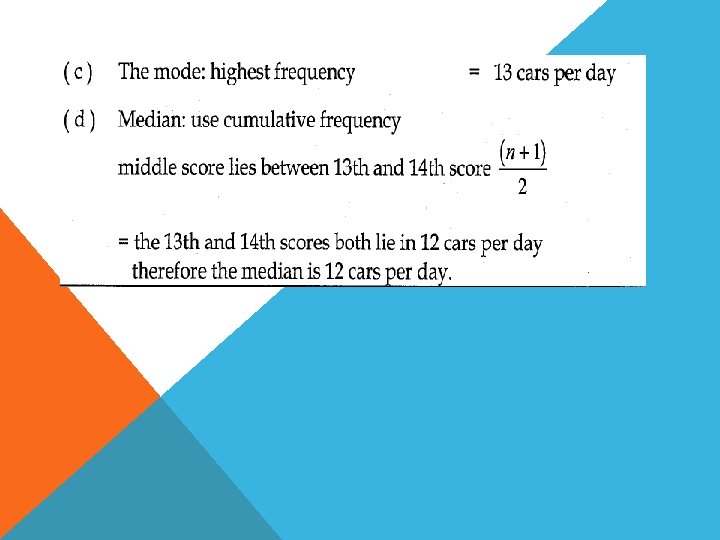
See below … what if on there was one more day -27 days and on that day 8 cars were serviced? We would have 27 + 1 = 28 /2 = 14 – the 14 th score would be right in the middle with 13 scores above it and 13 scores below it The median would still be 12 – the raw data would look like this…. 8, 8, 9, 9, 9, 10, 10, 11, 11, 12, 12, 13, 13, 13, 14, 14, 15, 15,
New Calc - 2 nd F , Alpha, 0, 0 then Mode , 1, 0, 245, (xy) button, 9, ent (continue with the rest of the data. . . then RCL 4 will give the mean
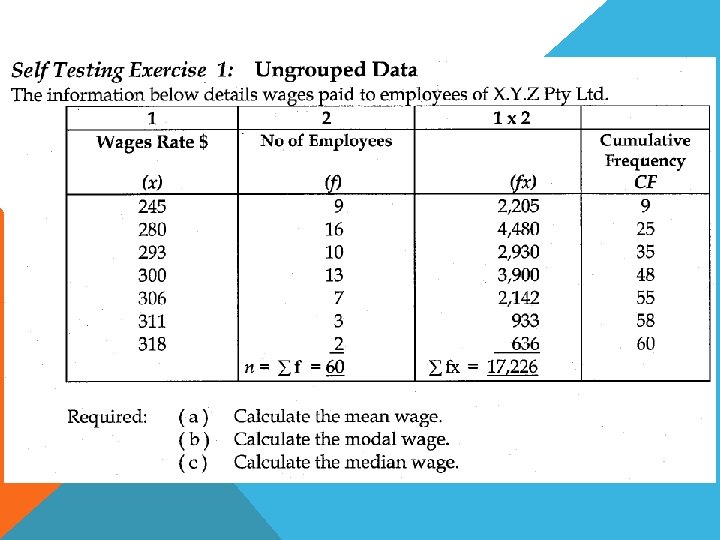
Self test 1 Solutions continued. .
GEOMETRIC MEAN
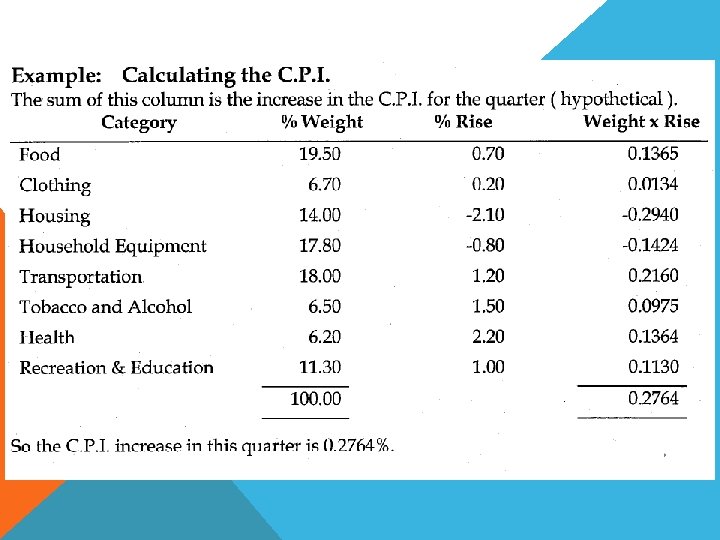
EXAMPLE Resident population of Australia as at 30 June in years 1996 - 2000 Year Population(‘ 000) Percentage change 1996 18 423. 6 1. 250 1997 18 618. 3 1. 056 1998 18 842. 2 1. 203 1999 19 051. 2 1. 109 2000 19 162. 6 0. 585 18618. 3 – 18423. 6 = 194. 7 18423. 6 x 1. 010567967 = 18618. 3 194. 7 / 18423. 6 =. 0105679 +1 = 1. 01056
GEOMETRIC MEAN The Geometric Mean can be used to find the mean of the data, however it is often more relevant to find this value for the % change. The geometric mean is ____________________ =5 √(1. 250)(1. 056)(1. 203)(1. 109)(0. 585). _____ =5 √(1. 250) = 1. 006
. Using the Sharp EL-738 calculator • press orange 2 nd F key • press key with B at top left corner and BOND (this allows to calculate a root other than the square root) • Now you can enter the root (in this case 5) using the arrow buttons go left until the cursor is flashing on top of the decimal point. Now enter 5 • Now arrow right until the cursor is flashing on the right of the root sign • Open bracket (below DEL key) and now enter data with multiplication symbol between each number • Close bracket and press Equal key Using this measure, the mean annual increase in the resident population of Australia between 1996 and 2000 was 1. 006%
NEGATIVE CHANGES IN PERCENTAGE The previous formula for Geometric Mean is undefined for negative changes. To overcome this problem, we must relate all of the changes to 100%. Negative percentages must be subtracted from 100% and positive changes added to 100%. The geometric mean of % change is. . n √(100+r 1) x (100+r 2) x…(100+rn)
EXAMPLE Number of long term arrivals who are Australian residents returning home for the period February – June 2000 Month Number of long term arrivals Percentage change February 5820 -11. 95 March 5310 -8. 76 April 6080 14. 50 May 4560 -25. 00 June 5520 21. 05
THE GEOMETRIC MEAN Geometric mean = 5√(88. 05) x (91. 24) x (114. 50) x (75. 00) x (121. 05) = 96. 46 Since this figure is less than 100 (representing a decrease) we must subtract its value from 100 to yield 3. 54. This means that the monthly change in long term Australian residents returning home during the five month period was a decrease of 3. 54%
. If the figure had been more than 100, we would have subtracted 100 from the figure to obtain the % mean increase.
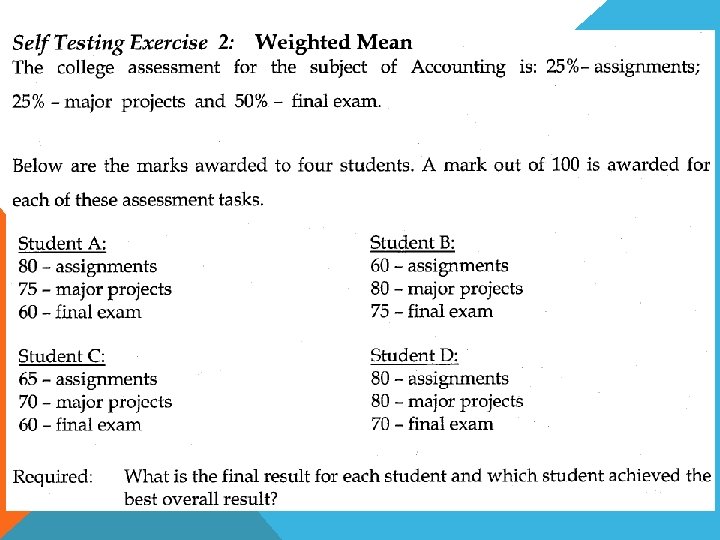
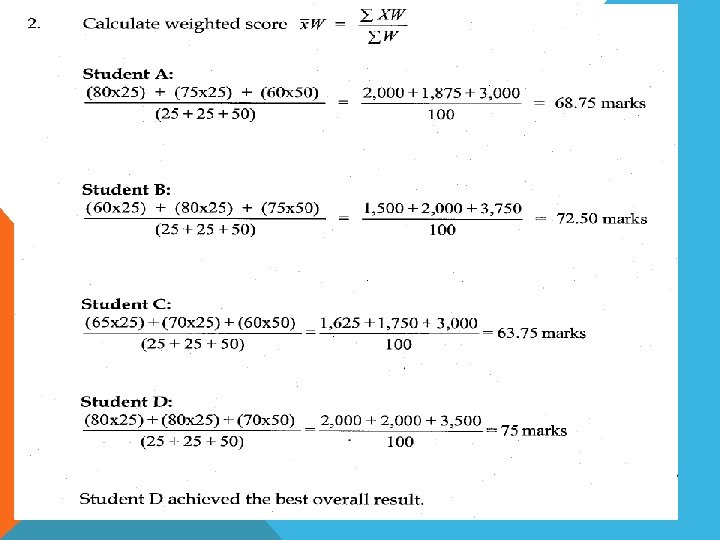
Another alternative 80 x. 25 , M+, 75 x. 25, M+, 60 x. 5, M+ , RCL, M+ - answer 68. 75 Or with calc in stat mode - mode, 1, 0, 80, (x, y), 25, ent, 75 …. . . then RCL, 4 Old Fin Calc buttons below
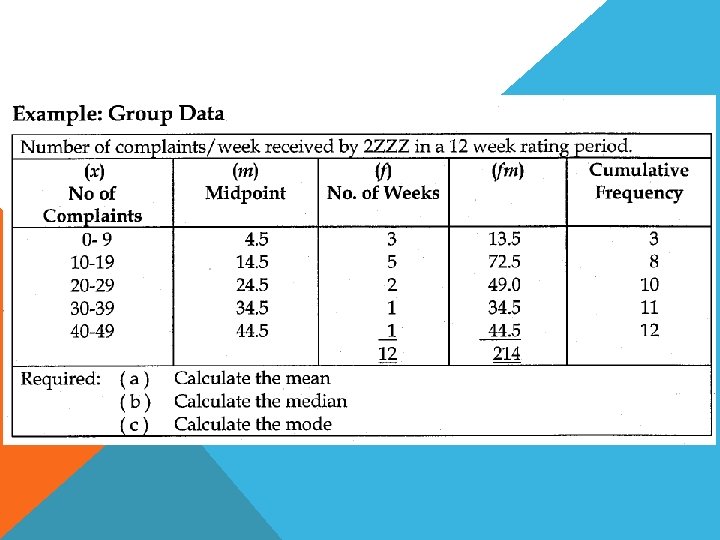
The median is somewhere in the group 10 – 19
The modal group is 10 – 19
In Summary
Suggested Questions from Textbook…… Select a range of questions from the Problems in this chapter – enough so that you feel comfortable with this topic