What are clinical trials FDA A clinical trial


 Group 2 (Female) Success Yes Regimen A 289")


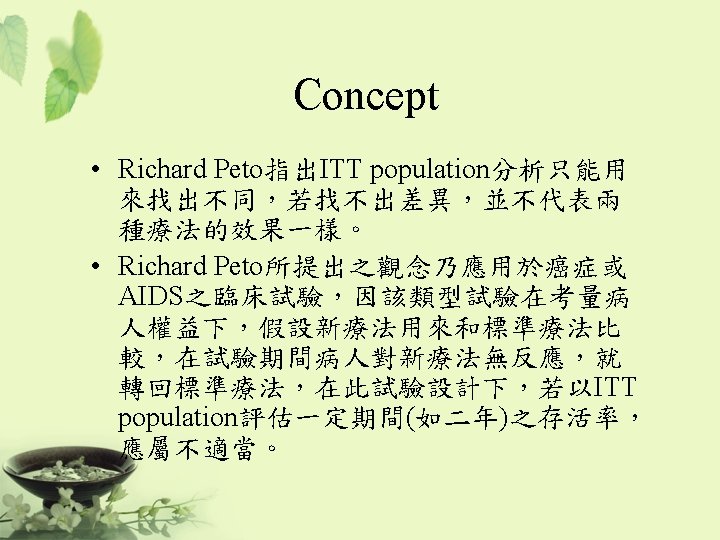
 • Other countries")
 should be the variable capable")


 Methods of analysis (appropriate statistical methods)")

")


 – Null hypothesis: There is no")
![Relationship Among Non-inferiority, Superiority, and Equivalence µs-d [ |¬ µs | µs+d ] Equivalence](https://slidetodoc.com/presentation_image_h/d48dca7fc42c1b2062eccda3de13f224/image-47.jpg "Relationship Among Non-inferiority, Superiority, and Equivalence µs-d [ |¬ µs | µs+d ] Equivalence")
![Relationship Among Non-inferiority, Superiority, and Equivalence µs-d [ Inferiority®|¬ µs µs+d | ] Non-inferiority](https://slidetodoc.com/presentation_image_h/d48dca7fc42c1b2062eccda3de13f224/image-48.jpg "Relationship Among Non-inferiority, Superiority, and Equivalence µs-d [ Inferiority®|¬ µs µs+d | ] Non-inferiority")
![Relationship Among Non-inferiority, Superiority, and Equivalence µs-d [ µs | µs+d ] Non-superiority ®|¬](https://slidetodoc.com/presentation_image_h/d48dca7fc42c1b2062eccda3de13f224/image-49.jpg "Relationship Among Non-inferiority, Superiority, and Equivalence µs-d [ µs | µs+d ] Non-superiority ®|¬")


 indicates that the")


 – Drug Information Journal. Vol.")


 • Test statistics •")


 • Fisher’s")
")
 – Log-rank test (PROC")


 Set • Full Analysis Set • Per")


")
")

- Slides: 104
What are clinical trials? • FDA – A clinical trial is the clinical investigation of a drug which is administered or dispensed to, or used involving one or more human subjects. • 台灣行政院衛生署 – 藥品施用於病人或健康自願者身上,已發現或 驗證其療效,認明其不良反應、研究該藥品在 人體的吸收、分布、代謝和排泄過程,以確定 其有效性和安全性的系統性研究。
ICH 制定規範 • Q: “Quality” – Chemical and Pharmaceutical Quality Assurance • 安定性試驗 • S: “Safety” – In vitro and in vivo pre-clinical studies • E: “Efficacy” – Clinical studies in human subject • E 6 – GCP • E 8 – General considerations for clinical trials • E 9 – Statistical principles for clinical trials • M: “Multidisciplinary” – Not fit uniquely into one of the above categories
Paper CRF、e-CRF
Basic Principle on Clinical Trial Design • Objective – To obtain an unbiased and reliable assessment of given regimen response, independent of any known or unknown prognostic factors. • Principle Allocation at random Representative Blinding Reliability Control group Reproducibility
Allocation at Random • Tends to produce treatment groups in which the distributions of prognostic factors are similar – Stratification • If there are known factors that could affect the outcome (center, age, sex, baseline risk) • Only one or few factors used for stratification – Block • Block size divisible by number of treatment • Block size of two is not used
Simpson’s Paradox Overall Group 1 (Male) Group 2 (Female) Success Yes Regimen A 289 (83%) Regimen B 273 (78%) No 61 (17%) 77 (22%) Yes 234 (83%) 81 (93%) No 36 (17%) 6 (7%) Yes 55 (69%) 192 (73%) No 25 (31%) 71 (27%)
Permuted-Block Randomization • Random Allocation within each block – 1, 2, 3, 4 • By Random Selection of Blocks – – – TTPP PPTT TPTP TPPT PTTP
Blinding • To limit the occurrence of conscious and unconscious bias in the conduct and interpretation of a clinical trial – Open – Single Blind – Double Blind • To maintain the blind a control must look, smell, taste and feel the same as the comparator of interest, whether the treatment is a placebo or an active control – maybe with double dummy.
Double Dummy • Occasions – No matching placebo available – Different frequencies • Example
Control Groups • Placebo control • U. S. FDA (most desirable) • Other countries (less acceptable) • Unethical (sometime) • Active comparator control • Established, standard treatment used for the condition • Three treatment group (placebo & active) • Historical control • Cancer trial • No control (observational study)
Representative • The primary variable (“target” variable, primary endpoint) should be the variable capable of providing the most clinically relevant and convincing evidence directly related to the primary objective of the trial. – ICH E 9
Reliability • If any of the efficacy or safety assessments was not standard, i. e. , widely used and generally recognized are reliable, accurate and relevant (able to discriminate between effective and ineffective agents), its reliability, accuracy and relevance should be documented. It may be helpful to describe alternatives considered but rejected. – ICH E 3
Reproducibility • If the outcome is to be recorded on different sessions then one should know the repeatability of the measure so one can appropriately quantify any longitudinal treatment effect.
Three Key Components • Experimental unit – A subject from a targeted population under study • Treatment – It could be a placebo or any combinations of (pharmaceutical entity, diet, surgical procedure, diagnostic test, medical device, no treatment) • Evaluation – Efficacy analysis (Clinical endpoints) – Safety assessment (Adverse experience, Laboratory test results) – Others (Quality of life assessment, Pharmacoeconomics and outcomes research)
Adequate and Well-controlled Study • • Objective (clear) Methods of analysis (appropriate statistical methods) Design (valid for addressing scientific questions) Selection of subjects (assurance of the disease under study) Assignment of subjects (minimize bias) Participants of studies (minimize bias) Assessment of responses (well-defined and reliable) Assessment of the effect (accurate and reliable)
Key Statistical Concepts • • • Bias and Variability Hypothesis Testing Type I Error and Power Confounding and Interaction Statistical Difference vs Clinical Difference Sample Size
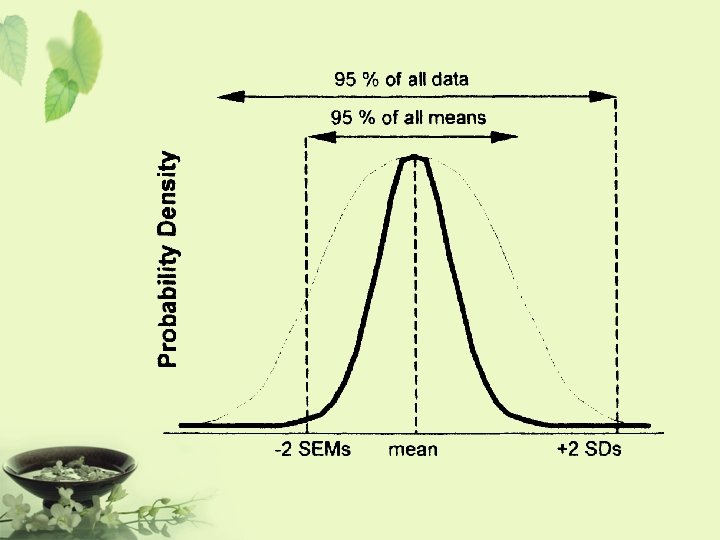
Bias • An inclination or preference that interferes with impartial judgment (Webster’s Dictionary, 1984) • A systematic error that enters a clinical trial and distorted the data obtained as opposed to a random error (Spilker, 1991) • It measures the closeness of the test result to the true value (e. g. , population mean) • Accuracy
Variability • A measure of precision or reliability that is referred to as the degree of closeness of clinical results to the true value regarding the targeted patient population • The higher precision, the more likely the result can be reproduced • Precision
Bias and Variability Less bias, small variability Large bias, small variability Less bias, large variability Large bias, large variability
Bias and Variability • It is not possible to avoid bias and variability in real world. • It is important to – identify, – eliminate, and – control the bias/variability to an acceptable limit.
Step on Performing Hypotheses Testing • Choose the null hypothesis that is to be questioned. • Choose an alternative hypothesis that is of particular interest to the investigators. • Select a test statistic, and define the rejection region (or a rule) for decision making about when to reject the null hypothesis and when not to reject it. • Draw a random sample by conducting a clinical trial. • Calculate the test statistic and its corresponding pvalue. • Make conclusion according to the predetermined rule.
Type of Hypotheses Testing • Test for Equivalence • Test for Non-inferiority • Test for Superiority – Clinical – Statistical
Test for Equivalence • Purpose – To show that the test drug can reach the same therapeutic effect as that of a standard therapy (or an active agent) or they are therapeutically equivalent
Test for Equivalence • Hypothesis – Null hypothesis: There is a clinically meaningful difference between the test drug and the standard therapy – Alternative hypothesis: There is no clinically meaningful difference between the test drug and the standard therapy • The rejection of the null hypothesis suggests that there is no clinically meaningful difference between the test drug and the standard therapy and hence we conclude that the test drug is equivalent to the standard therapy.
Test for Non-inferiority • Purpose – To show that the test drug is no worse than a standard therapy or an active agent • Situations where it is applicable – The test drug is less toxic – The test drug is easier to administer – The test drug is less expensive
Test for Non-inferiority • Hypothesis – Null hypothesis: The test drug is inferior to the standard therapy – Alternative hypothesis: The test drug is not inferior to the standard therapy • The concept is to reject the null hypothesis and conclude that the difference between the test drug and the standard therapy is less than a clinically meaningful difference and hence the test drug is no worse than the standard therapy.
Test for Superiority • Purpose – To show that the test drug is superior to a standard therapy or an active agent
Test for Superiority • Hypothesis (Statistically -> Clinically) – Null hypothesis: There is no clinically meaningful difference between the test drug and the standard therapy – Alternative hypothesis: The test drug is superior to the standard therapy • The rejection of the null hypothesis suggests that the difference between the test drug and the standard therapy is greater than a clinically meaningful difference and hence we conclude that the test drug is superior to the standard therapy.
Relationship Among Non-inferiority, Superiority, and Equivalence µs-d [ |¬ µs | µs+d ] Equivalence ®| There is no clinically significantly meaningful difference between the test drug and the standard therapy. It is usually referred to as two-sided equivalence.
Relationship Among Non-inferiority, Superiority, and Equivalence µs-d [ Inferiority®|¬ µs µs+d | ] Non-inferiority = at least as effective as … It is also referred to as one-sided equivalence
Relationship Among Non-inferiority, Superiority, and Equivalence µs-d [ µs | µs+d ] Non-superiority ®|¬ Superiority Non-superiority = at most as effective as … It is also referred to as one-sided equivalence
Relationship Among Non-inferiority, Superiority, and Equivalence µs-d [ Inferiority ®|¬ |¬ µs | Equivalence µs+d ] ®|¬ Superiority Non-inferiority Non-superiority ®| One-sided Equivalence
Relationship Among Non-inferiority, Superiority, and Equivalence µs-d [ Inferiority ®|¬ H 0: µT-µs £ -d Ha: µT-µs > -d µs | Equivalence H 0: |µT-µs| ³ d Ha: |µT-µs| < d µs+d ] ®|¬ Superiority H 0: µT-µs £ d Ha: µT-µs > d Would like to reject the null hypothesis and conclude the alternative hypothesis
Relationship Among Non-inferiority, Superiority, and Equivalence
Equivalence Margin
Type I Error and Power Null hypothesis: The drug is ineffective Alternative hypothesis: The drug is effective Type I error : the drug works when in fact it doesn’t. Type II error : the drug doesn’t work when in fact it does. P-value : the probability of observing a type I error. Power : the probability of correctly concluding that the drug works when in fact it does.
Type I Error and Power
Type I Error and Power • Decrease type I error will result in increasing type II error, and consequently decreasing power. • Increase sample size will decrease both type I and type II errors. • Fixed type I error and select a sample size to achieve the desired power.
Confounding and Interaction • Confounding – Confounding effects are defined as effects which are contributed by various factors that cannot be separated by the design under study. • Interaction – The interaction effect between factors is defined as the joint effect contributed by more than one factor.
Confounding • Lab Example – Dr. Anderson noticed that recent laboratory test results failed to pass QC/QA requirements – Dr. Anderson decided to improve the laboratory procedure by purchasing a more advanced equipment – The accuracy and precision of the laboratory test results improve significantly and meet the QC/QA • Question – It is not clear whether the improvement in laboratory test results is due to the advanced new equipment or due to the analyst who has more experience than the previous analyst.
Interaction • Quantitative interaction between treatment and center (or study site) indicates that the treatment differences are in the same direction across centers but the magnitude differs from center to center. • Qualitative interaction Substantial treatment differences occur in different directions in different centers.
Center-by-Treatment Interaction Treatment Control Center 1 Center 2 Quantitative interaction - centers could be combined.
Center-by-Treatment Interaction Drug A Drug B Center 1 Drug A Center 2 Qualitative interaction - centers cannot be combined.
Confounding and Interaction • Study design should avoid or be able to account for potential – Confounding factors – Interaction factors • Objectives – To provide a valid and fair assessment of the treatment effect – To assess the treatment difference efficiently
Impact on Center Imbalance • Coefficient of Imbalance (λ) – Drug Information Journal. Vol. 38 pp. 387 -394, 2004 At α=0. 05 1 Power (90%) 90% Power (80%) 80% 0. 5 Power (90%) 63% Power (80%) 50% 0. 9 86% 75% 0. 4 53% 42% 0. 8 82% 70% 0. 3 42% 33% 0. 7 77% 64% 0. 2 30% 23% 0. 6 70% 58% 0. 1 17% 14% λ λ
Example of Center Imbalance Source Sample No. of Size Country 1 -α/2 1 -β λ Adjuste d Power Trial I 885 29 0. 95 0. 8 0. 90739 0. 761 Trial II 143 9 0. 95 0. 8 0. 45696 0. 474 Trial III 518 25 0. 95 0. 86231 0. 739
No. of Centers and Size of Center • Balance in each center • Number of patients in each centers – The number of patients in each center should not be less than the number of centers
Statistical Difference vs. Scientific Difference • Clinical Scientists & Researchers – The observed difference is of clinical meaning and yet not statistically significance (You must be out of your mind!) – The observed difference is of little clinical meaning but it is statistically significant (Who cares? ) • Statisticians – P-value must be less than 0. 05 in order to have statistical meaning
Statistical Difference vs. Scientific Difference • Statistical difference – A difference which is unlikely to occur by chance alone. • Clinical/Scientific difference – A difference which is considered important to the clinical scientists.
Statistical Difference vs. Scientific Difference Statistical difference Clinical difference * May be due to large variability and/or small sample size
Sample Size Determination Information Required • Study objectives – Test for equivalence – Test for non-inferiority – Test for superiority (clinically/statistically) • Study design – Parallel or crossover – Group sequential design – Other designs • Primary study endpoint(s) – Continuous or discrete – Multiple study endpoints
Sample Size Determination Information Required • Clinically meaningful difference – Clinically important difference – Non-inferiority/superiority margin – Equivalence/similarity limit • Significance level – 1% or 5% • Desired power – 80% or 90% • Other information, e. g. , – Stratification? – 1: 1 ratio or 2: 1 ratio? – Log-transformation?
Parallel Design – Equivalence Hypotheses • • • : Population mean of the treatment : Population mean of the control : Equivalence limit.
Parallel Design – Equivalence Two one-sided test procedure (Schuirmann, 1987) • Test statistics • Reject the null hypothesis if
Parallel Design – Equivalence Power
Parallel Design – Equivalence Sample size calculation
Classification of Statistical Tests • Category – Treatment • Chi-square (PROC FREQ) • Fisher’s exact test (PROC FREQ) – Treatment + Others • CMH with table score (PROC FREQ) • CMH with rank score (PROC FREQ) • Logistic Regression (PROC LOGISTIC/ PROC CATMOD)
Classification of Statistical Tests • Quantitative – Treatment • Unpaired t test (PROC TTEST) • Wilcoxon rank-sum test (PROC NPAR 1 WAY) – Treatment + Others • GLM (PROC GLM) • GLM with rank-transformed (PROC RANK + PROC GLM)
Classification of Statistical Tests • Survival – Chi-square (PROC LIFEREG) – Log-rank test (PROC LIFETEST) – Cox proportional hazards model (PROC PHREG)
The t test
The t test
The t test
Example • A treatment is being examined to determine its effect on systolic blood pressure. • Twelve men participate in the study. • Their systolic blood pressure is measured both before and after the treatment is applied.
Results
Result
Result
Result
ANCOVA • Analysis of covariance combines some of the features of both regression and analysis of variance. Typically, a continuous variable (the covariate) is introduced into the model of an analysis-of-variance experiment. Example • Ten patients are selected for each treatment (Drug A or D), and six sites on each patient are measured for leprosy bacilli. • The covariate (a pretreatment score) is included in the model for increased precision in determining the effect of drug treatments on the posttreatment count of bacilli.
Result
Result
Analysis Population • Intent To Treat (ITT) Set • Full Analysis Set • Per Protocol Set (PP)
Superiority • In superiority trials the full analysis set is used in the primary analysis because it tends to avoid over-optimistic estimates of efficacy resulting from a per protocol analysis, since the non-compliers included in the full analysis set will generally diminish the estimated treatment effect.
Equivalence/Non-inferiority • In an equivalence or non-inferiority trial use of the full analysis set is generally not conservative and its role should be considered very carefully. • Subjects who withdraw or dropout of the treatment group or the comparator group will tend to have a lack of response, and hence the results of using the full analysis set may be biased toward demonstrating equivalence.
SAS Output Delivery System
What Is the Output Delivery System? • Prior to Version 7, SAS procedures that produced printed output generated output that was designed for a traditional line-printer. • Beginning with Version 7, procedure output became much more flexible. The Output Delivery System (ODS) has been designed to overcome the limitations of traditional SAS output and to make it easy to make new formatting options available to users. • ODS is a method of delivering output in a variety of formats and of making the formatted output easy to access.
Basic Concepts of the ODS • In the past, the term "output" has generally referred to the outcome of a SAS procedure step. You could send this output to the Output window if you were working in a windowing environment, to an output device if you were working in line mode, or to a file if you used PROC PRINTTO or SAS system options.
ODS Destinations • ODS currently supports four destinations: – The Listing destination produces monospace output, which is formatted like traditional SAS procedure output. (ODS LISTING) – The HTML destination produces output that is formatted in Hypertext Markup Language. (ODS HTML) – The Printer destination produces output that is formatted for high-resolution printers. (ODS PRINTER) – The Output destination produces SAS data sets. (ODS OUTPUT)
Example – t test PROC TTEST DATA=AH 01; VAR LABVALUE CHANGE; BY VISIT; RUN;
Output
ODS TRACE ON; PROC TTEST DATA=AH 01; VAR LABVALUE CHANGE; BY VISIT; RUN; ODS TRACE OFF;
LOG Output Added: ------Name: Statistics Label: Statistics Template: Stat. TTest. Statistics Path: Ttest. By. Group 1. Statistics ------Output Added: ------Name: TTests Label: T-Tests Template: Stat. TTests Path: Ttest. By. Group 1. TTests -------
Program ODS LISTING CLOSE; ODS OUTPUT STATISTICS=AS TTESTS=AT; PROC TTEST DATA=AH 01; VAR LABVALUE CHANGE; BY VISIT; RUN; ODS LISTING;
Contents (AS)
Contents (AT)
http: //v 8 doc. sas. com/sashtml/