Welcome Lean Six Sigma Certification Training Leaner Six


 3.")


 • Hypothesis Testing • DOE • QFD")


")


")


 Methodology")
 • SCORE (Traditional Model) Not")


 • Remove")
 • • More Like a Proposal •")


 is: • Leading project teams in")


 • Themes -")


 • Stand Alone Packages • Hypothesis Testing •")


 Defective Items (%) 1")


- Slides: 109
Welcome Lean Six Sigma Certification Training Leaner Six Sigma Lr. SS©: Day Five
What to Expect Next • • Review • Time Management Tool • Value Stream Mapping • GEMBA • CTQ Tree • Y=f(x) • Gauge R&R etc. Stat Presentation
ANALYZE Popular Ideas and Tool
Purpose of Basic Statistics • Provide the basis for making inferences about the future. • Provide the foundation for assessing process capability. • Provide a common language to be used throughout an organization to describe processes. 4
Statistical Tools Cheat Sheet Summation The Standard Deviation of sample data The Standard Deviation of population data The variance of sample data The variance of population data The range of data The average range of data An individual value, an observation A particular (1 st) individual value For each, all, individual values The Mean, average of sample data The grand Mean, grand average The Mean of population data A proportion of sample data Multi-purpose notation, i. e. # of subgroups, # of classes A proportion of population data The absolute value of some term Sample size Greater than, less than Greater than or equal to, less than or equal to Population size
Flow Chart Symbol Reminder Toolbox
Statistical Tools Cheat Sheet Summation The Standard Deviation of sample data The Standard Deviation of population data The variance of sample data The variance of population data The range of data The average range of data An individual value, an observation A particular (1 st) individual value For each, all, individual values The Mean, average of sample data The grand Mean, grand average The Mean of population data A proportion of sample data Multi-purpose notation, i. e. # of subgroups, # of classes A proportion of population data The absolute value of some term Sample size Greater than, less than Greater than or equal to, less than or equal to Population size
Descriptive • Basic Form • Terms you will hear are: • Mode • Median • Mean • Central Tendency • Range • Variance • Variation
Inferential Statistics • With inferential statistics, you are trying to reach conclusions that extend beyond the immediate data • Guesses about the population • Example: Correlation Analysis • Based on Samples • Sampling is one of the homework assignments • Sampling is a science of its own
Leaner Way to Look at Data • Two general categories: Quantitative Techniques • Graphical Techniques •
Quantitative Techniques • Statistical Procedures that yield • Numeric • Tabular Output • Examples • Hypothesis Testing • Analysis of Variance • Confidence Intervals
Graphical Techniques • Histograms • Scatter Diagrams • Box Plots • Pareto Charts
Data is Treated By the Way it is Classified
Data Classification • Nominal • Hair color: blonde, brown, red, black, etc. • Ordinal • freshman, sophomore, junior, senior • Interval • temperature scales are interval data with 25 C warmer than 20 C
Normal Distribution/Standard Deviation
STANDARD DEVIATION Calculation: 1. Add up Data Point 2. Determine your Mean (Average) 3. Subtract your Mean from Each Number 4. Square Each Number 5. Add the Squared Numbers Up and Divide by the Count 6. This gives Your Variance 7. Find the Square Root of the Variance
Calculation DATA Points: -5, 1, 8, 7, 2 1. Add up Data Point = 13 2. Determine your Mean (Average) = 2. 6 Subtract your Mean from Each Number -5, 1, 8, 7, 2 -7. 6, -1. 6, 5. 4, 4. 4, -0. 6 Squared: 57. 76, 2. 56, 29. 16, 19. 36, 0. 36 Add the Squared Numbers Up: 109. 2 and Divide by the Count: 5 Variance: 21. 84 Square that: 4. 6
Variance • Imagine a sales manager looking at the sales figures for three different salespeople. • Variance measures how different the individual values of the data are one from the other. • Data with low variance contains values that are identical or similar: 6, 7, 6, 6, 7. • Data with high variance contains values that are not similar: 598, 1, 134, 5, 92.
Correlation Index • Inferential statistic • Comparing data • Relationships of the data expressed numerically • None = 0 • Positive = 1 (perfect) • Negative = -1 (perfect)
Advanced Paths • MSA (Reminder) • Hypothesis Testing • DOE • QFD
Stat Tools • T-Tests • F-Tests • ANo. VA • Hypothesis Testing • Design of Experiment
When I Focus on Solutions I Feel Good!
IT’S TIME FOR A BREAK
What to Expect Next • Other Process Improvement Methodologies • Design for Six Sigma • Break • Additional Graphs/Charts Used in LSS • • Spaghetti Diagram • Gantt Chart • Pert Chart • Thought Process Map Mistake Proofing
Other Process Improvement Methodologies • CMM • ISO • ITIL • Agile
Other Process Improvement Methodologies • CMM • ISO • • ITIL • • 13053 The Six Sigma Standard 5 Volumes (Continuous Improvement Volume) Agile
MATURITY LEVELS Level 1 Level 2 Initial Managed No Process Documents Reactive to Customer Process Documented Level 3 Defined Process for Organization Documented Level 4 Level 5 Quantitavely Managed Optimized Processes measured & evaluated Processes Optimized
DFSS Design for Six Sigma Additional Model Something from Scratch
Design for Six Sigma Applications of Six Sigma that focus on the design or redesign of products and services and their enabling processes so that from the beginning customer needs and expectations are fulfilled are known as Design for Six Sigma or DFSS. 10/18/2021 30
Design for Six Sigma • DFSS • Examples • IDDOV • DMADV • DCCDI
IDDOV Approach • One DFSS Approach • Product Quality Improvement • Identify • Define • Design • Optimize • Verify 10/18/2021 32
Remember DMAIC – Tool Box DMAIC Define Measure Analyze Improve Control • Charter • SIPOC • Thought Process Map Tools Kit – Common set • Process Mapping • Measurement System Evaluation (MSE) • Introduction to Variation (Statistics) • • • Above tools Failure Mode & Effects Analysis (FMEA) Lean Tools Design of Experiments (DOE) Above tools Design of Experiments (DOE) Voice of the Process (Control Charts) Above tools Control Plans 10/18/2021 33
DFSS MODELS Have Tool Boxes and Methodologies too! 10/18/2021 34
DMADV – Why? • Designing New Products • When You Don’t Have an Existing Product or Service • DMAIC often assumes you are making something better, not necessarily creating it from scratch 10/18/2021 35
DCCDI • Define • Customer • Concept • Design • Implementation 10/18/2021 36
DCCDI • Define – project goal • Customer – analysis is completed • Concept – ideas are developed, reviewed and selected • Design – is performed to meet specs • Implementation – completed to commercialize the product or service 10/18/2021 37
Price Waterhouse Coopers • Some Companies Personalize the DFSS Model • This is Why No One Expects You to Know them Without Training • PWC • D-M-E-D-I • What do you think the letters stand for? 10/18/2021 38
DMEDI • Define • Measure • Explore • Develop • Implement 10/18/2021 39
Student Exercise Make Your Own Design for Six Sigma Model
Spaghetti Diagram
Flow of Metals Spaghetti Diagram Flow of Metals (Traditional)
In Measure Spaghetti Diagrams BEFORE
Before
In Improve Spaghetti Diagrams AFTER
After
Gantt – Graphical Representation of a WBS
Gantt
PERT Chart
PERT Chart
PERT Chart
TPM – Thought Process Mapping (Mind Mapping)
Approaches Mistake Proofing Kaizen Agile PM vs. Traditional PM
Mistake Proofing https: //www. youtube. com/watch? v=TRb. C 9 Tj. Fdh. U https: //www. youtube. com/watch? v=q. Ph. VZ Exc. GXg
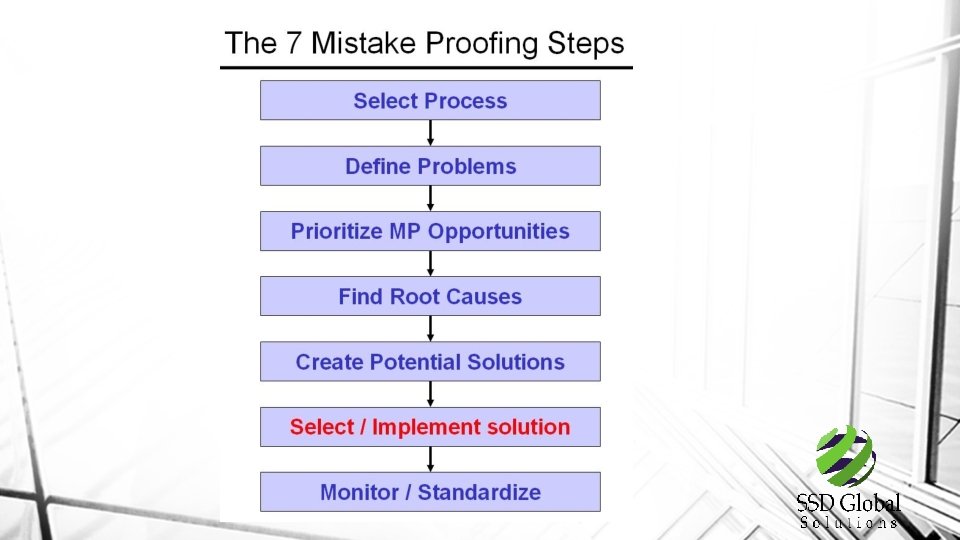
Poka Yoke (pronounced PO-ka yo-KAY) Methodology
Kaizen Approach • PDCA • DMAIC • DMADV (DFSS) • SCORE (Traditional Model) Not to be reprinted without the expressed written permission by SSD Global, Inc.
The Acronym of SCORE § Select the process to be worked on. § Clarify the problem statement and project objective. Measure historical data to quantify the current capability. § Organize the team members and train them on methods and scope of project. Ready the work place and interfaces such as suppliers, customers, and facilities people. § Run the event (observe, brainstorm improvements, select improvements, test, implement). § Evaluate the results! 58
The Timing of SCORE Select – 1 day to one week Clarify – 1 day to one Week Organize – 1 day to one Week Run – 3 to 5 days Evaluate – Up to 3 weeks 59
SCORE AND DMAIC SCORE DMAIC Select Define Clarify Measure Organize Analyze Run Improve Evaluate Control
Which Method? Rapid problem solving § PDCA § Plan Do Check Act § Six Sigma (DMAIC) § Define Measure Analyze Improve Control § SCORE § Select Clarify Organize Run Evaluate § Design for Six Sigma (DFSS) § Define Measure Analyze Design Verify 61
Selecting a Method Does a Process Management System Exist Recognize a Problem ? Process Management N Y Y N Is the Solution Known ? N Y PDCA Obvious root cause, obvious solution N Are Solutions Obvious ? N Is it a New Product or Process ? N Is Cycle time Reduction the Objective ? Y Y Kaizen N Obvious root cause, non-data driven solution Is an Invention Required ? Y Is the Time Bottleneck Defect Driven ? N Y DFSS R&D Lean (Usually Kaizen) N DMAIC Y
Traditional Project Manager Scrum Master Not to be reprinted without the expressed written permission by SSD Global, Inc. 63
Project Manager’s Role Lead Communicate Define Plan Monitor Communicate Re-Plan Complete
Project Charter • Project Goal & Objective • Decision making • Sponsor • Assumptions • Stakeholders • Risks • Timeline • Business process changes • Resources required • Project manager Deliverables • Project team • Budget • Signatures •
Scrum Master • Also a Project Manager • Servant-Leader (focus is different) • Remove impediments • Make sure the team has all the necessary tools and resources to make the project run smoothly Not to be reprinted without the expressed written permission by SSD Global, Inc. 66
Agile Project Charters (when there is one) • • More Like a Proposal • Similar to process improvement in DMAIC • I’d like the opportunity to work on this but I don’t necessarily know the solution. Servant-Leader (so focus is different) • Remove impediments • Make sure the team has all the necessary tools and resources to make the project run smoothly Not to be reprinted without the expressed written permission by SSD Global, Inc. 67
Why Agile Project Management? Co Ex ns pe um cta er tio ns As consumers today we want and expect innovative products: faster, cheaper and with better quality than those we’ve seen in the past. 68
Increased Work Pressure Business Expectations As knowledge workers, our business tools have improved our capability to be productive, raising work expectations. 69
Theory of Misaligned Expectations Consumer Expectations Business Expectations Consumer Expectations We usually get this… Or all too often, this. Consumer Expectations ss s e n si ation u B ct pe Ex Business Expectations However, Instead of this… 70 Productivity Driving Customer value Misalignment of Value definitions Orthogonal Opposition to Customer Value
Agile & Lean Timeline History & Influences Evolution Early 1900 s Early 1990 s • Walter Shewhart: Plan-Do-Study-Act, SPC Mid 1900 s • Edward Deming: SPC, TQM • Toyota: Toyota Production System (TPS) • Peter Drucker: Knowledge Worker Late 1900 s • Womack and Jones: Lean Thinking • Eli Goldratt: Theory of Constraints • Tom Gilb: Evo • The Toyota Way • Crystal Methods • Lean Software Development • Dynamic Software Development Method (DSDM) Mid 1990 s • Feature Driven Development (FDD) • e. Xtreme Programming (XP) • Adaptive Software Development 2001: Manifesto for Agile Software Development 2005: Declaration of Interdependence 71
Key Agile Principles are: Focus on Customer Value – Align project, product and team visions to deliver better product quality – faster and cheaper. • Small Batches - Create a flow of value to customers by “chunking” feature delivery into small increments. • Small, Integrated Teams - Intense collaboration via face-to-face communication, collocation, etc; diversified roles on integrated, selforganizing, self-disciplined teams. • Small, Continuous Improvements – Teams reflect, learn and adapt to change; work informs the plan. • Delivering Customer Value with Agile Project Management The right product, at the right time, for the right price. • Higher Quality: “Designed-to-fit” product with flexibility to change. • Increased Throughput: Iterative and incremental project and product “chunks” with earlier value delivery. Waste: Lean, efficient processes with lower costs and higher productivity. • Reduced 72
Key Agile Practices: • Release Planning • Sprint Planning • Daily Scrum/Standup • Fixed-length sprints • Sprint Review • Sprint Retrospective Identify top-priority items and deliver them rapidly using: • Small batches • Small integrated teams • Small, continuous improvements 73
The Agile Manager’s Role Agile Project Management (APM) is: • Leading project teams in creating and responding to change through: • Small batches • Small, integrated teams • Small, continuous improvements • Light touch leadership: the work of energizing, empowering and enabling project teams to rapidly and reliably deliver customer value: • By engaging customers, and • Continuously learning and adapting to their changing needs and environments 74
Flexible Formal Structure Traditional Silos Product Owner PM BA Capacity Planner Architect BA Developer Tech Ops Extended Project Team BA Designer Core Project Team Prod. PM Tester Developer Product Owner Business Sponsor 75 Tester Release Manager Integrated Agile Team The Core Project Team ideally consists of 5 -9 (7 plus or minus 2) members. Developer Designer Security
Visuals 76
Collocate Team Members Effective collaborative workspaces need: • Common area for collaboration and community • “Caves” for privacy Phone calls • Emails • Web surfing • Other individual tasks • • Open “drafts” of information 77
Daily Standup Meeting Each participant answers 3 questions: 1 What did you do yesterday? 2 What will you do today? 3 What’s in your way? • These are not status sessions for the manager • They are team member commitments in front of the team 78
Burn Down Chart Burndown Not to be reprinted without the expressed written permission by SSD Global, Inc. 79
Sprints • 2 -4 Week cycles • During the cycles • No changes in the activity • No changes in the staff assigned Not to be reprinted without the expressed written permission by SSD Global, Inc. 80
Sprint Review • Whole team participate • Everyone is invited • Exercise • Think a small project you completed • Give us a 3 minute or less explanation Not to be reprinted without the expressed written permission by SSD Global, Inc. 81
Sprint Retrospectives • What do we want to start doing? • What do we want to stop doing? • What do I want to continue to keep doing? Not to be reprinted without the expressed written permission by SSD Global, Inc. 82
Agile Terms Other Terms: • Chicken (anyone not on the team) • Themes - top-level objective that may span projects and products • User Stories – Requirements that are independent • Epics – a group of related user stories Not to be reprinted without the expressed written permission by SSD Global, Inc. 83
Words You May Know By a Different Name • Impediment Backlog – Constraints • Time boxing – Setting Durations for Tasks • Scrum Roles – Roles & Responsibilities • Scrum Master • Process or Product Owner • Team Not to be reprinted without the expressed written permission by SSD Global, Inc. 84
Agile Theories • Emergence • Best designs and ways of working come over a period of time by doing the actual work • Empiricism • Inspect and adopt – try things out and learn from the experience Not to be reprinted without the expressed written permission by SSD Global, Inc. 85
Disconnects with PM and Agile • Project management and project plans don’t typically build in flexibility • The planning process in heavily respected in PM and in Lean • PM and Lean favor writing specifications and documentation in advance Not to be reprinted without the expressed written permission by SSD Global, Inc. 86
Self Organization vs. Cross Functional Teams • Self Organization is an Agile Theory • Those closest to the work know how to do the work • Set clear goals and boundaries • Let them make the tactical and implementation decisions Not to be reprinted without the expressed written permission by SSD Global, Inc. 87
Leadership Development Promotes a Lot of Concepts in LSS • Remain Calm in Challenging Situations • Get Over Set Backs Quickly • Be Creative and See Solutions Where Others See Problems LSS Helps Us Do These Things
Statistical Software • Minitab (Six Sigma) • Stand Alone Packages • Hypothesis Testing • DOE • QI Macros • Excel Add-Ins • Charts and Graphs (Scatter/Pareto/Histogram) • Basic Statistical Calculations • Measures of Central Tendency • Confidence Levels, ROI formulas
Working with Different Models and Numbers Lean Six Sigma SSD Global
8 D is Short for Eight Disciplines D#1 - Establish the Team D#2 - Describe the problem. D#3 - Develop an Interim Containment Action D#4 - Define / Verify Root Cause D#5 - Choose / Verify Permanent Corrective Action D#6 - Implement / Validate Permanent Corrective Action D#7 - Prevent Recurrence D#8 - Recognize the Team SSD Global
The Softer Side of Lean Six Sigma Professional Skills Attention to History
Team Theory • Team Stages • • Forming, Storming, Norming, Performing Initiating a Team Responsibilities Roles and Responsibilities • Training • • Team Facilitation Techniques Brainstorming • Multivoting • SSD Global
Some Roadblocks to Improvement • Conflict • Change • Lack of Creative Thinking • Lack of Critical Thinking • Lack of Project Management Knowledge • Communication • Motivation SSD Global
Types of Conflict Management Skills • Win-Win • Collaboration • Agreement • Empathy • Communication SSD Global
Same Goes For Negotiation Skills • Win-Win • Collaboration • Agreement • Empathy • Communication SSD Global
How the New ISO 13053 for Six Sigma Is Surprisingly Lean
ISO 13053 -1 Quantitative Methods DMAIC Methodology ISO 13053 -2 Quantitative Methods Tools and Techniques
DMAIC Model Clearly Defined Process Create a Baseline M ea D trol su re ze nal y Con A Solution Confirmed and Plan for the Future ne i f e Establish Robust Improvements Improve Identify Gaps Between Baseline and Targets
INTERNATIONAL STANDARDS ORGANIZATION ISO • A worldwide federation of national standards bodies (ISO member bodies) Work is carried out through ISO technical committees • ISO is made up of 163 members which are divided into three categories: Member Bodies, Correspondent Members and Subscriber Members Standards (General) Standards are documented agreements containing technical specifications or other precise criteria to be used consistently as rules, guidelines, or definitions of characteristics, to ensure that materials, products, processes and services are fit for their purpose
ISO 13053 HAS A STRONG RELATIONSHIP TO: ISO 9001 This standard calls for a factual approach to decision making and for the practice of continual improvement ISO 21500 New standard outlining project management guidelines
Standard Does Not Cover Design for Six Sigma
Standard Does Include Concepts the Industry Would Typically Label as “Lean”
SIX SIGMA ACCORDING TO THE STANDARD Purpose Solve a given issue in order to contribute to an organizations business goals Activities Gather data Extract information through data analysis Design a solution Ensure the desired results
Standard Promotes Financial Accountability Models Industry Specific But Does Not Outline Details
Standard Recognizes Voice of the Customer
MEASURES BY SIGMA LEVELS 6 Sigma Level Defective Items (PPM) Defective Items (%) 1 697, 700 69. 77 % 2 308, 700 30. 87 % 3 66, 810 6. 681 % 4 6, 210 0. 621 % 5 233 0. 0233 % 6 3. 4 0. 00034 % 107
Standard Promotes Projects Be Completed Within 6 Months
When I Focus on Solutions I Feel Good!