LEAN PRODUCTION SYSTEMS Lean Techniques and Tools Kaizen


 Suppliers Flow with. Lean/JIT")


 value stream mapping works only for")


")
 System The production of items only as demanded for use or to")


 100 % Op 1 Op 2 Op 3 Op")
 100 % NUMBER OF OPERATIONS NOW DOWN TO 5")


 system for dramatically reducing the time it takes to")


 • Authorizes production")

 Fax Bin Shelf Broken Bag")


 Poka (mistake) Applying mistake proofing concepts to process or product improvements")
 • Error-proofing makes it difficult or impossible to do the job the")


- Slides: 152
LEAN PRODUCTION SYSTEMS Lean Techniques and Tools. Kaizen and Waste Elimination Yashika Anandani / Asst. Director (Training & Consultancy) National Productivity Secretariat
What is Lean “All we are trying to do is shorten the lead time…” Taiichi Ohno Lean focus on the elimination of waste in all forms, and smooth, efficient flow of materials and information throughout the value chain to obtain faster customer response, higher quality , and lower costs. Manufacturing and service operations that apply these principles are often called lean production systems.
Why do Lean? 1. Elimination of Waste: eliminate any activities that do not add value in an organization. Includes overproduction, waiting time, processing, inventory, and motion. 2. Increased Speed and Response: better process designs allow efficient responses to customers needs and the competitive environment. 3. Improved Quality: Poor quality creates waste, so improving quality is essential to the lean environment. 4. Reduced Cost: simplifying processes and improving efficiency translates to reduced costs.
Womack’s 5 Principles of Lean Thinking 1. Precisely define value from the customer's perspective 2. Identify thevalue stream for each service, and remove the waste 3. Make value flow without interruptions from beginning to end 4. Let the customer pull value from the process 5. Continuously pursueperfection
74 1. Define value from the customer's perspective
1. What is Value At the heart of lean is the concept of value. Any process that the customer would be prepared to pay for that adds value to the product. – The customer defines the value of service/product in a lean supply chain. – Value-adding activities transform the product /service closer to what the customer actually wants.
What is value? The task must physically change the information or product – Movement does not add value Customer must think the task is important – Is the customer willing to pay for it ? The task must be done right the first time – Continuous work-loops and iterations do not add value
DON’T SELL WHAT YOU CAN MAKE WHAT YOU CAN SELL
Anything that adds cost or time without adding value as defined by the primary customer is waste.
Interactive Class Exercise • The class breaks into 3 groups. Each group are given a service firm that should be familiar enough for everybody. • Identify the value/promises offered by this firm and five vital measures they need to satisfied. • Present the findings
Service Excellence – How to deliver customer satisfaction What matters to customers The Final Outcome The way the service kept its promise The way the service handled any problems = Drivers Delivery Initial Wait How long it takes overall Number of times had to contact the service Timeliness Accuracy Comprehensiveness Being kept informed about progress Information Competent Staff Being treated fairly Polite and friendly Staff How sympathetic staff were to your needs 30% 24% 18% 16% Professionalism Staff Attitude Satisfaction with Service 12%
What customer need? Organization Restaurant Organization Department Store © 2011 Pearson Education, Inc. publishing as Prentice Hall What is Inspected Standard Busboy Serves water and bread within 1 minute Busboy Clears all entree items and crumbs prior to dessert Waiter Knows and suggest specials, desserts What is Inspected Display areas Standard Attractive, well-organized, stocked, good lighting Stockrooms Rotation of goods, organized, clean Salesclerks Neat, courteous, very knowledgeable
What customer need? Organization Hospital What is Inspected Billing Standard Accurate, timely, and correct format Pharmacy Prescription accuracy, inventory accuracy Lab Audit for lab-test accuracy Nurses Charts immediately updated Admissions Data entered correctly and completely
What customer need? Organization Office Organization Hotel What is Inspected Standard Receptionist performance Is phone answered by the second ring Billing Accurate, timely, and correct format Attorney Promptness in returning calls What is Inspected Standard Reception desk Use customer’s name Doorman Greet guest in less than 30 seconds Room All lights working, spotless bathroom Minibar Restocked and charges accurately posted to bill
What our customer tell us? • Body language • Voice tone • Words
Challenge… We don’t see it as waste!
Relevant Lean Tools and Techniques. .
Value Stream Mapping
A Value Stream Mapping ? • We pursue a value stream perspective because it requires us to work on the big picture, not just individual processes, and improve the whole, not just optimize the parts vs.
What a Value Stream or Process Mapping Do? A process map answers questions, such as… • • What is the waste in the process? Where any blockages to flow? How long does each process step take? How many handovers are there?
VSM Activity
Example of VSM 3 month forecast Production control Daily orders MRP Rawmaterialsupplier Castings. RUs Enduser/customer Weekly schedule Tuesday and Thursday Once a day Daily shipment schedule Machine OP 1 C/T = 60 secs C/O = 100 mins 3400 Uptime = 90% Time avail = 435 mins I 2880 minutes I 140 Machine OP 2 C/T = 80 secs C/O = 10 mins Uptime = 95% Time avail = 435 mins 15 minutes 60 Seconds 80 Seconds I 90 60 minutes Assembly C/T = 40 secs C/O = 2 mins Uptime = 100% Time avail = 435 mins 40 Seconds I 220 4 minutes Test/dispatch C/T = 220 secs C/O = 2 mins Uptime = 80% Time avail = 435 mins 720 minutes 220 Seconds Total production lead-time = 3679 minutes Value added time = 7 minutes
119 Value Stream Map Orthopedic Patient Current State Value Stream Map Wait time = 200 minutes Value-added time = 104 minutes Total Lead time = 304 minutes (5. 06 hours) Shift = 12 hours Patient Registration Triage Emergency. Room 15 mins Radiology Emergency. Room 20 mins 35 mins 45 mins ERCasting Discharge 45 mins 40 mins Verify Ins 3 m i n Vitals 3 m i n Reche ckvital s 3 m i n Postps t 3 m i n Reasse ss 3 m i n Castpt 3 0 m i n Return Appt 2 m i n Updat e. Info 4 m i n Chiefc mpl 2 m i n Minias smt 3 m i n Obtain xray 5 m i n Obtain xray 3 m i n Pteduc 5 m i n Discha rge recpt 5 m i n 3 m i n 4 m i n 2 m i n 1 m i n Icthc 5 m i n 4 m i n 5 m i n Proces s 10 mins 15 mins Minie vl 13 Dispen se meds mins 35 mins Chiefc mpl 13 Assess mins 20 mins Proces s 23 5 mins 45 mins 16 mins Diagn osis 45 mins 40 mins 35 mins 7 mins PCE =34% Quantum Associates, Inc
88 2. Identify the value stream for each process
Identify The Value Stream “The Value Stream is those set of tasks and activities required to design and make a family of products or services that are undertaken with a group of linked functions or companies from the point of customer specification right back to the raw material source. ” (Hines et al, 2000)
90 Identify the Value Stream • The value stream includes all activities (value added and non-value added) from the creation of the raw materials to the final delivery of the output to the end consumer. • Activities within a value stream map are often broadly categorized as: – Value-added (e. g. , patient diagnosis) – Non-value-added but necessary (e. g. , requiring patients to sign a HIPAA form) – Non-value-added and not necessary (e. g. , waiting for the doctor)
92 Allow value to flow without interruptions
93 Make Value Flow • Having identified the value stream, the next step is to transform it from the traditional batch and wait approach to one where the flow is continuous. • Using one piece flow by linking of all the activities and processes into the most efficient combinations to maximize value-added content while minimizing waste. • The waiting time of work in progress between processes is eliminated, hence adding value
What is the purpose Mapping? Immediately make problems visible
What is Flow? • Parts “flow” through a Value Stream • Upstream is the beginning or “head” of the flow • Downstream is the “mouth” of the flow, where the part is pulled by the customer • Materials and parts are the “parts” in manufacturing • Customer’s needs are the “parts” in service industry – Same for administration
What is Flow? • Parts “flow” through a Value Stream • Upstream is the beginning or “head” of the flow • Downstream is the “mouth” of the flow, where the part is pulled by the customer • Materials and parts are the “parts” in manufacturing • Customer’s needs are the “parts” in service industry – Same for administration
97 Let the customer pull value from the process
Continuous Flow Production Traditional Flow Production Process (stream of water) Suppliers Flow with. Lean/JIT Customers Inventory (stagnant ponds) Material (water in stream) Suppliers Customers
The Importance of Value Stream? • The value stream includes all the activities of all the companies involved in the supply of a product or service to their ultimate customer • To map the value stream we need to map all the activities, both value adding and nonvalue adding processes If you do not understand the big picture, and all its inter-relationships, … How do you know what needs to be improved, much less, in what sequence to improve them?
GETTING TO WORK ON TIME 17 min 2 min Wake Up Shower & Shave Look for Toothbrush 4 min 11 min 18 min Clean up Dishes Breakfast Walk Dog Make Bed 2 min 16 min 9 min Look for Keys Travel to Work Read Newspaper 13 min 2 min 7 min Brush Teeth Dress 5 min Look for Shoes Stop and Buy Gas Arrive at Work PROCESS ANALYSIS 1). 2) Total process steps = Identify waste (Muda) in the steps above. Value added steps = Complete the process analysis Non-value added steps = Total time = minutes Value added time = Non-value added time = In Class Exercise: 15 Min minutes 3 min
Swim Lane Map (functional bands or process mapping) value stream mapping works only for highly linear material and information flows. Unfortunately, many industry processes, especially in administrative or indirect areas, are all but highly linear. To visualize these processes, a new diagram was developed – the swim lane diagram.
Swim Lane Map At their core, swim lane diagrams are flow charts. The feature that distinguishes a swim lane diagram from a normal flow chart is the lanes in the diagram that represent different departments / functions / offices, etc. Since these lanes make the flow chart look like the lanes of a swimming pool, this type of diagram is often called a swim lane diagram.
Swim Lane Map
FINANCE CONSULTANT 7 days MAILING CUSTOMER Receive Bill Instruction Form Preparation for the program Program Begin Check Billing Instruction Send Invoice for Mailing Complete? Document Filed Assistant Administrator (POS) Receive Mails for Processing Customer Receive Invoice Determine the Location of Intended Mail Customer Process Payment Weight the Letter at the Franking Machine to Determine Value for the Stem Customer Send Payment NO Program End YES Determine Debtor/income code Identify Customer Haven’t Yet Make Payment Key-in the Invoice into SAGA System Prepare Billing Instruction for Each Respective Customer Franking stem on the Mail Print Report Prepare Course Report and Costing Register the Mail inside Franking Record Book Send Report for Checking Add Course Report and Costing in Course File Hand Over the Billing Instruction and Course File to Course Clerk (PTO) Make Amendment Record on the Docket : How Many Mails That Have Been Frank in One Day NO Right? YES Print Report The PTO will Check the Course File and Billing Instruction No Course File and Billing Instruction Complete? Yes The Course File and Billing Instruction Submitted to Finance Mail Sent to the Pos Office by PAR Send Invoice for Signature Receive Invoice and Attach it Supporting Documents 2 days Finance Receive Payment 1 days 30 days
Where Are Swim Lane Diagrams Useful? • Swim lane diagrams are used for information flows (and to a lesser degree also material flows) that involve different separate entities that are not necessarily working in a linear sequence. It is often used for administrative processes as, for example, order processing, part development, marketing, etc.
What Flow Is Shown? • In swim lane diagrams, follow the processes of a certain job or document. For example, if the customer calls and places an order, how does this order flow through the different entities until the customer eventually gets its part? • This primarily includes information flows. Which group gives which information to what other group? If the customer representative forwards a request to Development, this would be an information flow. Swim lane diagrams can also include a material flow. While this is common, experience the material flow is usually only a minor part of the flows.
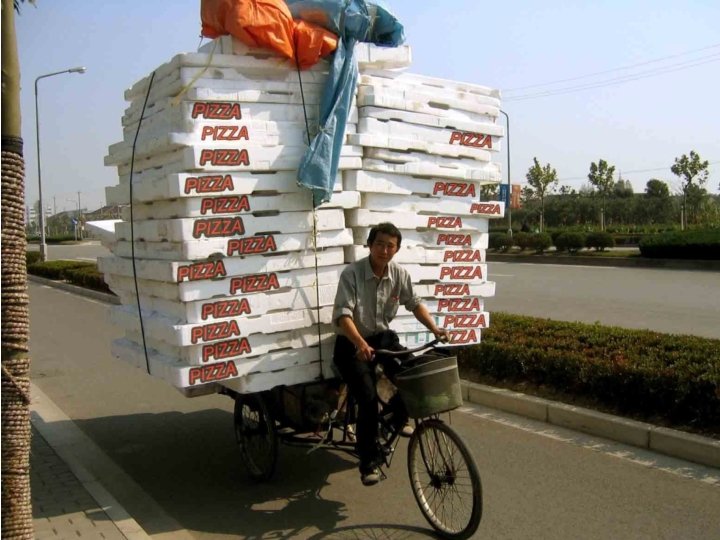
Group Mapping Exercise • What: Pizza order and delivery process • Who: – Customer – Order taker – Cook – Register attendant – Other? 64
Pizza Delivery Case- Details Flow Process Chart Pizza Express Order-to-Cash Process Flow Receptionist / Cashier Takes order, name & address Prepares Pizza Delivery Opportunity for Error: 1) Car Problem (Out of Gas, Flat Tire, Mechanical) 2) Driver unfamiliar with location Customer Calls in Order Pizza Chef Customer Opportunity for Error 1) Non-Payment 2) Incorrect change Opportunity for Error 1) Wrong Order 2) Wrong Address 3) Wrong Bill Delivers Pizza to customer Late or Incorrect Order No Collects Full Payment from customer Yes Credits customer and collects partial payment Opportunity for Error 1) Under / Over Cook Returns to Pizza Express to deposit cash to Receptionist / Cashier Opportunity for Error 1) Bad Ingredients Cooks Pizza Places Pizza in box and places on Delivery Shelf End Picks up batch of pizzas 68
Exercise
Fundamental Questions- for every process steps… Must Always Ask: Does this eliminate waste? Does this create value for our end-use customers? What’s the root cause of the problem? (5 Whys) Is this the least-waste way to do the work? Study the process and simplify.
Re-look at the Value Stream Why do we it this way…Use 5 Why’s. 1. 2. 3. Why do we it this way? . . Use 5 Why’s. Why do we it this way? Use 5 Why’s.
Description of the Loan Process : Exercise Customer calls into the Customer Service Department to enquire about a loan or lease. Customer Service gathers general information from the potential customer and
Loan Process : Exercise This department reviews application to make sure it is complete. If it is not complete, they call the customer to finish the application. Once complete, the application is forwarded to the credit department to perform a credit check. The results of the credit check are sent with application back to the Loan Department Customer Service.
Improvement Strategies Handoffs and batching are common barriers to process flow 71 Eliminate nonvalue added tasks Combine tasks or functions Concurrent processing Co-locate work Shift roles and responsibilities Eliminate or reduce batching Automate Solve Problems
Organisation Current Process Flow of Individual Vehicle AP – From Application Until Car Registration 1 Applicant Submit Application Start 2 Not Complete As Is Receive & Verify Complete 3 4 No Approval Appeal No No AP 30 minutes 5 11 Working Days Service Providers 1 Working Day No 6 7 Inspection Car Seized Revalidate Key in data at Dagang. net Yes Valuation rate 8 Yes No 30 minutes Appeal No Yes Payment 165. 5 working hours = 21 working days Clearance 9 Insurance Company 60 minutes Provide insurance coverage Car Scrap No Yes Reinspection 12 Physical flaw Document flaw 10 Issue trade plate 11 Key in data at E-Daftar 7 Working Days 10 Minutes Port Operator 14 Yes And 30 minutes 120 minutes Vehicle Inspection No 30 minutes 15 30 minutes Yes 15 Steps Registration 13 Approved Yes
Applicants 1 Submission of Document 1. 2. 3. 4. 5. 6. 7. Documents Required for Individual Vehicle AP Application Insurance Service Company Providers 2 3 Receive / Process Form / Appeal Borang JK 69 IC Passport Visa Driving licence Offering letter Termination of service 8. Unpaid leave 9. Study leave approval /sponsor letter 10. Report duty letter 11. Vehicles registration certificate 12. Car Insurance 13. Invoice 14. Boarding pass 15. Translation (if any) 16. Sijil Nikah • AP 4 Vehicles/Documents movement after AP approval 5 6 Key–in data in Dagang. net 1. IC 2. AP 3. IID form • K 1 form Providers Port Operator 7 Valuation / Inspection 1. AP 2. BL 3. Shipping Invoice 4. K 1 form 5. Vehicles registration certificate 6. Insurance • Duty assessment value 8 Payment 1. Duty assessment • Custom s receipt 9 10 Provide Insurance Temporary Pass 1. AP 2. Car Export Identificati on 1. Insurance 2. AP • Insurance • Temporar y plate No. 14 Vehicle Registration 1. 2. 3. 4. JPJK 1 IC AP B 2 report 5. K 1 form • Vehicle Grants 11 12 13 Vehicle Inspection / Approval Key–in data in E- Daftar 1. AP 2. K 1 form 3. Custom receipt 1. IC 2. AP 3. K 1 form • B 2 report 15 Clearance 1. K 1 2. IID Form • Gate Pass 4. B 2 report • JPJK 1 A total 16 types of documents require at the submission print
Simplification of Current Application Process Flow of Individual Vehicle AP to Further Address Issues 4 & 5 1 Applicant Submit Application Start 2 Not Complete As Is Receive & Verify Complete 5 Service Providers No 6 Key in data at Dagang. net Yes Revalidate Yes Valuation rate 8 Yes No Appeal Yes No No AP 14 Key in data at E-Daftar Appeal No Yes Payment Port Operator 4 No Approval 7 Inspection Car Seized 3 15 Steps Clearance 9 Insurance Company Provide insurance coverage Car Scrap No 12 Yes Reinspection Physical flaw Document flaw 10 15 Issue trade plate 11 Vehicle Inspection No Yes Registration 13 Approved Yes
Estimated Time Saving Impact of New or Proposed Application Process Flow for Individual Vehicle AP 1 Applicant Start 2 Not Complete Online Application Processing No AP 3 Complete Verify / Interview Interim AP Return to Malaysia Working hours 30 minutes 7 = working days 8 10 minutes 7 Duties Payment 9 Registration in My. Sikap* AP Revoke AP Issued 5 Customs Declaration by applicant / service provider PUSPAKOM Inspection success Fail Car Seized Valuation / Assessment 30 minutes Yes 120 minutes Customs Docket Processing 60 minutes 10 Minutes Port Operator 4 6 1 Working Day To Be Approve 30 minutes 5 Working Days 53 Service Providers No 10 Port Clearance End
Steps Elimination Impact of New or Proposed Application Process Flow for Individual Vehicle AP Step eliminated – 5 steps MITI RMCD Insurance Company JPJ Service Provider Appeal Inspection Provide Insurance working hours 21 = working days 10 Steps 15 Steps Issues Trade Plate Key in at E-Daftar To Be As Is 165. 5 To Be As Is 53 working hours = 7 working days 112. 5 Save working hours = 14 working days “Transformation, Innovation and Partnership”
Counter-measure for Issue 1: Reducing the Number of Document Required MITI List of Documents Required 1. 2. 3. 4. IC Passport Visa Local / International Driving Licence 5. Offering letter 6. End of service letter 7. Unpaid leave 8. Study leave approval / sponsor letter 9. Report duty letter 10. Vehicles/ Certificate Registration/ Export Certificate 11. Vehicles Insurance 12. Invoice 13. Boarding pass 14. Translation (if any) 15. Sijil Nikah 16. Borang JK 69 Document for Interim AP 1. Passport / Visa 2. Local / International Driving Licence 3. Offering Letter 4. Vehicles/ Certificate Registration 5. Vehicles Insurance 6. Translation (if any) 7. Sijil Nikah By reducing the number of documents required, it will be less burdensome for applicants. Moreover certain documents such as boarding pass and invoice may not be relevant documents to show ownership 16 Documents 6 Document at MITI 1. Original of Documents submitted for Interim AP application 2. Interim AP 3. End of services letter 4. JK 69 5. Export Certificate (if any) Documents eliminated 9 Documents
Which Technique to Begin With? It is often advantageous to begin with Lean projects. – These are easier to understand implement. Begin with streamlining processes and Rapid Improvement Events. – This gets the operation/process in good order. – Chronic problems are now easier to deal with. –“Low Hanging Fruit” is eaten.
Fixing a Flat Tire You know what you need to do just go DO IT
Why won’t my car start Data and Analysis needed to Fix the Problem
WHY KAIZEN EVENT? Kaizen drives the improvements which lead to a leaner business operating system Current State (As – Is) KAIZEN Future State (Lean) (To – Be)
KAIZEN EVENT - ROADMAP DAY 1 DAY 2 Conceptual Training Kaizen on factory floor area • • • Business Process Standard Operations 5 S Kaizen Methodology Tools & Techniques • • Dicover Problem Measure & Analyse Current work Process Brainstorm solutions & formulate Process Improvements DAY 3 DAY 4 Evaluate Improvements Measure Improvement • • • Create & map new process Apply rapid implementation • • • Establish New Standard Process Operate Using New Standard Process Finalise New Standard Process Monitor & Control DAY 5 Present Result & Celebrate
KAIZEN BLITZ A Kaizen Blits is an intense and rapid improvement process in which a team or a department throws all its resources into an improvement project over a short time period, as opposed to traditional Kaizen applications, which are performed on a part-time basis
KAIZEN – BLITZ & PROJECTS Visual factory Establish new metrics Reduce setup times- SMED Reduce WIP Eliminates long conveyor lines with cells KAIZEN PROJECTS New product development Determine proper tooling needed and organise Combine operations Change process 5 S Reduce lot sizes Load level schedule
KAIZEN – DO & DO NOT Do • Open minded to all approaches • Try as many ideas as possible. Minimum of three (3) Do Not • Assume everything is good on what you hear (see it with your eyes) • Do as many observations of reality as possible (10) • Just sit around but brainstorm (justify the current way things are done) • Do include one person who is convinced it can’t be done • Assume you know the problem • Do make sure management is committed to resolving the issue and supporting the team • Hold a Kaizen to resolve an issue that is not driving a business goal
TOOLS FOR PROCESS ANALYSIS Check sheets Control charts Flowcharts PROCESS ANALYSIS TOOLS Histograms Cause & effect diagrams Pareto diagrams Scatter diagrams
What is Pull? • Pull = response to the customer’s rate of demand i. e. the actual customer demand that drives the supply chain. • Based on a supply chain view from downstream to upstream activities where nothing is produced by the upstream supplier until the downstream customer signals a need.
What is Pull? • “It has become a matter of course for customers, or users, each with a different value system, to stand in the frontline of the marketplace and, so to speak, pull the goods they need, in the amount and at the time they need them. ” – Taiichi Ohno, “Toyota Production System” • “…Nothing is produced by the upstream provider until the downstream customer signals a need” – Womack and Jones, “Lean Thinking”
100 Continuously pursue perfection
Perfection • The journey of continuous improvement. • Producing exactly what the customer wants, exactly when, economically. . • Perfection is an aspiration, anything and everything is able to be improved • The complete elimination of all waste, so that all activities along a value stream add value to the product.
ENEMIES OF PERFECTION
Using the Wormack’ 5 Step Process The Clinic Visit • Specify value from customer’s perspective – A quick, effective clinic visit • Identify the value stream for this service – Request > appointment > arrival > seeing doctor > check-out …and remove the waste – Time on hold, callbacks, walking, wrong drug, unneeded test • Make value flow without interruptions from beginning to end – Staff and patient move continuously from check-in to exit – Less waiting for patient and staff – Errors surface immediately • Let the customer/worker pull value from the process – Physician pulls next patient to exam room; patient pulls med refill when needed • Pursue perfection – continuous improvement – Every day, every clerk, doctor, nurse thinks about how to redesign work to improve value to the customer, and ease for us
Using the 5 Lean Principles on Hospital A Appointments 1. Specify value from customer’s perspective Patients, physicians and staff: Quickly scheduled appointments 2. Identify thevalue stream for the service Request > review> schedule appointment …and remove the waste Errors, time on hold, callbacks, physician reviews
Making Appointments Current State Map DRAFT OP Notes Physician Notes Orthopaedic Surgery Med. Sport - Current State Map Imaging Requests 30/Day Mail Patient Ref. Phys. Pt / ATC Appeals Lost Req 1 Req Phone 2 Rqsts Fax ~~ ~ In Receipt & Inspect Request Email Re-work Request 28 Requests ~~ ~ In Business/ Clinical Review ~~ ~ In 6 Requests Transport Appointment Request ~~ ~ In 6 Requests Clinical Review ~~ ~ In 6 Requests Transport Appointment Request ~~ ~ In 28 Requests Denial/Prior Setting ~~ ~ In 30 Requests Schedule and/or Notify 29 Requests ~~ ~ In Mail Itinary P/T: 5 min P/T: 10 min P/T: 2 min P/T: 3 min P/T: 1 min P/T: 5 min P/T: 1 min W/T: 0 -3 days W/T: 0 -14 days W/T: 0 -3 days W/T: 0 -1 days W/T: 0 -1 days C&A: 100% C&A: 5% C&A: 95% C&A: 100% C&A: 98% C&A: 100% Call Ctr. Ref. Coord. Call Ctr. Sctry. Physician Sctry. Ref. Coord. Call Ctr. Front Desk Wait time (day) Process Time (sec) 0 -3 d 0 -1 d 5 min 1 - 14 d 0 -1 d 10 min 0 -1 d 0 -3 d 2 min Wait Time ~~ ~ In In Box (Queue) Outside Source 1 -7 d 0 -1 d 3 min Mapping Icons Process Step 0 -1 d 1 min Metrics Information Data Box Service 0 -1 d 3 min 0 -1 d 1 min 5 min 0 -1 d 1 min Summary P/T: Processing Time Total Processing Time : 11 31 minutes W/T: Wait Time Total Waiting Time: % C & A: % Complete and Accurate: % 1 - 36 days Wednesday March 16, 2005 - Page 1
Using the 5 Lean Principles on Hospital A Appointments 3. Make value flow without interruptions from beginning to end Staff scheduling appointments on first phone call Uniform intake process No waiting for appointments Errors surface immediately
Using the 5 Lean Principles on Hospital A Appointments 3. Make value flow without interruptions from beginning to end Staff scheduling appointments on first phone call Uniform intake process No waiting for appointments Errors surface immediately
Making Appointments Future State Map DRAFT - Orthopaedic Surgery - Future State Map | | | Ref. Phys. Entry Criteria Outside Ortho Consult Request Guidelines on the Web OP ED Notes Patient Ref. Phys. Pt / ATC | | | Input by phone only. Faxes and emails will be funneled to phone process Phone | | | Standard Work LL Business Review Appointment Requirements Schedule Appointment Clinic Review Itinerary Printed & Mailed 3 -5 Days Pre. Arrival Call Fast Track Call Center Staff Failed Requests are | | | 10% 2 nd Review | Patient Appointment: Slow Track - Exception Process Rotating Designee Redirected | | Scheduling Standard Work 90% Schedule Contact Reminder P/T: 6 - 11 min P/T: 8 - 13 min W/T: 0 -1 min W/T: 1 - 7 days C&A: 95% C&A: 85% Fast Track Summary Mapping Icons Process Step Wait Time ~~ ~ In Metrics In Box (Queue) Outside Source Slow Track Information Data Box Service LL Learning Loop Fast Track Slow Track P/T: Processing Time Total Processing Time : 6 - 11 min 8 - 13 min W/T: Wait Time Total Waiting Time: 0 - 1 min 1 - 7 days % C & A: % Complete and Accurate Lead Time: 6 - 12 min 1 - 7 days % Complete and Accurate: 95% 85% Thursday March 17, 2005 - Page 1
Using the 5 Lean Principles on Hospital A Appointments 4. Let the customer pull value from the process Same day appointments Open till 7 PM 5. Pursue perfection – continuous improvement Every day, every clerk, doctor, and nurse thinks about how to redesign work to improve value to the customer
Your Clinic Appointment Scenario. Any Problem? • • • Call the clinic, voice prompts, on hold, leave message. Clerk calls back and sets a date next week. Arrive for the visit, check in, sit in waiting room. Called into the exam room, wait for doctor. Doctor sees you, saying she’s been waiting for you. Diagnoses a URI, and BP is worse. Doctor prints antibiotic prescription, walks to the staffroom to get it. You are allergic to that drug. Doctor says to return in a week for the BP. At check out you ask the cost – clerk says they’ll bill you, No appointment is available next week. Pharmacist says your insurance prefers a different drug.
The Cornerstone of Lean – The Toyota Production System Based on two philosophies: 1. Elimination of waste 2. Respect for people According to Dr. Jones, Lean guru and co-author of The Machine that Changed the World, lean production is based on four principles: 1. minimize waste 2. perfect first-time quality 3. flexible production lines 4. continuous improvement
Lean Building Blocks House of Lean KAIZEN Pull/Kanban Quality at Source Standardized Work 5 S System Principles for Implementing Lean Manufacturing Cellular/Flow POUS Quick Changeover Batch Reduction Visual TPM Teams Plant Layout Value Stream Mapping
Pull
Push vs Pull • How would you want the service delivered to customers? PUSH Discuss the Pros & Cons PULL
Push versus Pull System Raw Material Supplier Final Assembly Customer FGI PUSH Raw Material Supplier Final Assembly Customer FGI PULL Information Flow Material Flow
Push versus Pull • Push system: material is pushed into downstream workstations regardless of whether resources are available • Pull system: material is pulled to a workstation just as it is needed
Traditional U. S. Manufacturing Firm: Push (“old style” MRP / Material Requirements Planning System) • The production of items at times required by a given schedule planned in advance Work Station 1 WS 2 WS 3 Material Information (Production Schedule)
Pull (JIT) System The production of items only as demanded for use or to replace those taken for use. Work Station 1 WS 2 WS 3 Material Information (via Kanban/Card)
Takt Time/Line Balancing
TAKT TIME Takt Time = Demand Rate Takt Time = Work Time Available Customer Requirement-Demand Synchronizes pace, evenly applying customer demand across the work day. Takt Time is "Beat Time"? "Rate Time" or “Heart Beat" Lean Production uses Takt Time as the rate or time that a completed product is finished. If you have a Takt Time of two minutes that means every two minutes a complete product, assembly or machine is produced off the line. The idea is to synchronize the pace of production with the customer by balancing man, machine, and material.
Takt Time Example TAKT Time = Total Daily Operating Time Total Daily Customer Requirements Total Daily Operating Time: • Day is 8 hours long • Convert to minutes: 8 x 60 = 480 • Subtract two 15 minute breaks: 480 - 30 = 450 • Subtract 30 minute lunch break: 450 - 30 = 420 • Total Daily Operating Time = 420 minutes
Takt Time Example TAKT Time = Total Daily Operating Time Total Daily Customer Requirements: • The average daily customer demand by item • E. g. 7 credit card applications are received per day • I. e. the Total Daily Customer Requirements are 7 applications per day Takt Time = 420 minutes operating time = 60 minutes 7 items required per day
Heijunka/Line Balancing TAKT TIME (seconds) 100 % Op 1 Op 2 Op 3 Op 4 Op 5 Op 6 Op 7 Op 8 Op 9 Op 10
Heijunka/Line Balancing TAKT TIME (seconds) 100 % NUMBER OF OPERATIONS NOW DOWN TO 5 EACH OPERATOR HAS APPROX ONE TAKT TIMES WORTH OF WORK. Op 1 Op 2 Op 3 Op 4 Op 5 Op 6 Op 7 Op 8 Op 9 Op 10
Flow
Flow Layout - Unbalanced line Successive operations next to each other but unbalanced and unsynchronised…leading to: • Improvements to many aspects of the traditional layout but… • In process W. I. P. Some operations overloaded, others under-utilised • Resulting in: • Still significant room for improvement MATERIALS • • A B C 60 secs 40 20 0 cycle times FINISHED PRODUCTS
Flow layout - Balanced / One Piece Flow • But whole line is not synchronised to (end) customer requirements MATERIALS A B C 30 secs • Successive operations next to each other and balanced…leading to: • no in process W. I. P. • Fully utilised operators 20 10 0 cycle times C FIN PRO FINISHED PRODUCTS
Continuous Flow • Producing and moving one item at a time (or a small and consistent batch of items) through a series of processing steps as continuously as possible, with each step making just what is requested by the next step. It is also called the one-piece flow, singlepiece flow, and make one, move one.
Small versus Large Lots JIT produces same amount in same time if setup times are lowered JIT Small Lots A A B B B C Time Small lots also increase flexibility to meet customer demands Large-Lot Approach A A B B B Time B B B C C
SMED Single-Minute Exchange of Dies
SMED (Single-Minute Exchange of Dies) system for dramatically reducing the time it takes to complete equipment changeovers. The essence of the SMED system is to convert as many changeover steps as possible to “external” (performed while the equipment is running), and to simplify and streamline the remaining steps.
We must work effectively together like a Formula 1 Team
The 2 Key Factors Toward SMED Internal Operations : Operations that can only be performed with the machine at a standstill External Operations : Operations that can only be performed with the machine running
SMED Principles 1. Separate internal setup from external setup 2. Convert internal setup to external setup 3. Streamline all aspects of setup 4. Perform setup activities in parallel or eliminate them entirely
Reducing Setup Time • • • Preset desired settings Use quick fasteners Use locator pins Prevent misalignments Eliminate tools Make movements easier
Kanban
Kanban • Japanese word for card – Pronounced ‘kahn-bahn’ (not ‘can-ban’) • Authorizes production from downstream operations – ‘Pulls’ material through plant • May be a card, flag, verbal signal etc. • Used often with fixed-size containers – Add or remove containers to change production rate
Once the Production kanban is received, the Machine Center produces a unit to replace the one taken by the Assembly Line people in the first place Machine Center Withdrawal kanban Storage Part A Production kanban The process begins by the Assembly Line people pulling Part A from Storage Part A This puts the system back were it was before the item was pulled Assembly Line Material Flow Card (signal) Flow
Different Kanban triggers Colored Lights Standard Container Replenishment Cards(s) Fax Bin Shelf Broken Bag Square on the Floor Kanban Part 123 Kanban Part 456
Kanban
The Six Big Losses/ Waste DOWNTIME 1 Breakdowns due to equipment failure 2 Set-ups, teardowns & adjustments 100% SPEED LOSSES 3 Idling & minor losses 4 Reduced running speed DEFECTIVE PRODUCTION 5 Start-up losses until stable production achieved 6 Process losses (scrap, rework & non-conformance) Uptime
Layout
Work Sequence refers to the series of steps in a single process that is fastest, most efficient, of acceptable quality, and safe. When the work sequence is carefully followed, the cycle time will be constant, no steps will be forgotten, and the chance of equipment damage or other major problems will be minimized. Poor Good 8 9 4 5 10 9 10 8 7 3 4 1 7 Bill Costantino, Lean Mfg 616 -891 -7578 EBCostantino@earthlink. net 6 3 1 2 152 2 6 5 SW 2 -Day Training
Spaghetti Diagram Start Desk Table 4 a 4 c Table 3 4 b Table Desk Table 1 2 Bill Costantino, Lean Mfg 616 -891 -7578 EBCostantino@earthlink. net 11 10 6, 7, 8, 9 Table 6, 7, 8, 9 Desk cart Desk Table Desk 153 Staging Area 12 SW 2 -Day Training
TPM
Getting the Most out of Equipment Daily Prevention Prediction Planning Teamwork Measurement Routine Servicing Timely Preventative Maintenance A comprehensive system for reducing breakdowns and improving quality by involving all employees in the elimination of waste of time and resources caused by production equipment Problem Solving Monitoring
5 S
GILL
Aplacefor & everything Demand Maintenance and everything inits Organize of Tools place, clean and ready for use
Motor Pool Before Lean
Motor Pool After 5 S
Visual Management
Visual Management • Ability to understand the status of a production area in 5 minutes or less by simple observation without use of computers or speaking to anyone. • Provides the ability for workers to make decisions / take actions based solely on the status of visual indicators.
Visual Controls • "Basically, the intent is to make the status of the operation clearly visible to anyone observing that operation" (Wayne Smith, 1998). • Visual controls are like a nervous system (Suzaki, 1987) • "Visual controls identify waste, abnormalities, or departures from standards" (Caravaggio, in Levinson, 1998) © 2009, Levinson Productivity Systems, P. C. www. ct-yankee. com 139
Visual Management Alert Problem! Data Display Q C 10" Digital Caliper (Herman Mill 1/31/01 John Chapdelaine Tolerance: Misc: . 001 Components of Variation 0. 9 250 By Part number 50 40 30 20 10 0 Index 0. 8 0. 7 %Contribution %Study Var %Tolerance 0. 6 % Big Grit Percent 0. 5 50 0. 4 0. 3 120. 05 200 Amount Small Grit 100 150 120. 00 100 50 0. 2 119. 95 0. 1 0 0 2 4 6 8 Repeat Reprod Part-to-Part % Big Jenny 2 nd Shift Sample Range UCL=0. 01480 R=0. 00575 0. 000 LCL=0 1 2 3 Order Entry UCL=120. 0 Mean=120. 0 LCL=120. 0 119. 95 Order Picking 7 8 9 10 Jenny 2 nd Shift Shoes Available? Send shoes to packing Alert stock & sales Order more Shoes from factory Stock Packing Pack & send to shipping Ship shoes 0. 3 50 0. 1 0 0 Papo operator Papo 119. 95 Part number 2 3 4 5 6 7 8 5 7 9 11 13 21 23 39 45 % good grit bad grit Time Betty Jenny 2 nd Shift 120. 00 1 Inform customer of delay Slips wait for pick-up Getslips from order entry 6 119. 90 Deliver order slip to order entry Log, sort & prioritize orders 5 operator*Part number Interaction 120. 05 Papo Average Sample Mean Action Steps Obtain & write up order from customer 4 Prevent 119. 95 120. 00 0 Sales 10 2030 40506070 80 90 120. 05 operator Betty Jenny 2 nd Shift 100 0. 4 0. 2 120. 005 Betty 150 0. 5 Papo Xbar Chart by operator Function 0. 6 0. 010 0 React 200 0. 7 By operator 0. 015 120. 05 250 0. 8 3 Part number Small R Chart by operator Betty 0. 9 10 12 14 16 18 20 22 24 26 28 30 32 34 36 38 40 42 44 46 48 50 52 54 56 58 60 62 64 Time Gage R&R D MN Shot Saw Timeline Shrink Lines CA Shot Saw Record Amount Small Grit in Grams Gage name: Date of study: Reported by: % Good Grit S Gage R&R, Length, 1/31/01 9 10 47 49 69 71 73
Andon • A signal, light, bell or music alarm triggered by an operator when confronted by a non standard condition • A non standard condition includes, tool failure, machine failure, bad part, lack of parts, can not keep up or an error needs correcting • An Andon is a signal for IMMEDIATE help to ensure the line doesn’t stop
Visual Workplace Andon lights
Replacement Part Kanban Maintenance Addresses
Visual Control of Seasonal Inventory
Standardised Work
Three Components of Standardized Work Takt Time Standardized Work Sequence Standard In-Process Stock
Standardization “To standardize a method is to choose out of many methods the best one, and use it. Standardization means nothing unless it means standardizing upward. What is the best way to do a thing? It is the sum of all the good ways we have discovered up to the present. …Today's best, which superseded yesterday's, will be superseded by tomorrow's best. …If you think of "standardization" as the best that you know today, but which is to be improved tomorrow, you get somewhere. But if you think of standards as confining, then progress stops. ” Henry Ford, Today and Tomorrow (1926)
KAIZEN
Kaizen A Kaizen Event is a facilitated, small-scope improvement activity that engages the creativity of employees to reduce waste in a work process. A Kaizen Event typically lasts 3 -5 days. 173
Kaizen Focus Waste elimination
Kaizen Event Kaizen events use a swim lane map to document the current and future process. 175
Every Business Process is Concerned “ 85% of the reasons or failure to meet customer expectations are related to efficiencies in systems and process… rather than the employee. ” The role of management is to change the process rather than badgering individuals to do better. ”. . Deming.
Poka Yoke
Definition Yokeru (avoid) Poka (mistake) Applying mistake proofing concepts to process or product improvements allows you to take a proactive approach to eliminating errors at their source before they become defects. POKA YOKE POKA-YOKE MISTAKE PROOFING “ANTI-ERROR” SYSTEMS FOOL PROOFING OH MY!
Error-Proofing (Poka-Yoke) • Error-proofing makes it difficult or impossible to do the job the wrong way. • Slots and keys, for example, prevent parts from being assembled the wrong way. • Process recipes and data entry also can be error-proofed. © 2009, Levinson Productivity Systems, P. C. www. ct-yankee. com 181
Poka-Yoke Automobile controls have a mistakeproofing device to insure that the key is in the on position before allowing the driver to shift out of park. The keys cannot be removed until the car is in park. Filling pipe insert keeps larger, leaded-fuel nozzle from being inserted gas cap tether does not allow the motorist to drive off without the cap gas cap is fitted with ratchet to signal proper tightness and prevent over-tightening.
Poka-Yoke Electronic door locks can have three mistake-proofing devices: insures that no door is left unlocked. doors automatically lock when the car exceeds 18 miles an hour. lock won't operate when door is open and the engine is running. Even bathroom sinks have a mistakeproofing device. It is the little hole near the top of the sink that helps prevent overflows.
Poka-Yoke This iron turns off automatically when it is left unattended or when it is returned to its holder The dryer stops operating when the door is opened, which prevents injuries.
Poka-Yoke This wall mounted hair dryer has two slots on either side of the switch. (One slot is partially covered by my thumb. ) The bracket on the wall has two pointed prongs that go through the two slots and turn the dryer off if the user neglected to do so. The sink is fitted with light sensors. These sensors insure that the water is turned off in the sink (a urinal is flushed).
Poka-Yoke File cabinets can fall over if too many drawers are pulled out For some file cabinets, opening one drawer locks all the rest, reducing the chance of the file cabinet tipping.
POUS
Point of Use Storage Storing your office supplies, files, and forms at the workstation or location where your employees use the items. • Create environment where suppliers provide smaller more frequent deliveries • Use Kan. Bans to regulate replenishment • Simplifies P. O. s, transfer & requisition forms
POUS
Standardized Work The safest, highest quality, and most efficient way to perform a task or process. • Focuses on helping the employee be successful • Reduces variation and increases consistency • Improvements cannot be sustained without it “Where there is no standard, there can be no Kaizen. ” Taiichi Ohno, Vice-President Toyota Motor Company 190
191
192 Thank You