Unit 5 Total Quality Management Tools and Techniques

 • A management approach to long–term success through customer satisfaction.")


 is selected")


 • • Key objective is to determine those variables in")
")
 (Source: http: //en. wikipedia. org/wiki/Failure_mode_and_effects_analysis) FMEA helps a")
 • • • Helps transform customer needs into engineering characteristics")
")


")


 Utilizing the entire workforce to obtain the optimum use of")


 A useful way of planning is to break down")


 • Continuous improvement • Kaizen is a Japanese word for continuous improvement")


")
 Reason For")


: Gas")
: Sticky Gas Pedals • • • 2007 -2008 Tundra")


- Slides: 71
Unit 5 Total Quality Management: Tools and Techniques
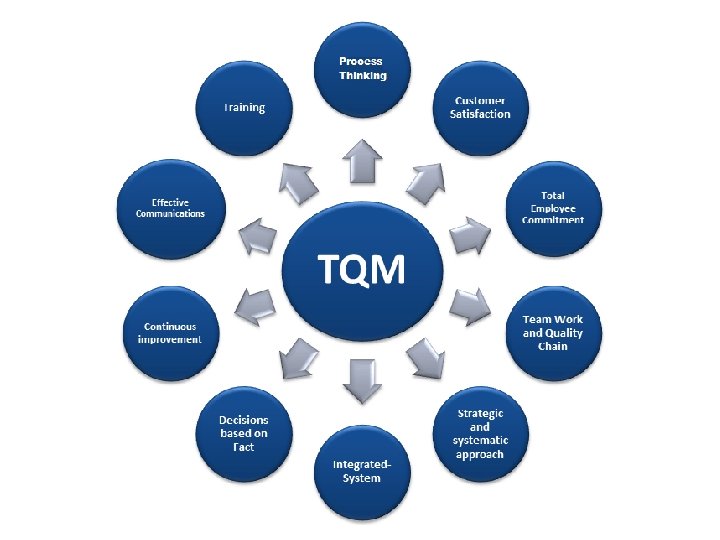
Total Quality Management (TQM) • A management approach to long–term success through customer satisfaction. • Based on the principle that every staff member must be committed to maintaining high standards of work in every aspect of a company's operations. • In a TQM effort, all members of an organization participate in improving processes, products, services, and the culture in which they work. • They achieve this using various quality tools.
Tools for TQM Pareto Diagram Fishbone/Ishikawa Diagram Check Sheet Process Flow Diagram Scatter Diagram Histogram Control Chart Acceptance Sampling Random Sampling Reliability Design of Experiments (DOE) Process Analysis Tools Quality Function Deployment ISO Series Benchmarking Total Productive Maintenance Management and Planning Tools Lean/Kaizen Quality Issues Six Sigma
Pareto Diagram • • • Named after Vilfredo Pareto For vital few, useful many In descending order, left to right
Pareto Diagram
Fishbone Or Cause-and-Effect Diagram Facility Material Personnel Processes Goal = Green Product Energy Tooling Product Customer
Cause-and-Effect Diagram • • Also called fishbone or Ishikawa diagram Helps in tracing cause and effect relationships The effect or problem must first be defined or identified The effect can be positive or negative
Ishikawa/Fishbone Diagram
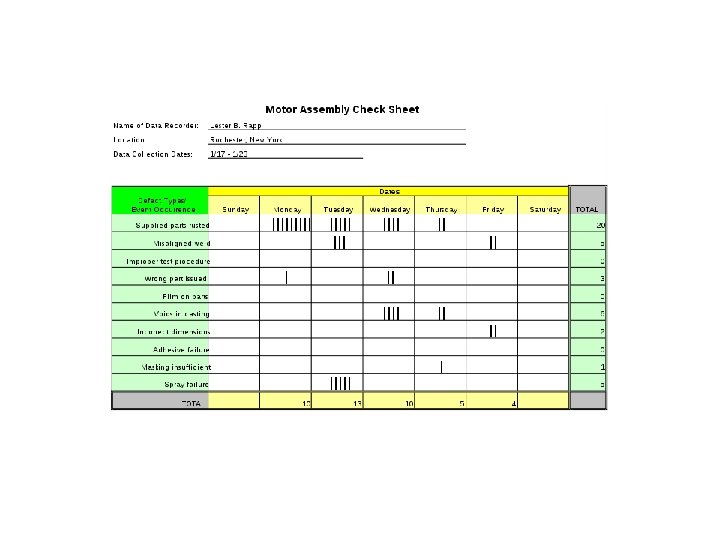
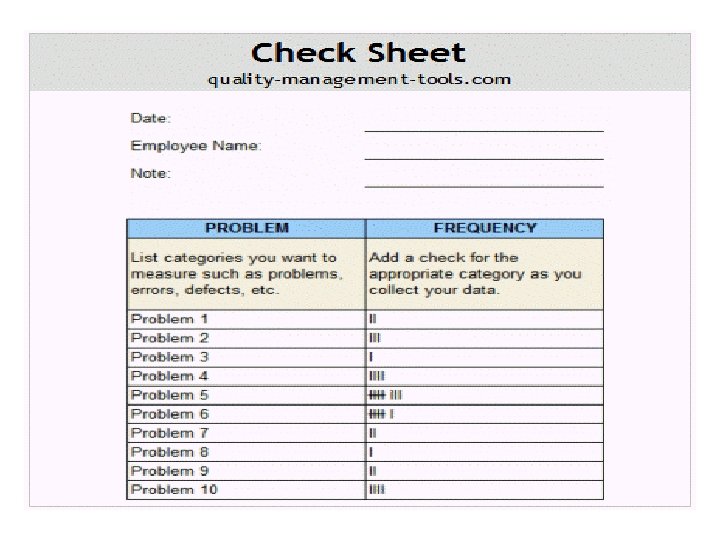
Check Sheet
Process Flow Diagram
Process Flow Diagram
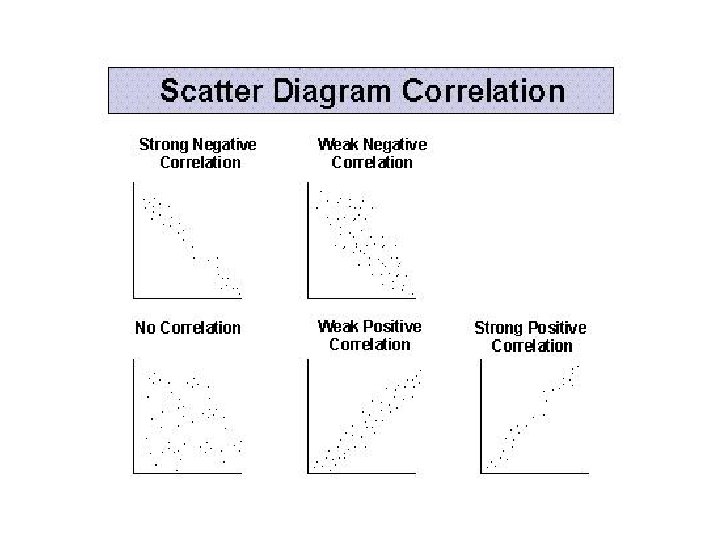
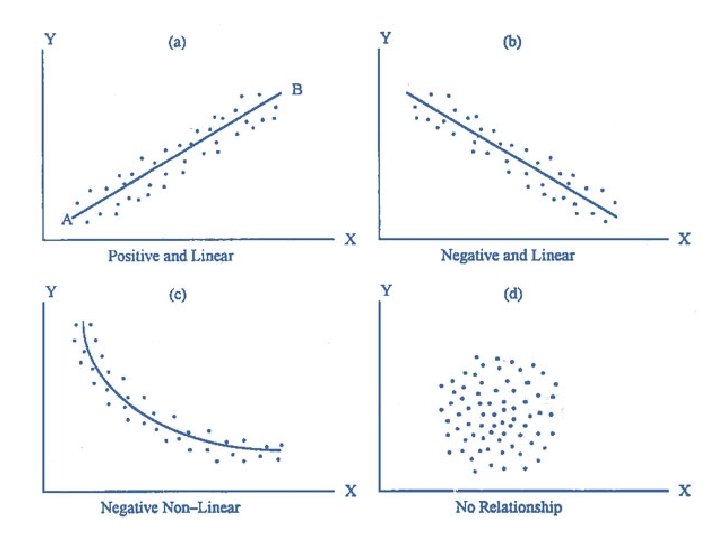
Scatter Diagram
Histogram
Control Chart
Acceptance Sampling • A sampling procedure in which a predetermined number (n) is selected from a lot (N) and inspected • If the number of non-conforming units exceed a certain number, the lot is rejected
Acceptance Sampling Expressed as: N = 1000; n = 300; c = 3 – – – N = Lot size n = Sample inspected c = acceptable defective units
Random Sampling Applied Here • In random sampling, each item or element of the population has an equal chance of being chosen at each draw
Reliability • Ability of a product to perform its intended function over a period of time
Design of experiments (DOE) • • Key objective is to determine those variables in a process or product that are critical parameters Experiments help to study the effects of those variables
Process Analysis Tool (Process Chart)
Failure Mode and Effects Analysis (FMEA) (Source: http: //en. wikipedia. org/wiki/Failure_mode_and_effects_analysis) FMEA helps a team to identify potential failure modes based on past experience with similar products or processes, enabling the team to design those failures out of the system with minimum effort and resource expenditure
Quality Function Deployment (QFD) • • • Helps transform customer needs into engineering characteristics A system that identifies and sets priorities for product, service and process improvement opportunities Leads to customer satisfaction
Quality Function Deployment (QFD)
ISO 9000 Series: • • ISO = International Organization for Standards ISO 9000 series has three standards: 1. ISO 9000 covers fundamentals and vocabularies 2. ISO 9001 is the general requirements 3. ISO 9004 provides guidance for performance improvement in: i. Quality management system (QMS) ii. Management responsibility iii. Resource management iv. Product/service realization v. Measurement, analysis, and improvement
ISO 9001: 2008 • Is part of the ISO 9000 family of standards, and is the document that lists the requirements an organization must meet to become ISO 9001 Registered. • Is an internationally recognized Quality Management System. • ISO 9001 does NOT define the actual quality of your product or service. • The standard helps you achieve consistent results and continually improve the process. • Thus, if you can make a good product most of the time, this helps you make it all of the time.
What is a Quality Management System? • A set of policies, processes and procedures required for planning and execution (production/development/service) in the core business area of an organization. (i. e. areas that can impact the organization's ability to meet customer requirements. ) • ISO 9001: 2008 is an example of a Quality Management System.
ISO 14000 • ISO 14000 is the international standard for environmental management system (EMS)
Top 10 Countries for ISO 9001 Certificates - 2009 Rank 1 2 3 Country China Italy Japan No. of certificates 257076 130066 68484 4 5 6 7 8 9 10 Spain Russian Federation Germany United Kingdom India USA Korea, Republic of 59576 53152 47156 41193 37493 28935 23400
Benchmarking The process of measuring products, services, and processes against those of organizations known to be leaders in one or more aspects of their operations
Total Productive Maintenance (TPM) Utilizing the entire workforce to obtain the optimum use of equipment through continuous search to improve maintenance
Management and Planning Tools • • Affinity Diagram Interrelationship Diagraph Tree Diagram Prioritization Matrix Diagram Process Decision Program Chart (PDPC) Activity Network Diagram
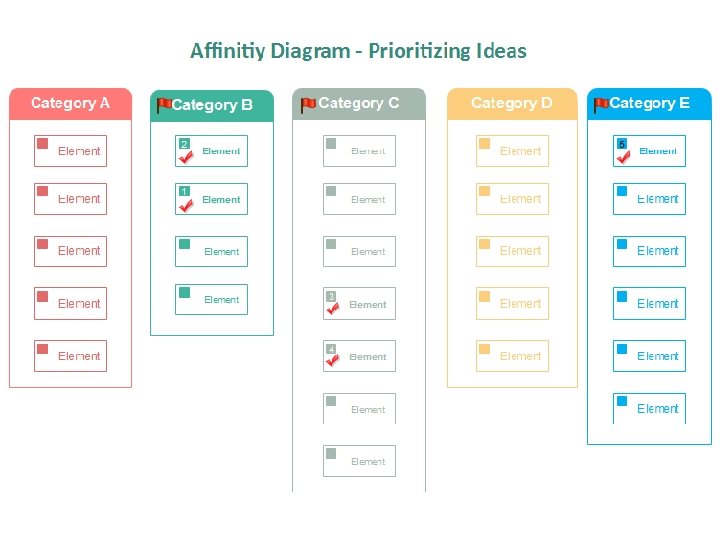
Affinity Diagram This tool takes large amounts of disorganized data and information and enables one to organize it into groupings based on natural relationships.
Interrelationship Digraph This tool displays all the interrelated causeand-effect relationships and factors involved in a complex problem and describes desired outcomes.
Interrelationship Digraph
Tree Diagram This tool is used to break down broad categories into finer and finer levels of detail. It can map levels of details of tasks that are required to accomplish a goal or task.
Tree Diagram
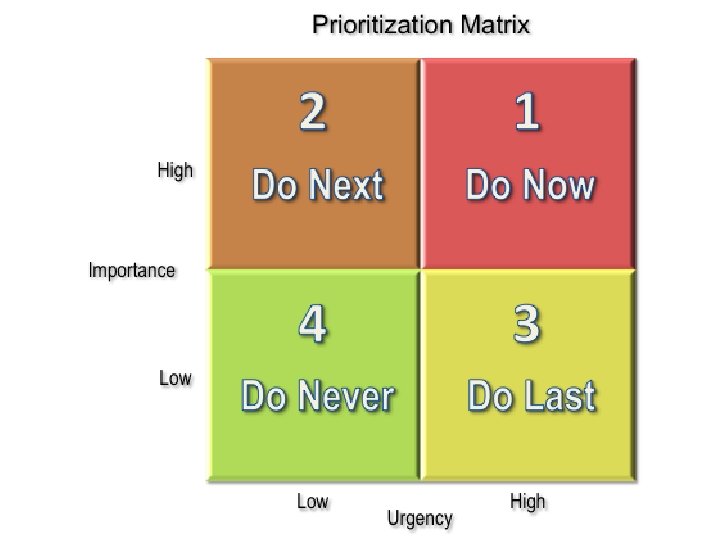
Prioritization Matrix This tool is used to prioritize items and describe them in terms of weighted criteria. It uses a combination of tree and matrix diagramming techniques to do a pair-wise evaluation of items and to narrow down options to the most desired or most effective.
Matrix Diagram This tool shows the relationship between items. At each intersection a relationship is either absent or present.
Process Decision Program Chart (PDPC) A useful way of planning is to break down tasks into a hierarchy, using a Tree Diagram. The PDPC extends the tree diagram a couple of levels to identify risks and countermeasures for the bottom level tasks.
Activity Network Diagram This tool is used to plan the appropriate sequence or schedule for a set of tasks and related subtasks. It is used when subtasks must occur in parallel. The diagram enables one to determine the critical path (longest sequence of tasks).
Activity Network Diagram
Lean (Kaizen) • Continuous improvement • Kaizen is a Japanese word for continuous improvement
Quality Issues • Identifying quality problems • Solving quality problems • Improving quality
To Boost Performance, Quality is Designed into Products as: § § § § Material Function Quality characteristics Performance Reliability Features Conformance § § Reliability Durability Service Aesthetics § Reputation § And more …
• Quality is also Designed into the Manufacturing Processes Manufacturing processes can be: – – Procedures Techniques Methods A series of actions that lead to a goal (definition) 1. 2. 3. 4. 5. 6. Should be specified by engineers who understand them Can be painstakingly detailed and planned Should be painstakingly followed, tested and checked Need trained personnel to understand them Need trained personnel to execute them Need appropriate quality tools to execute
Sample Industry Quality Failures • Ford recalled 1. 1 M pickups for gas tank problem (August 1, 2011) • Drug maker Johnson & Johnson cited on quality issues (November 26, 2010) • Stork Craft Manufacturing, Inc. recalled more than 500, 000 baby cribs (2009) • Toyota recalled multiple models of their vehicles (2009 -2011)
Ford to Recall 1. 1 M Pickups for Gas Tank Problem (August 1, 2011) Available at: http: //www. lemonauto. com/complaints/1_ford_recalls. htm? gclid=CLr. Im 6 v. Isao. CFQQmb. Aodc. FXx 8 A Reason for Recall: Falling off Gas Tanks Due to Rusty Straps Ford F-150 Ford F-250 Ford F-350 Ford F-450 Ford F-550 Ford Edge Lincoln Blackwood Lincoln MKX
Stork Craft Manufacturing Inc. Recalled More Than 500, 000 Baby Cribs (2009) Reason For Recall: The mattress support bracket failures create risk of entrapment and suffocation.
Drug Maker Johnson & Johnson Cited on Quality Issues Reasons for Citation: • Distribution of drugs that failed quality requirements • Failure to identify product defects during routine testing • Failure to detect incorrect expiration dates on drug labels • Failure to adequately investigate product problems • Failure to follow laboratory controls and inadequate training of lab staff
Toyota Recalls Failed to Address 'Root Cause' of Many Sudden Acceleration Cases
Toyota Recall Timeline • First Recall (September • Recall expanded in 29, 2009): Gas Pedal January 27, 2010 to Entrapment by Floor Mats: – – – – 2007 -2010 Camry 2005 -2010 Avalon 2004 -2009 Prius 2005 -2010 Tacoma 2007 -2010 Tundra 2007 -2010 ES 350 2006 -2010 IS 250 and IS 350 include: – – – 2008 -2010 Highlander 2009 -2010 Corolla 2009 -2010 Venza 2009 -2010 Matrix 2009 -2010 Pontiac Vibe
Second Recall (January 21, 2010): Sticky Gas Pedals • • • 2007 -2008 Tundra 2008 -2010 Sequoia 2005 -2010 Avalon 2007 -2010 Camry 2009 -2010 Corolla 2009 -2010 Matrix 2009 -2010 RAV 4 2010 Highlander 2009 -2010 Pontiac Vibe
Some Implications of Quality Failure • • • Lost business Lost customers Cost of lawsuits Damaged public image or reputation Cost of repairs Cost of scraps Cost of quality Loss of lives Cost due to injuries to customers Quality failures can be avoided
Common Quality Practices • Six Sigma • ISO 9000 & 14000 series • TL 9000 • Total quality management (TQM) • Lean manufacturing • Statistical process control (SPC) • Acceptance sampling • Quality function deployment (QFD) • Benchmarking • Total productive maintenance (TPM) • Design of experiment (DOE) • Kaizen
Six Sigma A six sigma process is one in which 99. 99966% of the products manufactured are statistically expected to be free of defects (3. 4 defects per million).
Common Quality Failure Denominators • Most quality failures could be avoided • Quality was designed into the products or processes (but) • Engineers and personnel overlooked something • Customers (users) risked their lives • The companies paid a heavy price • Workers (designers, inspectors, producers) are at the center of it all
Some Reasons for Quality Failures • Poor design of the product • Lack of appropriate design in/of the manufacturing processes • Lack of appropriate control or management of the manufacturing processes • Lack of appropriately trained personnel to manage the manufacturing processes • Poor planning and supervision of manufacturing processes • Lack of worker initiative and responsibility
Simple Process Analysis Tool Inspect Mix Pour Weigh Fail Pass Ship Dry Package Mold Grind Discard
Simple Process Analysis Tool Mix Weigh Grind Inspect Fail Discard Pass Pour Mold Dry Package Ship
Simple Process Analysis Tool Mix Weigh Grind Inspect Fail Discard Yes Pour Mold Dry Fail Inspect Pass Package Ship
Complex Process Analysis Tool
More Inspections Mean: • • • More resources will be needed Better educated personnel will be needed More dedicated personnel will be needed More responsible personnel will be needed Better and safer products will be produced Happier and more satisfied customers
Key Quality Failure Observations • Quality failures are preventable • Good quality failure prevention demands comprehensive process/product analysis • Good full-proof analysis demands trained, knowledgeable and dedicated quality personnel • Quality improvement efforts should be continuous with dedicated personnel
Areas for Joint Industry-Schools Quality Partnerships • Qualified quality personnel: – Dedication – Educated – Ethical – Fulfillment • Topics of interest: – Designing for quality – Prevention of quality failures – Providing training for company staff