Lean Six Sigma Duke Health Case Study NCHFMA





- Slides: 36
Lean Six Sigma Duke Health Case Study NCHFMA - 2018 Winter Institute March 12, 2018 Pinehurst, NC Garland Goins, Director Revenue and Documentation Integrity Denise Ashe, Revenue Integrity
Duke Health At A Glance City of Medicine, USA Durham is known as the City of Medicine, USA, with healthcare as a major industry including more than 300 medical and health-related companies and medical practices with a combined payroll that exceeds $1. 2 billion annually. The Duke University Health System (DUHS) • Fully Integrated 3 Hospital Health System • Intricate Primary Care, Home. Care and Hospice, Patient Revenue Management Organization, Research Institute and numerous Joint Ventures • Annual Operating Revenues Over $3. 6 B, Medical Center campus size: 99 buildings located on 210 acres. Gross square feet: 8 Million • Annual Visits: IP over 72 K, OP over 2. 5 M and 65 K in ED
Current Healthcare Industry Landscape
Current Healthcare Industry Landscape “U. S. Health-Care Spending Is on the Rise Again” “Health care spending growth hits 10 -year high” “Health Spending Is Rising More Sharply Again” Administratively Complex Workflows “While the United States health care system provides technologically advanced clinical services to the majority of the populations, it has spawned an extraordinarily complex administrative structure that substantially increases the cost of services. In addition to expenses, administrative complexity may also have a detrimental effect on patient services and may even lower the quality of care…”
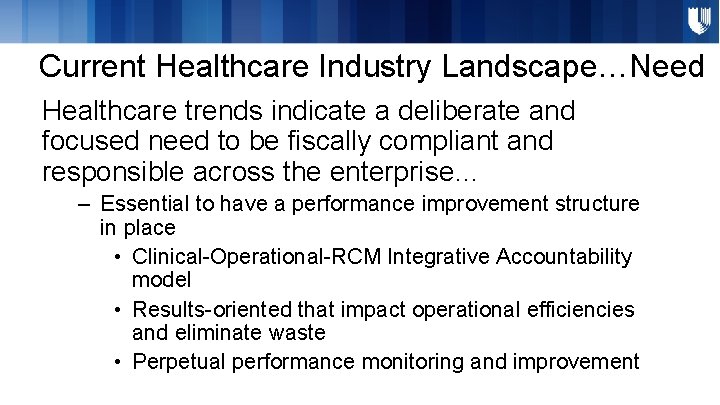
Current Healthcare Industry Landscape…Need Healthcare trends indicate a deliberate and focused need to be fiscally compliant and responsible across the enterprise… – Essential to have a performance improvement structure in place • Clinical-Operational-RCM Integrative Accountability model • Results-oriented that impact operational efficiencies and eliminate waste • Perpetual performance monitoring and improvement
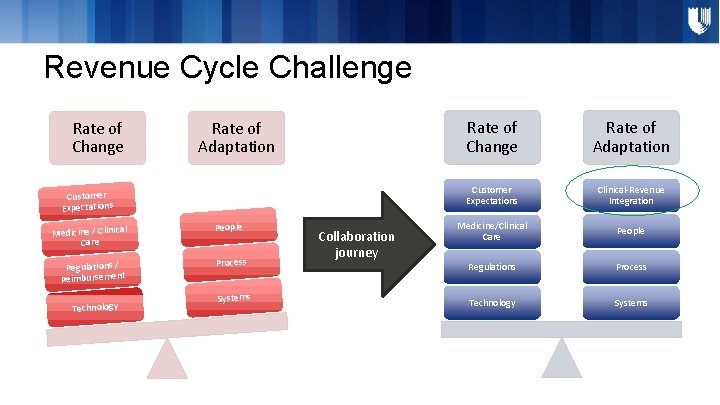
Revenue Cycle Challenge Rate of Change Rate of Adaptation Customer Expectations l Medicine / Clinica Care Regulations / Reimbursement Technology People Process Systems Collaboration journey Rate of Change Rate of Adaptation Customer Expectations Clinical-Revenue Integration Medicine/Clinical Care People Regulations Process Technology Systems
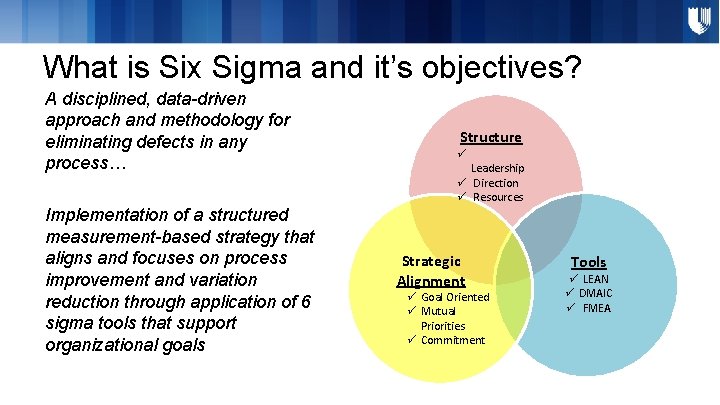
What is Six Sigma and it’s objectives? A disciplined, data-driven approach and methodology for eliminating defects in any process… Implementation of a structured measurement-based strategy that aligns and focuses on process improvement and variation reduction through application of 6 sigma tools that support organizational goals Structure ü Leadership ü Direction ü Resources Strategic Alignment ü Goal Oriented ü Mutual Priorities ü Commitment Tools ü LEAN ü DMAIC ü FMEA
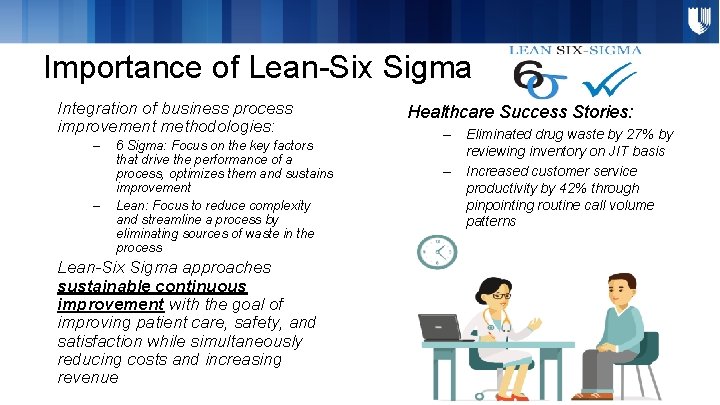
Importance of Lean-Six Sigma Integration of business process improvement methodologies: – – 6 Sigma: Focus on the key factors that drive the performance of a process, optimizes them and sustains improvement Lean: Focus to reduce complexity and streamline a process by eliminating sources of waste in the process Lean-Six Sigma approaches sustainable continuous improvement with the goal of improving patient care, safety, and satisfaction while simultaneously reducing costs and increasing revenue Healthcare Success Stories: – Eliminated drug waste by 27% by reviewing inventory on JIT basis – Increased customer service productivity by 42% through pinpointing routine call volume patterns
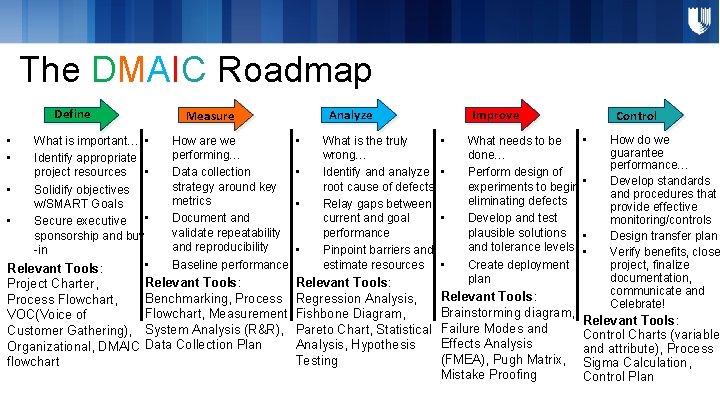
The DMAIC Roadmap Define • • What is important… • Identify appropriate • project resources • Solidify objectives w/SMART Goals • Secure executive • sponsorship and buy -in • Relevant Tools: Analyze Measure How are we performing… Data collection strategy around key metrics Document and validate repeatability and reproducibility Baseline performance Relevant Tools: Project Charter, Benchmarking, Process Flowchart, Measurement VOC(Voice of Customer Gathering), System Analysis (R&R), Organizational, DMAIC Data Collection Plan flowchart • • What is the truly wrong… Identify and analyze root cause of defects Relay gaps between current and goal performance Pinpoint barriers and estimate resources Relevant Tools: Regression Analysis, Fishbone Diagram, Pareto Chart, Statistical Analysis, Hypothesis Testing Improve • • Control What needs to be • done… Perform design of experiments to begin • eliminating defects Develop and test plausible solutions • and tolerance levels • Create deployment plan Relevant Tools: Brainstorming diagram, Failure Modes and Effects Analysis (FMEA), Pugh Matrix, Mistake Proofing How do we guarantee performance… Develop standards and procedures that provide effective monitoring/controls Design transfer plan Verify benefits, close project, finalize documentation, communicate and Celebrate! Relevant Tools: Control Charts (variable and attribute), Process Sigma Calculation, Control Plan
Children’s Health Center Allergy Immunology & Pulmonary Function Testing Workflow Optimization
Project Team Executive Sponsor: Jessica Simo Project Champions: John Sleasman, MD Dept. Chief, Allergy Immunology & Pediatric Pulmonology Dept. Jason Lang, MD Medical Director Black Belt: Mary Jane Stillwagon, RN, BSN Green Belts: Jeffrey Sank, RRT, RCP, RPSGT Denise Ashe, BS Team Members: Joseph Roberts, MD, Ph. D Debra Sedlak, CPNP Virginia Labelle, CPNP Stephanie King, RRT D M A I C
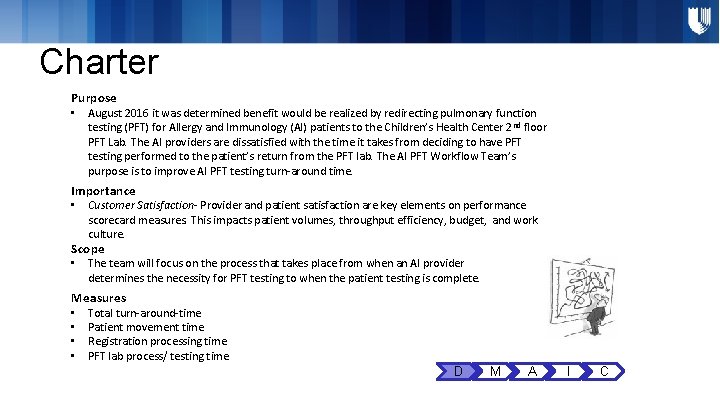
Charter Purpose • August 2016 it was determined benefit would be realized by redirecting pulmonary function testing (PFT) for Allergy and Immunology (AI) patients to the Children’s Health Center 2 nd floor PFT Lab. The AI providers are dissatisfied with the time it takes from deciding to have PFT testing performed to the patient’s return from the PFT lab. The AI PFT Workflow Team’s purpose is to improve AI PFT testing turn-around time. Importance • Customer Satisfaction- Provider and patient satisfaction are key elements on performance scorecard measures. This impacts patient volumes, throughput efficiency, budget, and work culture. Scope • The team will focus on the process that takes place from when an AI provider determines the necessity for PFT testing to when the patient testing is complete. Measures • • Total turn-around-time Patient movement time Registration processing time PFT lab process/ testing time D M A I C
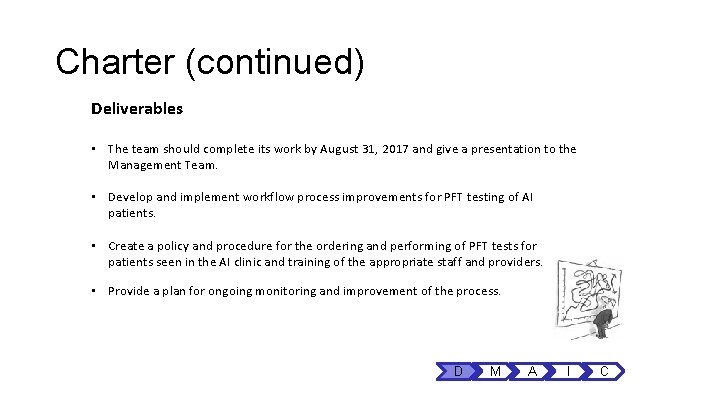
Charter (continued) Deliverables • The team should complete its work by August 31, 2017 and give a presentation to the Management Team. • Develop and implement workflow process improvements for PFT testing of AI patients. • Create a policy and procedure for the ordering and performing of PFT tests for patients seen in the AI clinic and training of the appropriate staff and providers. • Provide a plan for ongoing monitoring and improvement of the process. D M A I C
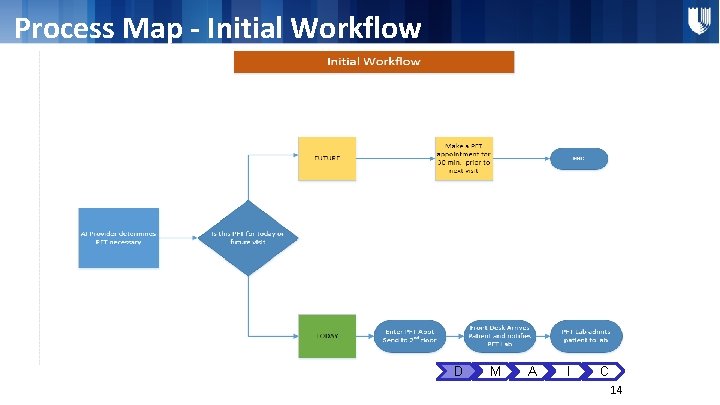
Process Map - Initial Workflow D M A I C 14
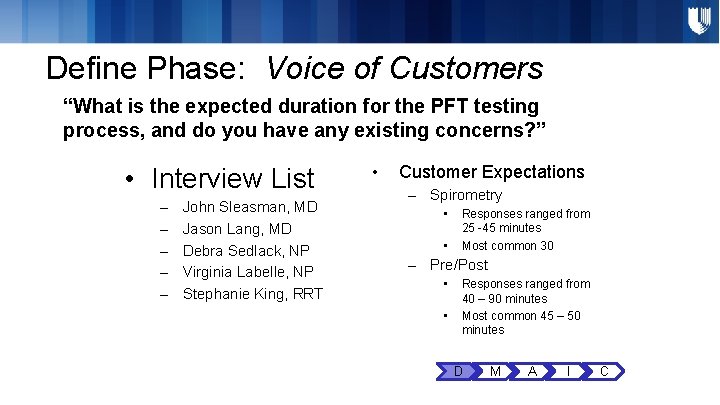
Define Phase: Voice of Customers “What is the expected duration for the PFT testing process, and do you have any existing concerns? ” • Interview List – – – John Sleasman, MD Jason Lang, MD Debra Sedlack, NP Virginia Labelle, NP Stephanie King, RRT • Customer Expectations – Spirometry • • Responses ranged from 25 -45 minutes Most common 30 – Pre/Post • • Responses ranged from 40 – 90 minutes Most common 45 – 50 minutes D M A I C
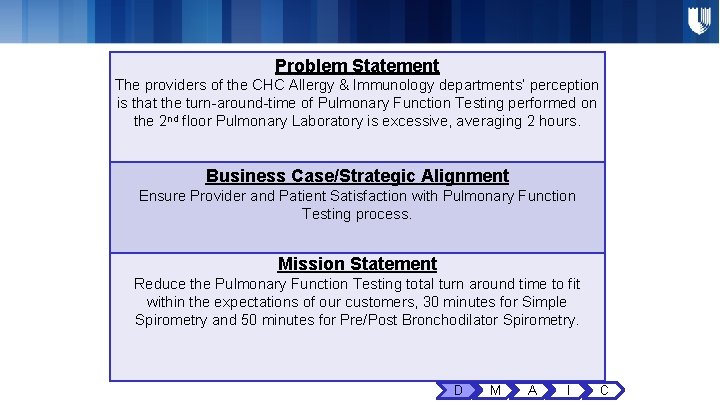
Problem Statement The providers of the CHC Allergy & Immunology departments’ perception is that the turn-around-time of Pulmonary Function Testing performed on the 2 nd floor Pulmonary Laboratory is excessive, averaging 2 hours. Business Case/Strategic Alignment Ensure Provider and Patient Satisfaction with Pulmonary Function Testing process. Mission Statement Reduce the Pulmonary Function Testing total turn around time to fit within the expectations of our customers, 30 minutes for Simple Spirometry and 50 minutes for Pre/Post Bronchodilator Spirometry. D M A I C
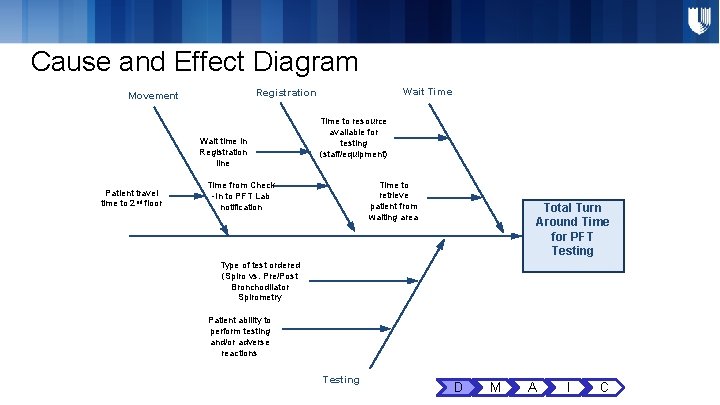
Cause and Effect Diagram Wait time in Registration line Patient travel time to 2 nd floor Wait Time Registration Movement Time to resource available for testing (staff/equipment) Time to retrieve patient from waiting area Time from Check -In to PFT Lab notification Total Turn Around Time for PFT Testing Type of test ordered (Spiro vs. Pre/Post Bronchodilator Spirometry Patient ability to perform testing and/or adverse reactions Testing D M A I C
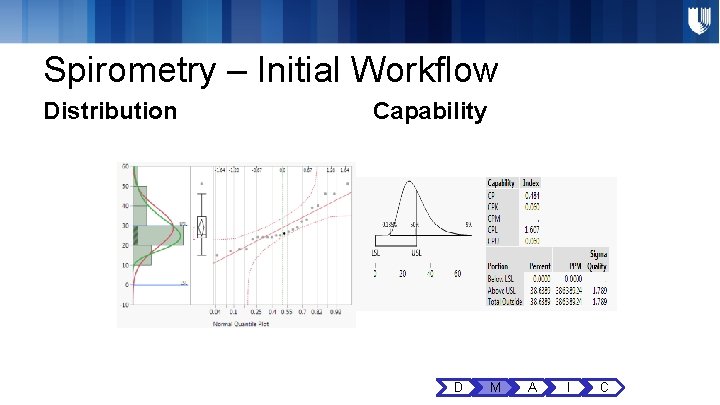
Spirometry – Initial Workflow Distribution Capability D M A I C
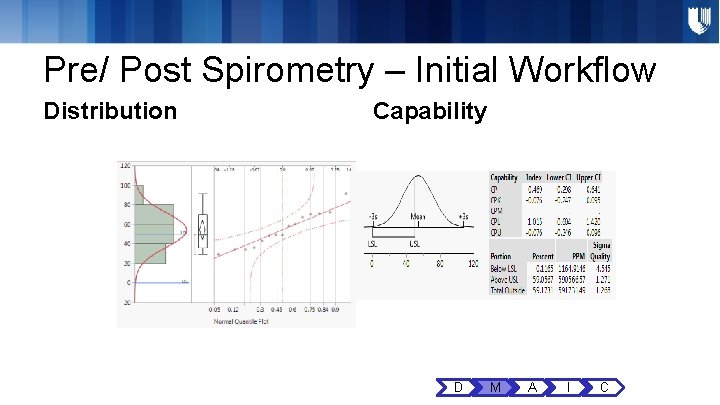
Pre/ Post Spirometry – Initial Workflow Distribution Capability D M A I C
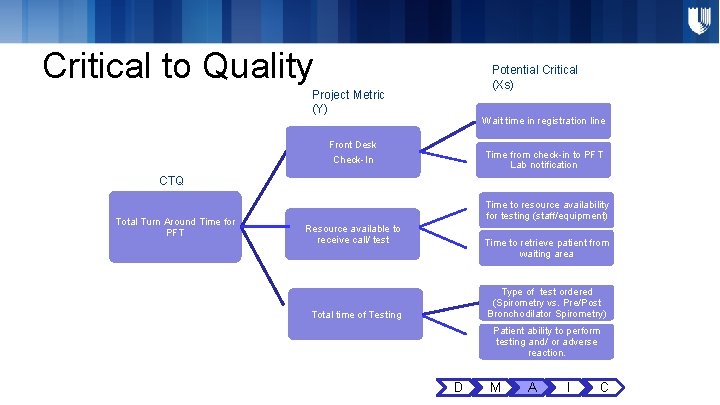
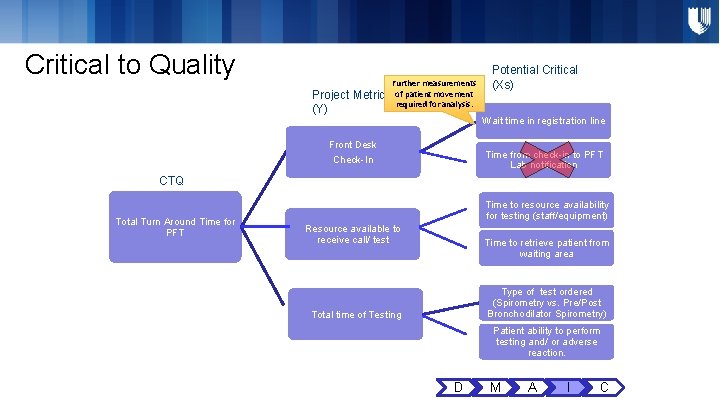
Critical to Quality Potential Critical (Xs) Project Metric (Y) Wait time in registration line Front Desk Check-In Time from check-in to PFT Lab notification CTQ Total Turn Around Time for PFT Time to resource availability for testing (staff/equipment) Resource available to receive call/ test Time to retrieve patient from waiting area Type of test ordered (Spirometry vs. Pre/Post Bronchodilator Spirometry) Total time of Testing Patient ability to perform testing and/ or adverse reaction. D M A I C
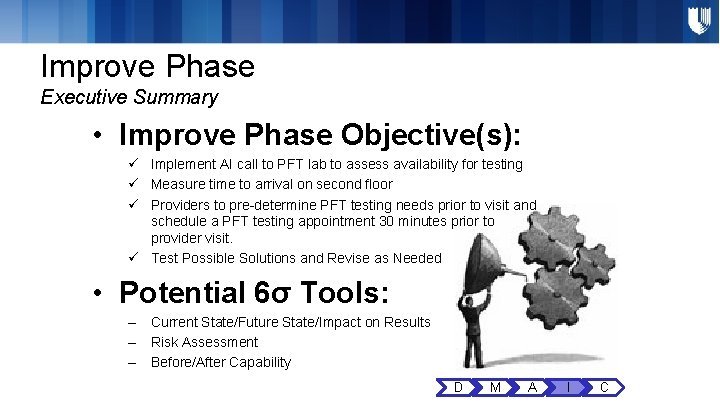
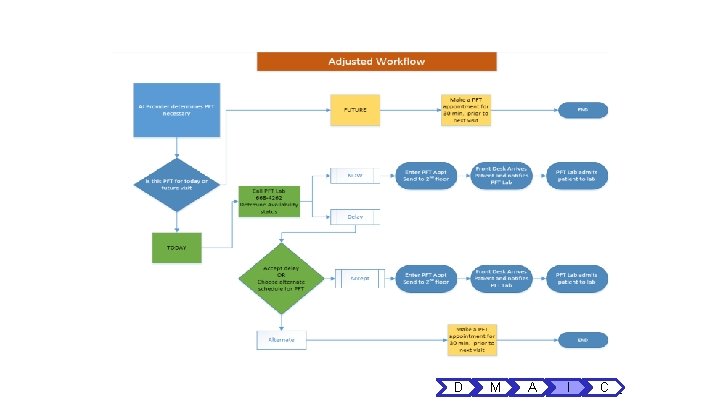
Improve Phase Executive Summary • Improve Phase Objective(s): ü Implement AI call to PFT lab to assess availability for testing ü Measure time to arrival on second floor ü Providers to pre-determine PFT testing needs prior to visit and schedule a PFT testing appointment 30 minutes prior to provider visit. ü Test Possible Solutions and Revise as Needed • Potential 6σ Tools: – Current State/Future State/Impact on Results – Risk Assessment – Before/After Capability D M A I C
Process Map - Adjusted Workflow D M A I C 22
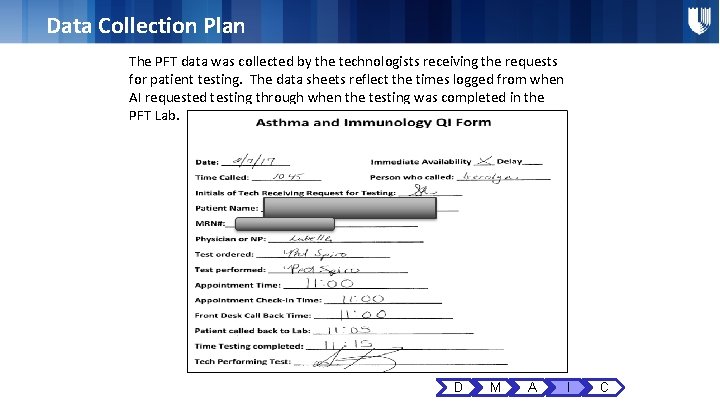
Data Collection Plan The PFT data was collected by the technologists receiving the requests for patient testing. The data sheets reflect the times logged from when AI requested testing through when the testing was completed in the PFT Lab. D M A I C
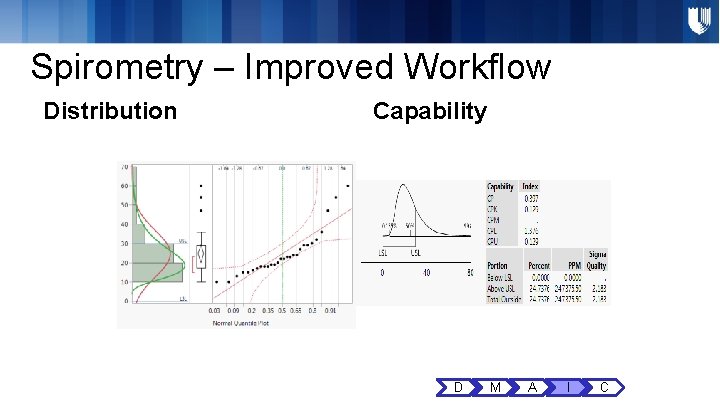
Spirometry – Improved Workflow Distribution Capability D M A I C
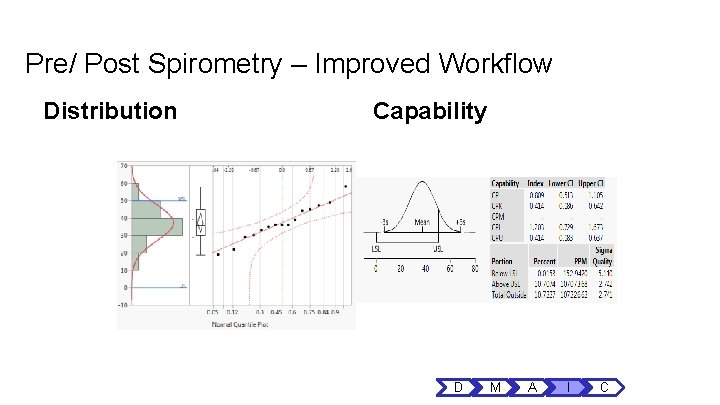
Pre/ Post Spirometry – Improved Workflow Distribution Capability D M A I C
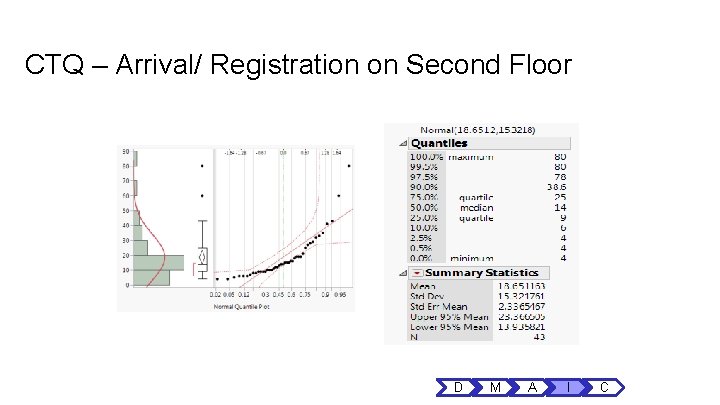
CTQ – Arrival/ Registration on Second Floor D M A I C
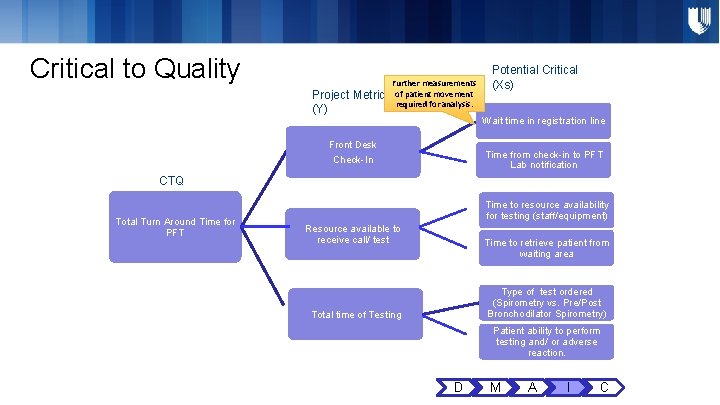
Critical to Quality Project Metric (Y) Further measurements of patient movement required for analysis. Potential Critical (Xs) Wait time in registration line Front Desk Check-In Time from check-in to PFT Lab notification CTQ Total Turn Around Time for PFT Time to resource availability for testing (staff/equipment) Resource available to receive call/ test Time to retrieve patient from waiting area Type of test ordered (Spirometry vs. Pre/Post Bronchodilator Spirometry) Total time of Testing Patient ability to perform testing and/ or adverse reaction. D M A I C
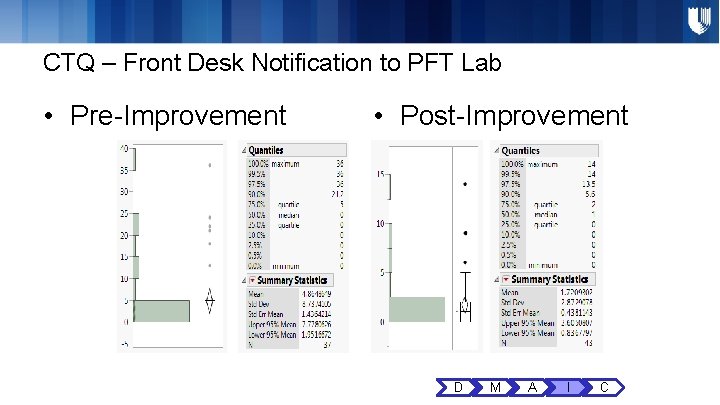
CTQ – Front Desk Notification to PFT Lab • Pre-Improvement • Post-Improvement D M A I C
Critical to Quality Project Metric (Y) Further measurements of patient movement required for analysis. Potential Critical (Xs) Wait time in registration line Front Desk Check-In Time from check-in to PFT Lab notification CTQ Total Turn Around Time for PFT Time to resource availability for testing (staff/equipment) Resource available to receive call/ test Time to retrieve patient from waiting area Type of test ordered (Spirometry vs. Pre/Post Bronchodilator Spirometry) Total time of Testing Patient ability to perform testing and/ or adverse reaction. D M A I C
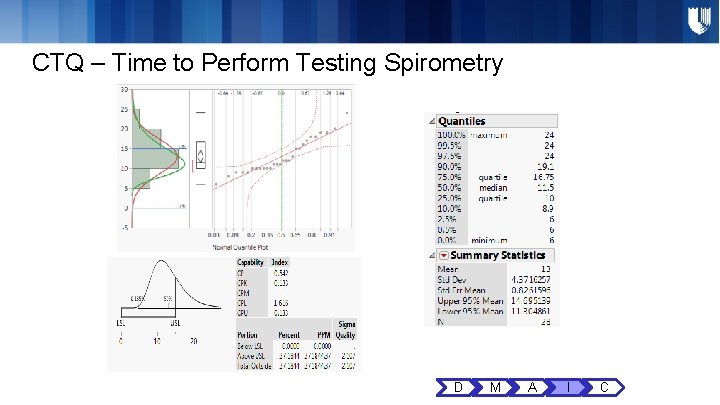
CTQ – Time to Perform Testing Spirometry D M A I C
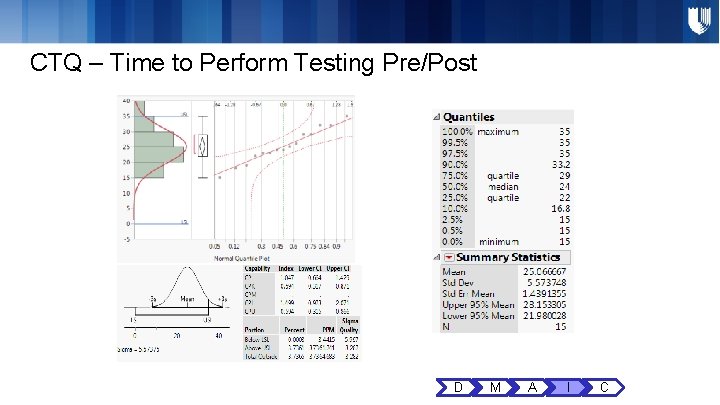
CTQ – Time to Perform Testing Pre/Post D M A I C
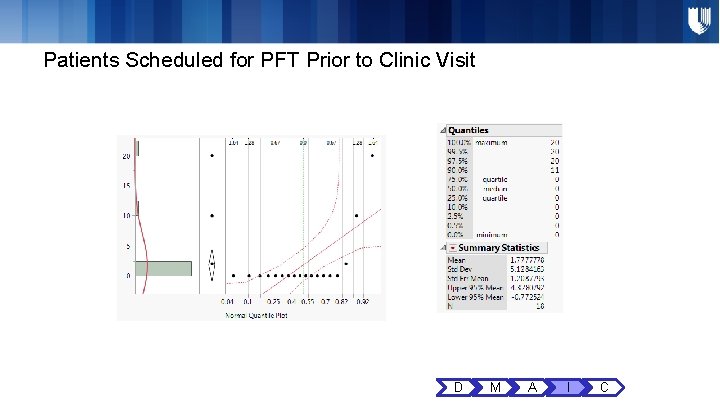
Patients Scheduled for PFT Prior to Clinic Visit D M A I C
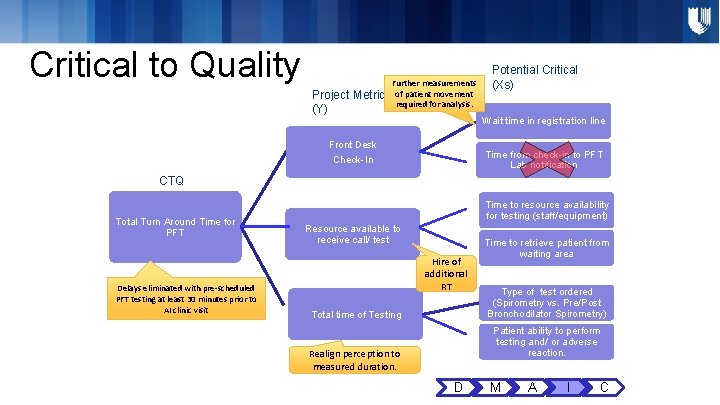
Critical to Quality Project Metric (Y) Further measurements of patient movement required for analysis. Potential Critical (Xs) Wait time in registration line Front Desk Check-In Time from check-in to PFT Lab notification CTQ Total Turn Around Time for PFT Delays eliminated with pre-scheduled PFT testing at least 30 minutes prior to AI clinic visit Time to resource availability for testing (staff/equipment) Resource available to receive call/ test Hire of additional RT Total time of Testing Time to retrieve patient from waiting area Type of test ordered (Spirometry vs. Pre/Post Bronchodilator Spirometry) Patient ability to perform testing and/ or adverse reaction. Realign perception to measured duration. D M A I C
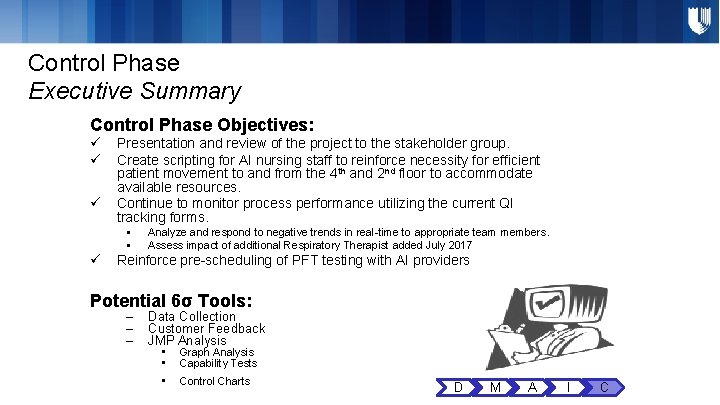
Control Phase Executive Summary Control Phase Objectives: ü ü ü Presentation and review of the project to the stakeholder group. Create scripting for AI nursing staff to reinforce necessity for efficient patient movement to and from the 4 th and 2 nd floor to accommodate available resources. Continue to monitor process performance utilizing the current QI tracking forms. § § ü Analyze and respond to negative trends in real-time to appropriate team members. Assess impact of additional Respiratory Therapist added July 2017 Reinforce pre-scheduling of PFT testing with AI providers Potential 6σ Tools: – – – Data Collection Customer Feedback JMP Analysis • • Graph Analysis Capability Tests • Control Charts D M A I C
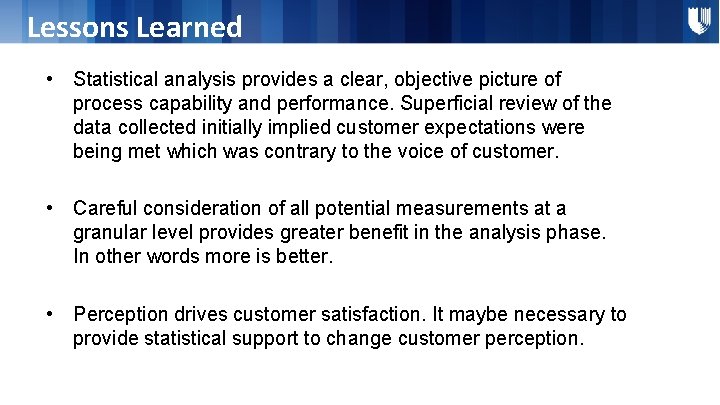
Lessons Learned • Statistical analysis provides a clear, objective picture of process capability and performance. Superficial review of the data collected initially implied customer expectations were being met which was contrary to the voice of customer. • Careful consideration of all potential measurements at a granular level provides greater benefit in the analysis phase. In other words more is better. • Perception drives customer satisfaction. It maybe necessary to provide statistical support to change customer perception.
Questions? • Garland Goins (garland. goins@duke. edu) • Denise Ashe (denise. ashe@duke. edu)