
SIX SIGMA Ruben Guajardo Deepak Navnith MSE 269
SIX SIGMA Ruben Guajardo Deepak Navnith MS&E 269 Victor Torres Kuan Zhang Professor: Neil Kane A STRATEGY FOR PERFORMANCE EXCELLENCE March 16 th, 2001

SIX SIGMA How good is good enough? 99. 9% is already VERY GOOD But what could happen at a quality level of 99. 9% (i. e. , 1000 ppm), in our everyday lives (about 4. 6 )? • 4000 wrong medical prescriptions each year • More than 3000 newborns accidentally falling from the hands of nurses or doctors each year • Two long or short landings at American airports each day • 400 letters per hour which never arrive at their destination
SIX SIGMA How can we get these results • 13 wrong drug prescriptions per year • 10 newborn babies dropped by doctors/nurses per year • Two short or long landings per year in all the airports in the U. S. • One lost article of mail per hour
SIX SIGMA The answer is: Six Sigma
SIX SIGMA What is Six Sigma l l A Vision and Philosophical commitment to our consumers to offer the highest quality, lowest cost products A Metric that demonstrates quality levels at 99. 9997% performance for products and processs A Benchmark of our product and process capability for comparison to ‘best in class’ A practical application of statistical Tools and Methods to help us measure, analyze, improve, and control our process
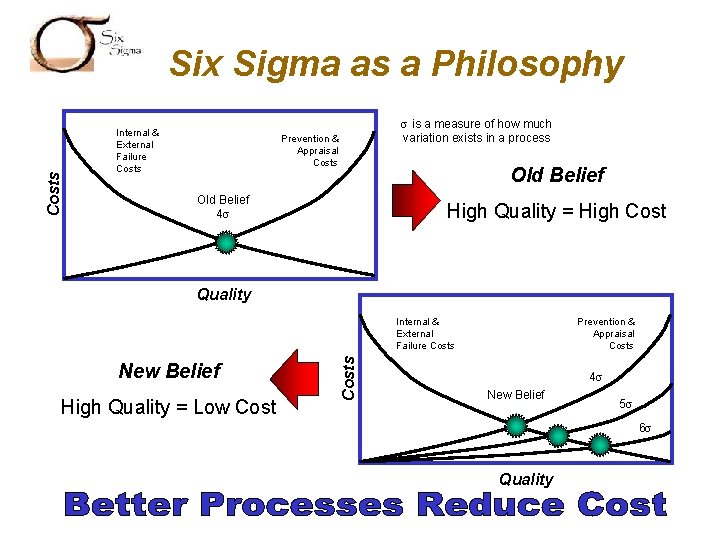
Costs SIX SIGMA Six Sigma as a Philosophy Internal & External Failure Costs s is a measure of how much variation exists in a process Prevention & Appraisal Costs Old Belief 4 s High Quality = High Cost Quality New Belief High Quality = Low Costs Internal & External Failure Costs Prevention & Appraisal Costs 4 s New Belief 5 s 6 s Quality
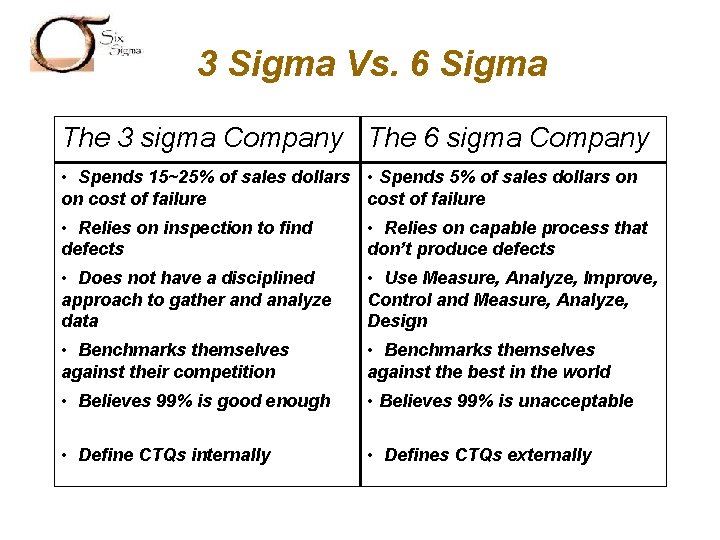
SIX SIGMA 3 Sigma Vs. 6 Sigma The 3 sigma Company The 6 sigma Company • Spends 15~25% of sales dollars • Spends 5% of sales dollars on on cost of failure • Relies on inspection to find defects • Relies on capable process that don’t produce defects • Does not have a disciplined approach to gather and analyze data • Use Measure, Analyze, Improve, Control and Measure, Analyze, Design • Benchmarks themselves against their competition • Benchmarks themselves against the best in the world • Believes 99% is good enough • Believes 99% is unacceptable • Define CTQs internally • Defines CTQs externally
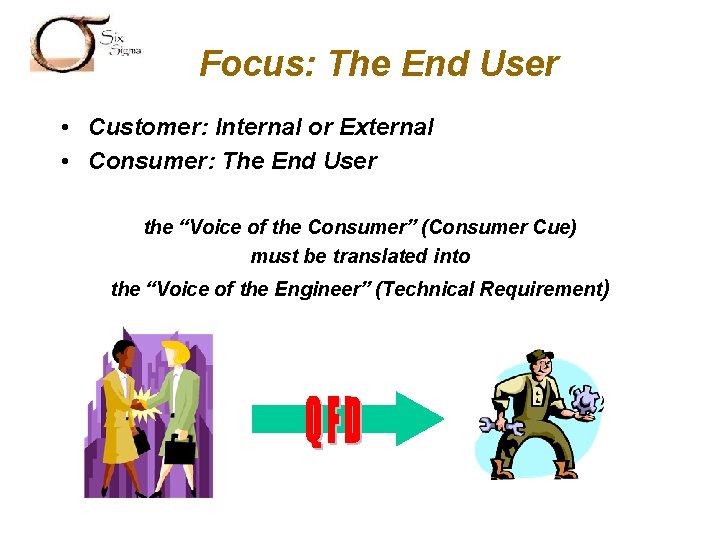
SIX SIGMA Focus: The End User • Customer: Internal or External • Consumer: The End User the “Voice of the Consumer” (Consumer Cue) must be translated into the “Voice of the Engineer” (Technical Requirement)
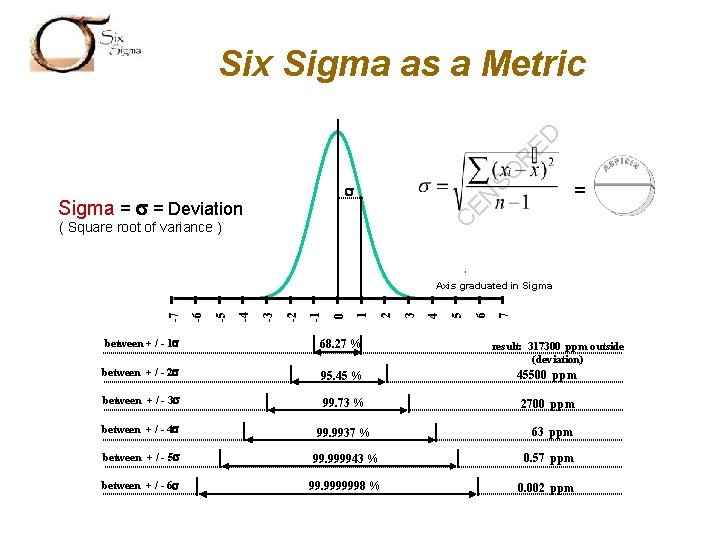
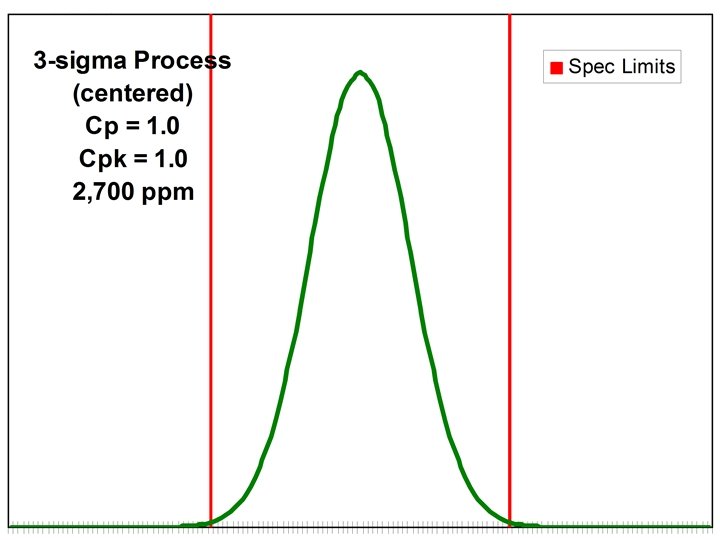
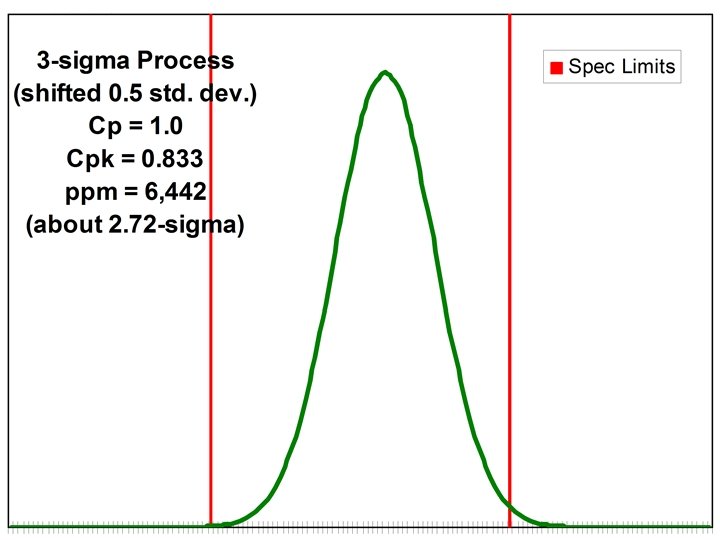
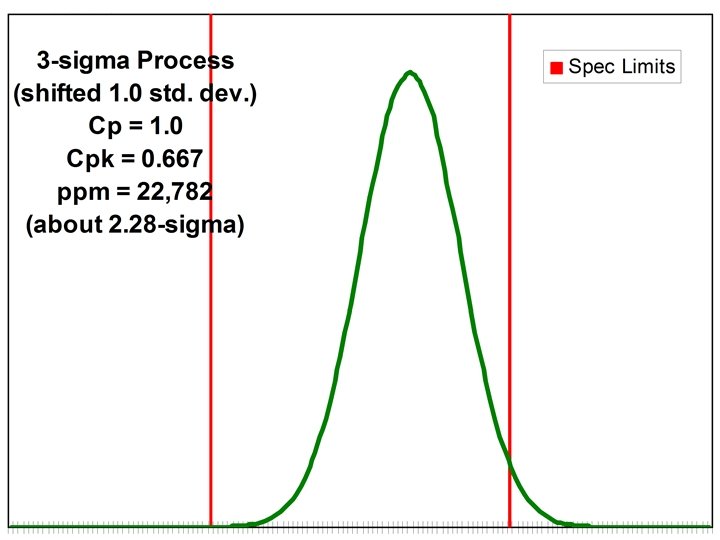
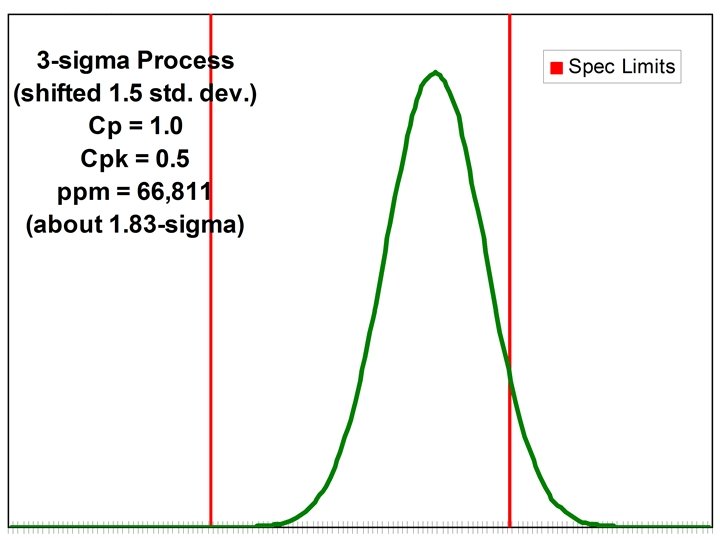
SO R ED SIX SIGMA Six Sigma as a Metric C Sigma = = Deviation = EN ( Square root of variance ) 7 6 5 4 3 2 1 0 -1 -2 -3 -4 -5 -6 -7 Axis graduated in Sigma between + / - 1 68. 27 % between + / - 2 95. 45 % 45500 ppm between + / - 3 99. 73 % 2700 ppm between + / - 4 99. 9937 % 63 ppm between + / - 5 99. 999943 % 0. 57 ppm between + / - 6 99. 9999998 % 0. 002 ppm result: 317300 ppm outside (deviation)
SIX SIGMA
SIX SIGMA
SIX SIGMA
SIX SIGMA
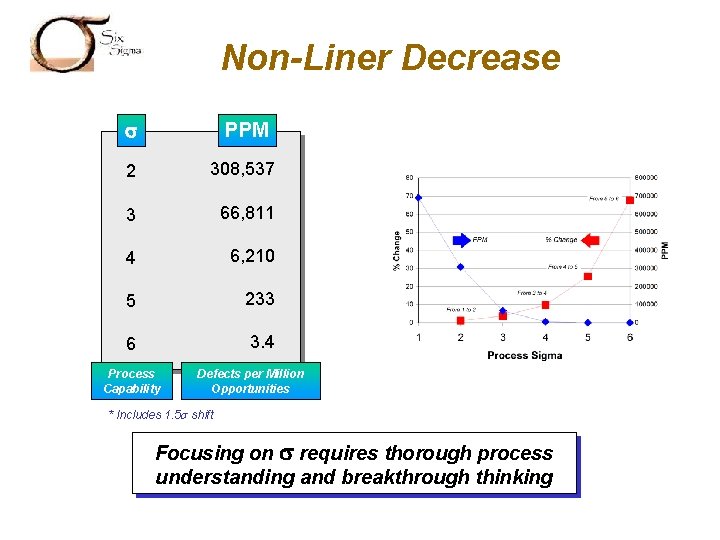
SIX SIGMA Non-Liner Decrease PPM 2 308, 537 3 66, 811 4 6, 210 5 233 6 3. 4 Process Capability Defects per Million Opportunities * Includes 1. 5 s shift Focusing on requires thorough process understanding and breakthrough thinking
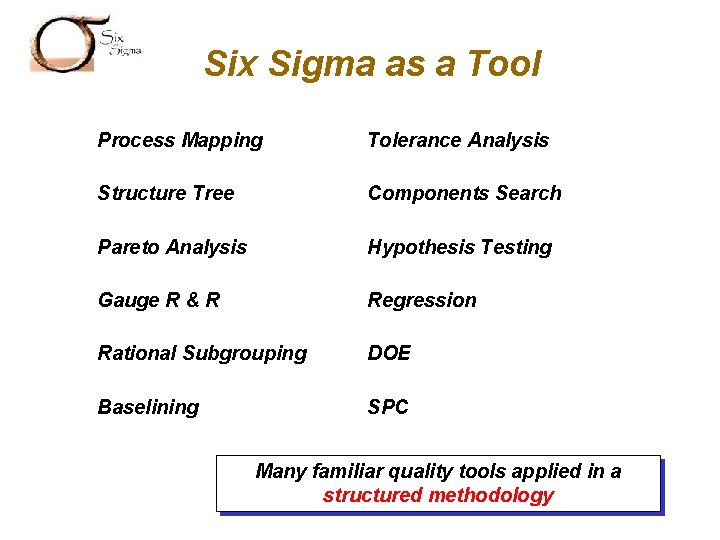
SIX SIGMA Six Sigma as a Tool Process Mapping Tolerance Analysis Structure Tree Components Search Pareto Analysis Hypothesis Testing Gauge R & R Regression Rational Subgrouping DOE Baselining SPC Many familiar quality tools applied in a structured methodology
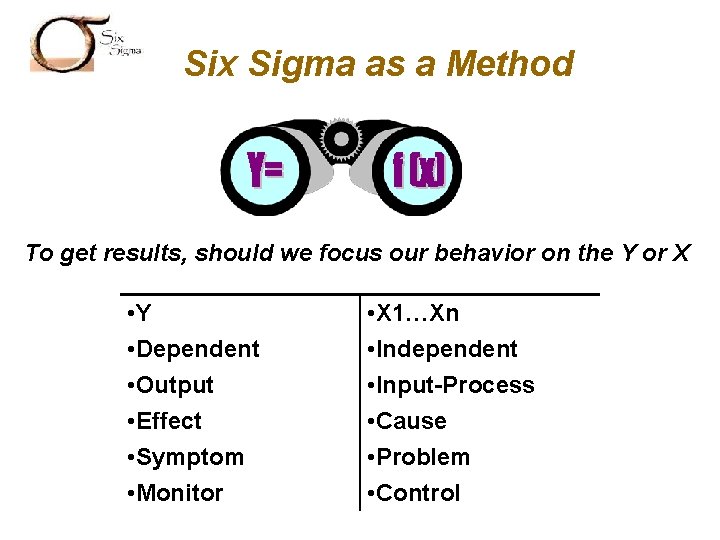
SIX SIGMA Six Sigma as a Method To get results, should we focus our behavior on the Y or X • Y • Dependent • Output • Effect • Symptom • Monitor • X 1…Xn • Independent • Input-Process • Cause • Problem • Control
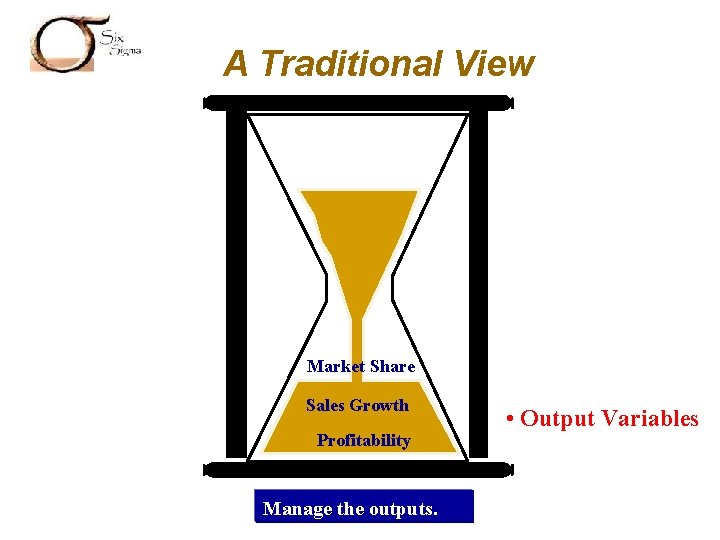
SIX SIGMA A Traditional View Market Share Sales Growth Profitability Manage the outputs. • Output Variables
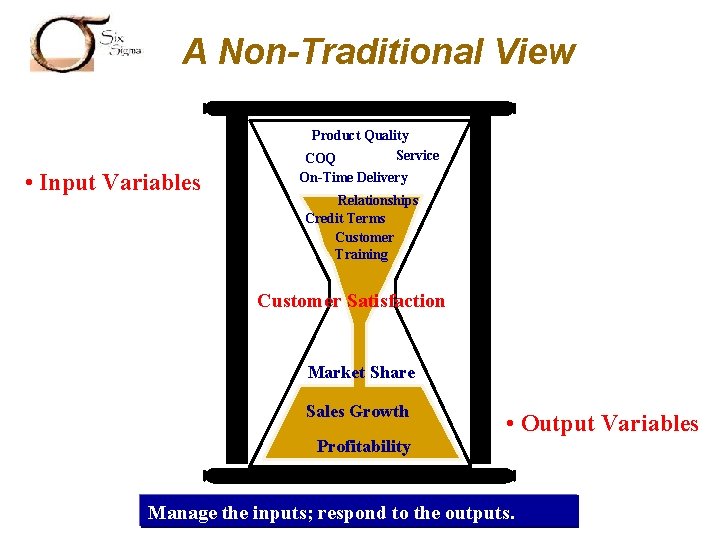
SIX SIGMA A Non-Traditional View Product Quality Service COQ • Input Variables On-Time Delivery Relationships Credit Terms Customer Training Customer Satisfaction Market Share Sales Growth Profitability • Output Variables Manage the inputs; respond to the outputs.

SIX SIGMA Distinguish “Vital Few” from “Trivial Many” Material Environment Measurements Methods Machine People Process (Parameters) Output Define the Problem / Defect Statement Y = f ( x 1*, x 2, x 3, x 4*, x 5. . . X n) Y= x= x* = Dependent Variable Independent Variables Independent Variable Output, Defect Potential Cause Critical Cause
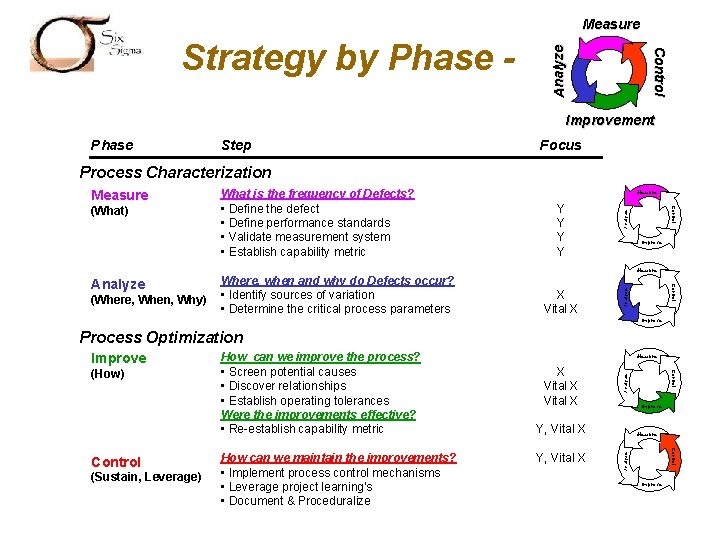
Analyze Control SIX SIGMA Strategy by Phase - Measure Improvement Phase Step Focus Process Characterization Measure Y Y Control (What) What is the frequency of Defects? • Define the defect • Define performance standards • Validate measurement system • Establish capability metric Analyze Measure Improve Measure X Vital X Analyze (Where, When, Why) Control Analyze Where, when and why do Defects occur? • Identify sources of variation • Determine the critical process parameters Improve Process Optimization (Sustain, Leverage) How can we maintain the improvements? • Implement process control mechanisms • Leverage project learning's • Document & Proceduralize Analyze X Vital X Improve Y, Vital X Measure Control (How) How can we improve the process? • Screen potential causes • Discover relationships • Establish operating tolerances Were the improvements effective? • Re-establish capability metric Analyze Improve

SIX SIGMA Six Sigma Organization
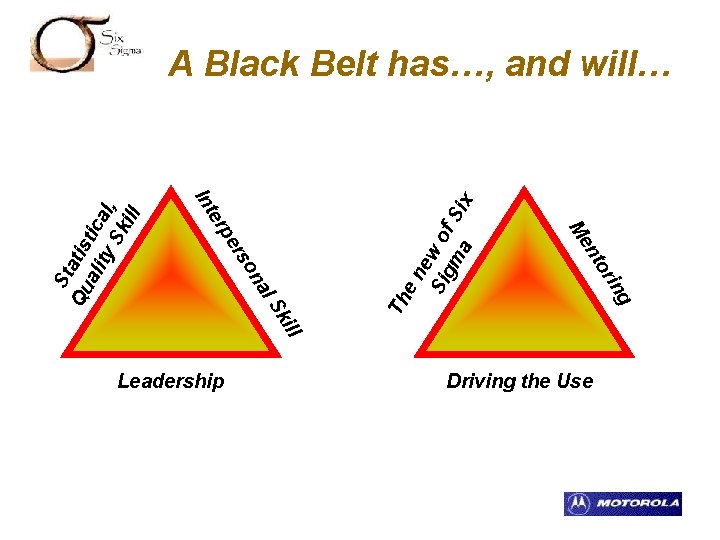
l il Sk Th al Leadership Driving the Use ing or nt Me on rs pe er en ew Sig o ma f Si x Int St Qu atis ali tica ty Sk l, ill SIX SIGMA A Black Belt has…, and will…
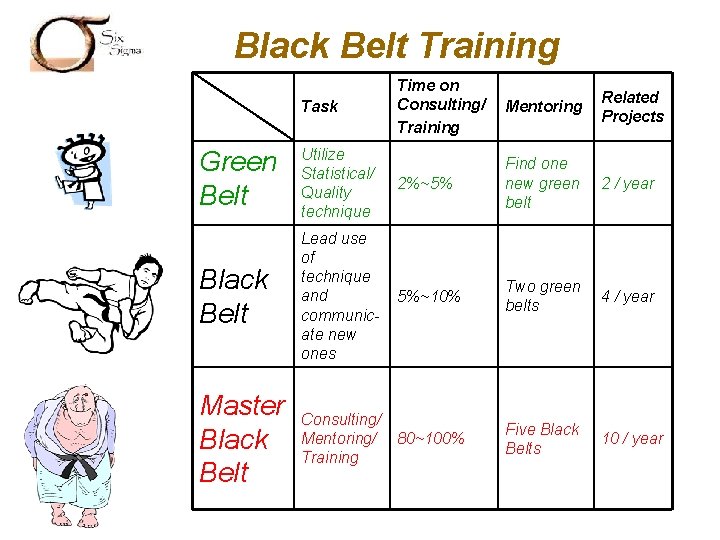
SIX Belt SIGMA Black Training Task Time on Consulting/ Training Mentoring Related Projects 2 / year Green Belt Utilize Statistical/ Quality technique 2%~5% Find one new green belt Black Belt Lead use of technique and communicate new ones 5%~10% Two green belts 4 / year Master Black Belt Consulting/ Mentoring/ Training 80~100% Five Black Belts 10 / year
SIX SIGMA
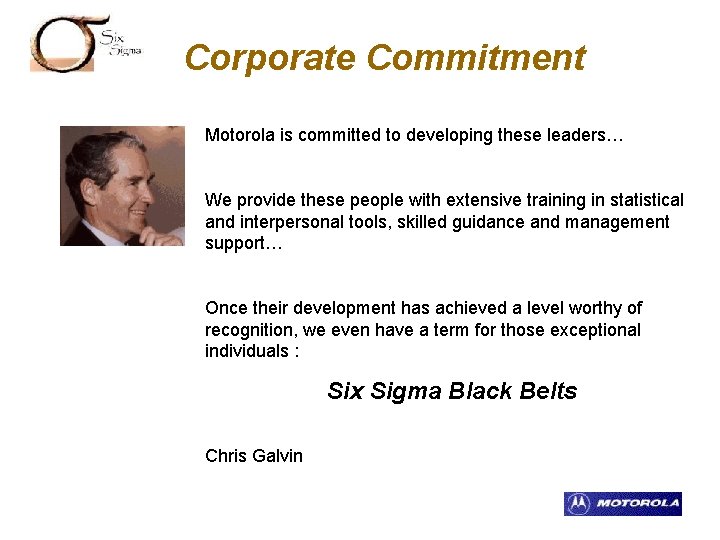
SIX SIGMA Corporate Commitment Motorola is committed to developing these leaders… We provide these people with extensive training in statistical and interpersonal tools, skilled guidance and management support… Once their development has achieved a level worthy of recognition, we even have a term for those exceptional individuals : Six Sigma Black Belts Chris Galvin
SIX SIGMA Corporate Commitment (Cont’d) • Motto: – Quality is our job – Customer satisfaction is our duty – Customer loyalty is our future
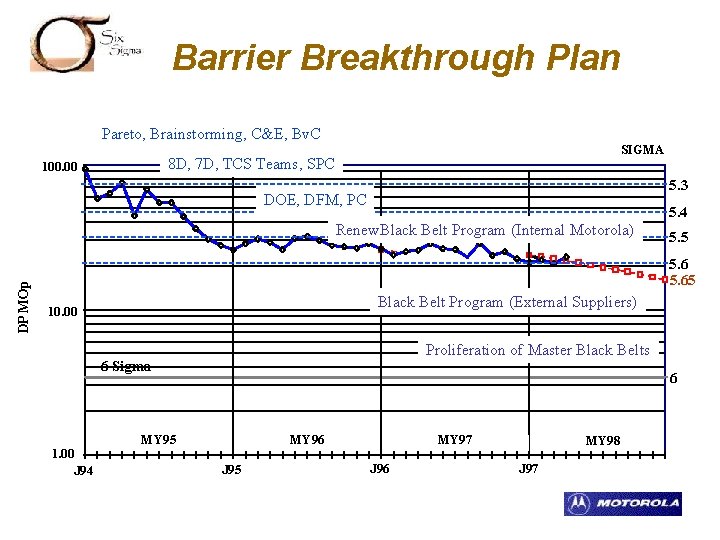
SIX SIGMA Barrier Breakthrough Plan Pareto, Brainstorming, C&E, Bv. C SIGMA 8 D, 7 D, TCS Teams, SPC 100. 00 5. 3 DOE, DFM, PC 5. 4 DPMOp Renew. Black Belt Program (Internal Motorola) 5. 5 5. 65 Black Belt Program (External Suppliers) 10. 00 Proliferation of Master Black Belts 6 Sigma 1. 00 J 94 6 MY 95 MY 96 J 95 MY 97 J 96 MY 98 J 97
SIX SIGMA Other Companies have Black Belts Program • GE has very successfully instituted this program – 4, 000 trained Black Belts by YE 1997 – 10, 000 trained Black Belts by YE 2000 – “You haven’t much future at GE unless they are selected to become Black Belts” - Jack Welch • Kodak has instituted this program – CEO and COO driven process – Training includes both written and oral exams – Minimum requirements: a college education, basic statistics, presentation skills, computer skills • Other companies include: – Allied Signal – IBM – Navistar -Texas Instruments - ABB - Citibank
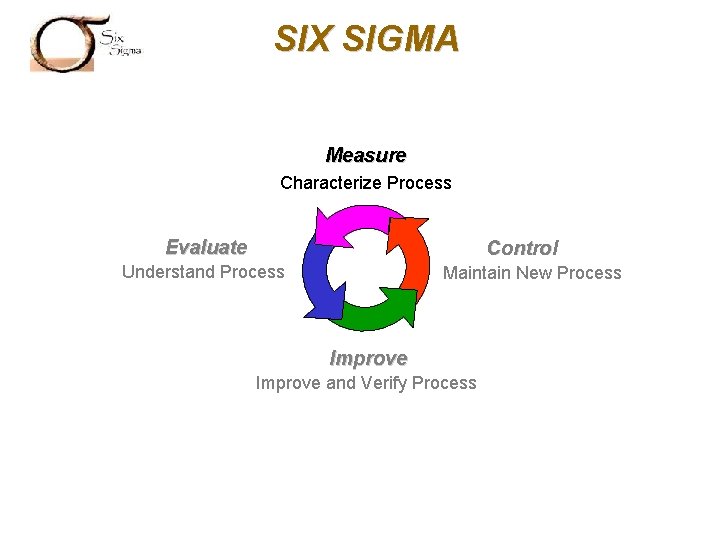
SIX SIGMA Measure Characterize Process Evaluate Control Understand Process Maintain New Process Improve and Verify Process
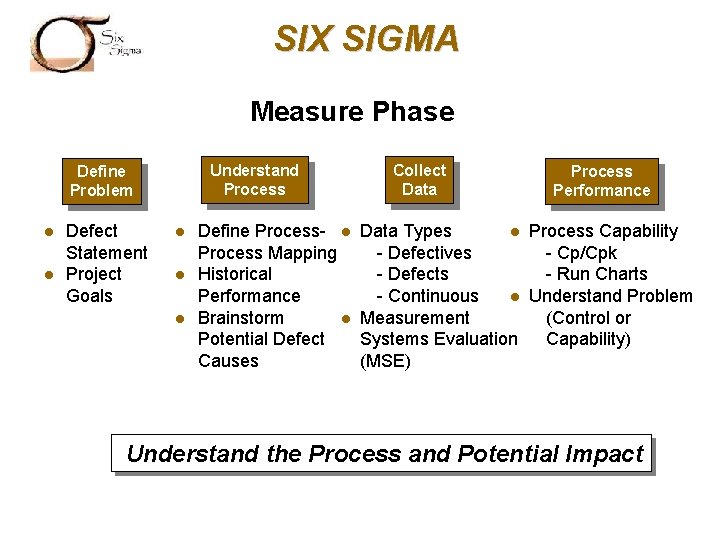
SIX SIGMA Measure Phase Understand Process Define Problem l l Defect Statement Project Goals l l l Define Process- l Process Mapping Historical Performance Brainstorm l Potential Defect Causes Collect Data Process Performance Data Types l Process Capability - Defectives - Cp/Cpk - Defects - Run Charts - Continuous l Understand Problem Measurement (Control or Systems Evaluation Capability) (MSE) Understand the Process and Potential Impact
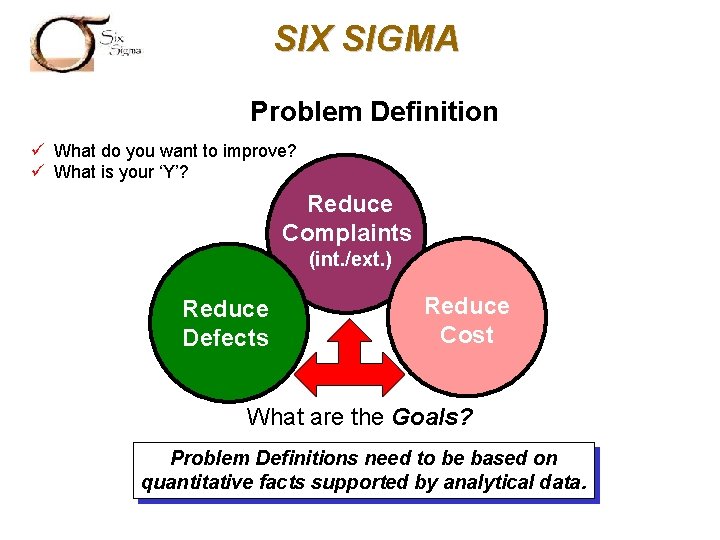
SIX SIGMA Problem Definition ü What do you want to improve? ü What is your ‘Y’? Reduce Complaints (int. /ext. ) Reduce Defects Reduce Cost What are the Goals? Problem Definitions need to be based on quantitative facts supported by analytical data.
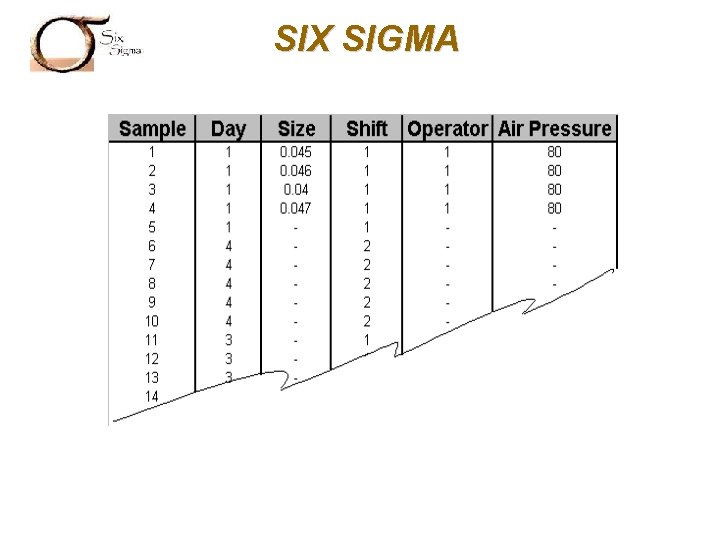
SIX SIGMA Baselining: Quantifying the goodness (or badness!) of the current process, before ANY improvements are made, using sample data. The key to baselining is collecting representative sample data Sampling Plan - Size of Subgroups - Number of Subgroups - Take as many “X” as possible into consideration
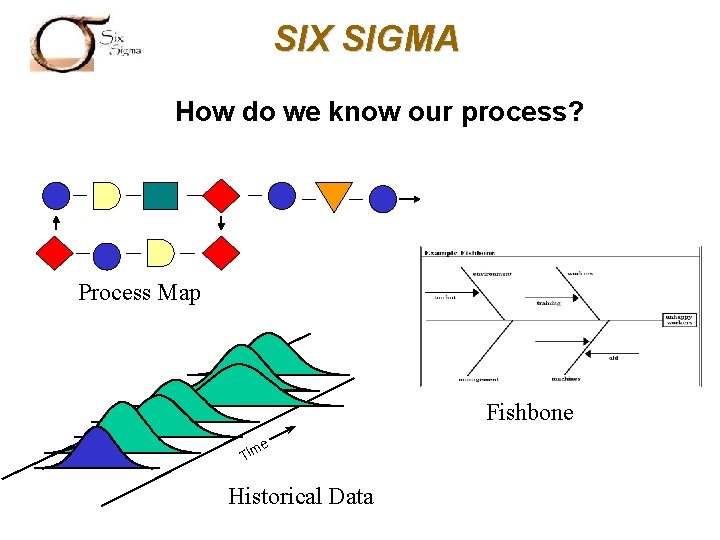
SIX SIGMA How do we know our process? Process Map Fishbone e Tim Historical Data
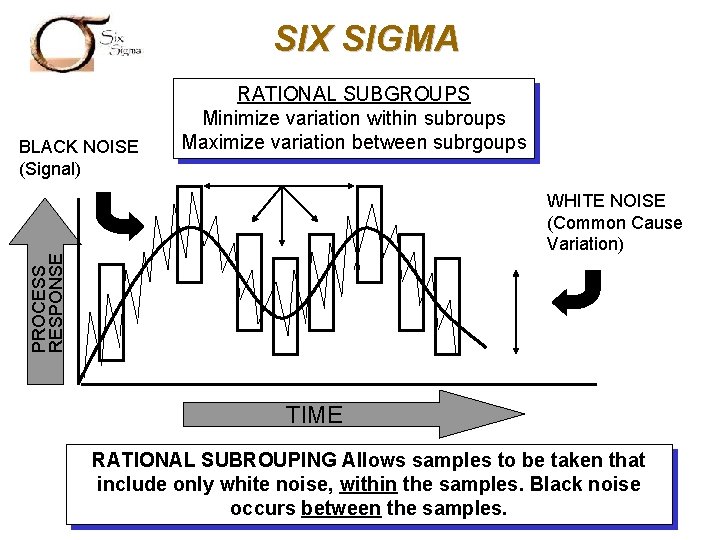
SIX SIGMA BLACK NOISE (Signal) RATIONAL SUBGROUPS Minimize variation within subroups Maximize variation between subrgoups PROCESS RESPONSE WHITE NOISE (Common Cause Variation) TIME RATIONAL SUBROUPING Allows samples to be taken that include only white noise, within the samples. Black noise occurs between the samples.
SIX SIGMA
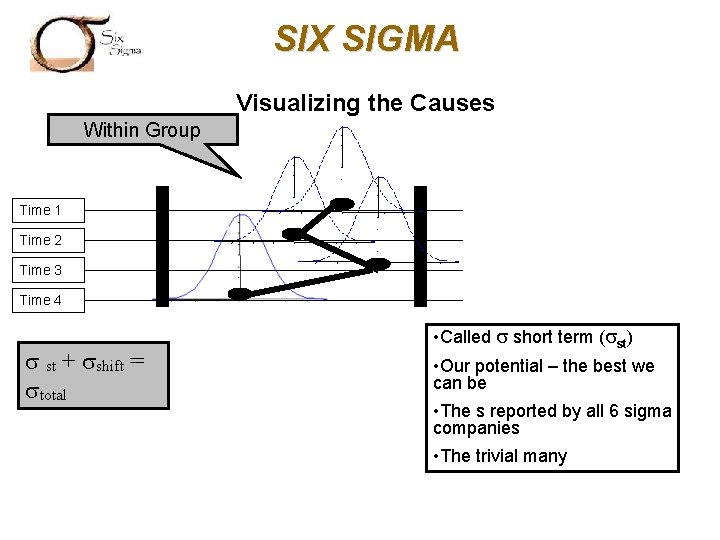
SIX SIGMA Visualizing the Causes Within Group Time 1 Time 2 Time 3 Time 4 s st + sshift = stotal • Called s short term (sst) • Our potential – the best we can be • The s reported by all 6 sigma companies • The trivial many
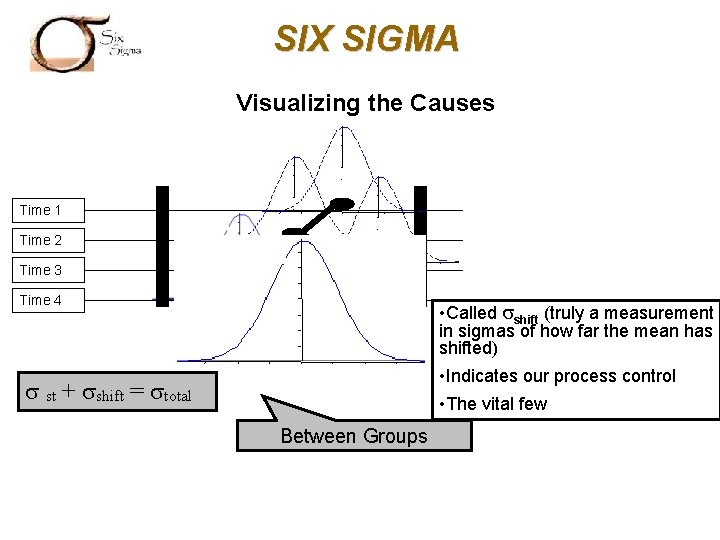
SIX SIGMA Visualizing the Causes Time 1 Time 2 Time 3 Time 4 • Called sshift (truly a measurement in sigmas of how far the mean has shifted) • Indicates our process control s st + sshift = stotal • The vital few Between Groups
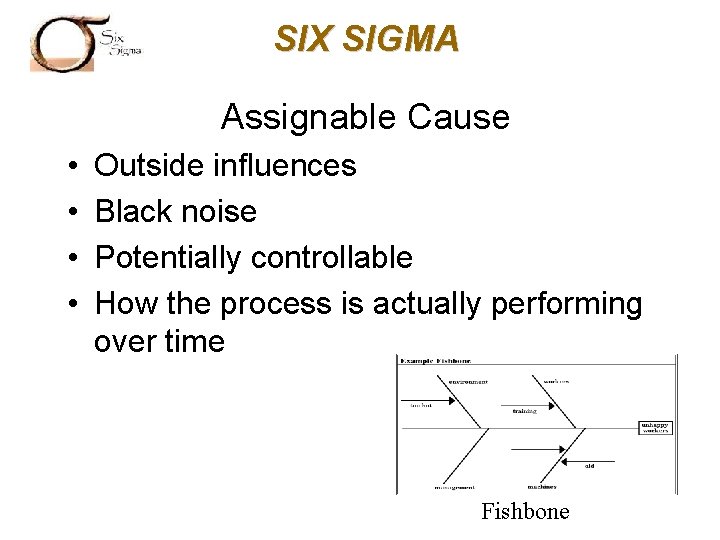
SIX SIGMA Assignable Cause • • Outside influences Black noise Potentially controllable How the process is actually performing over time Fishbone
SIX SIGMA Common Cause Variation • Variation present in every process • Not controllable • The best the process can be within the present technology Data within subgroups (Z. st) will contain only Common Cause Variation
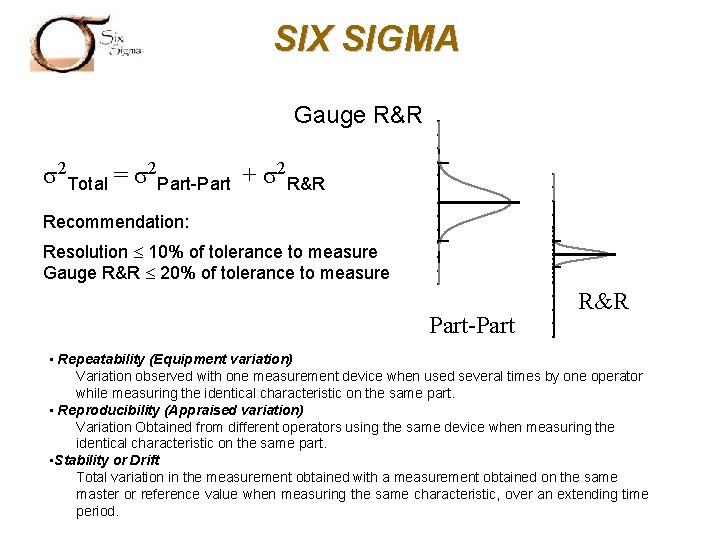
SIX SIGMA Gauge R&R s 2 Total = s 2 Part-Part + s 2 R&R Recommendation: Resolution £ 10% of tolerance to measure Gauge R&R £ 20% of tolerance to measure Part-Part R&R • Repeatability (Equipment variation) Variation observed with one measurement device when used several times by one operator while measuring the identical characteristic on the same part. • Reproducibility (Appraised variation) Variation Obtained from different operators using the same device when measuring the identical characteristic on the same part. • Stability or Drift Total variation in the measurement obtained with a measurement obtained on the same master or reference value when measuring the same characteristic, over an extending time period.
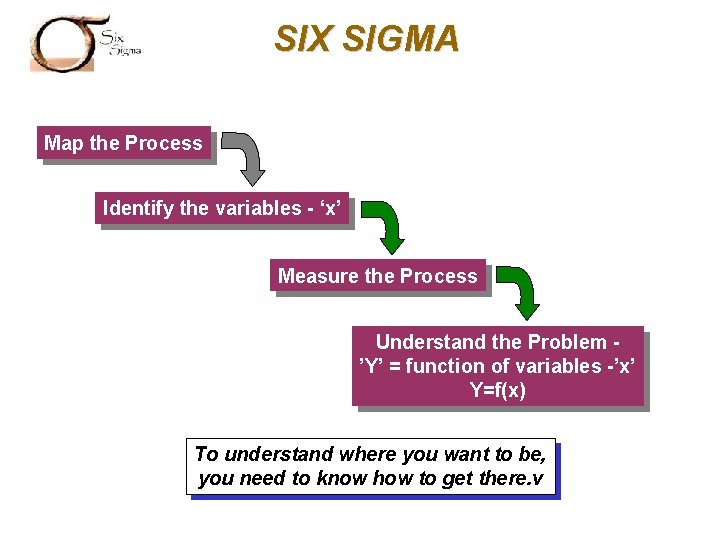
SIX SIGMA Map the Process Identify the variables - ‘x’ Measure the Process Understand the Problem ’Y’ = function of variables -’x’ Y=f(x) To understand where you want to be, you need to know how to get there. v
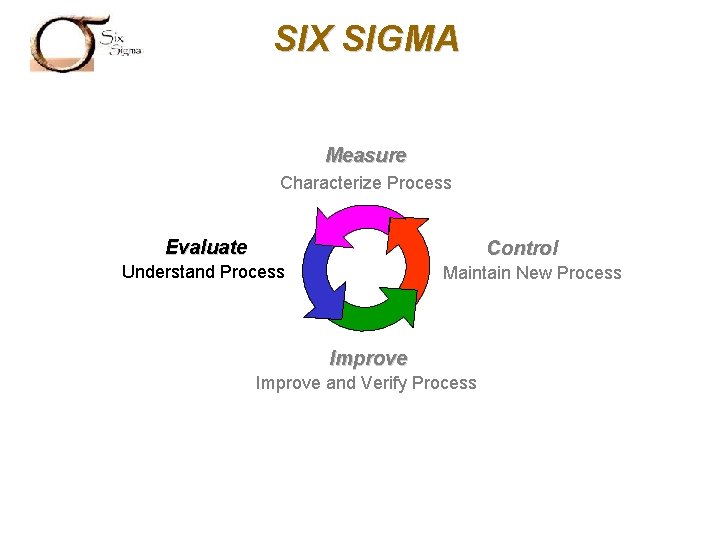
SIX SIGMA Measure Characterize Process Evaluate Control Understand Process Maintain New Process Improve and Verify Process
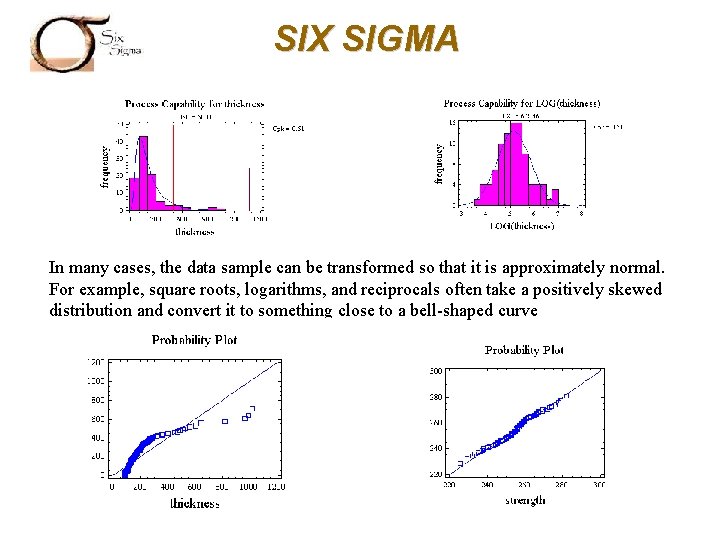
SIX SIGMA In many cases, the data sample can be transformed so that it is approximately normal. For example, square roots, logarithms, and reciprocals often take a positively skewed distribution and convert it to something close to a bell-shaped curve
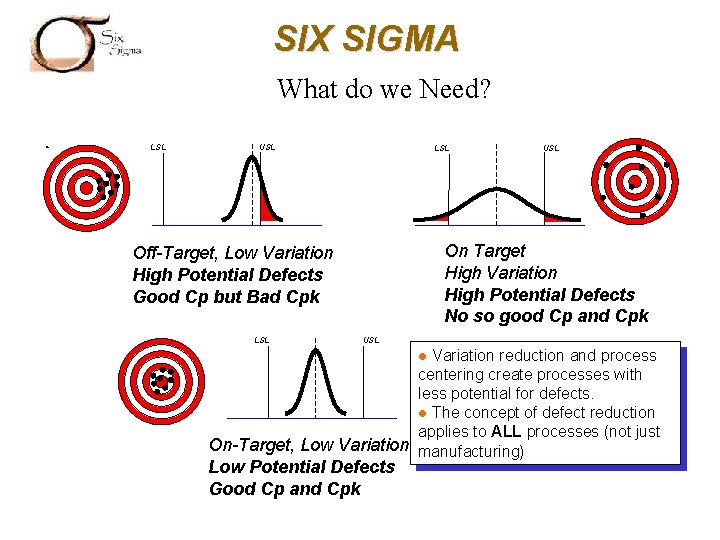
SIX SIGMA What do we Need? LSL USL LSL On Target High Variation High Potential Defects No so good Cp and Cpk Off-Target, Low Variation High Potential Defects Good Cp but Bad Cpk LSL USL Variation reduction and process centering create processes with less potential for defects. l The concept of defect reduction applies to ALL processes (not just On-Target, Low Variation manufacturing) l Low Potential Defects Good Cp and Cpk
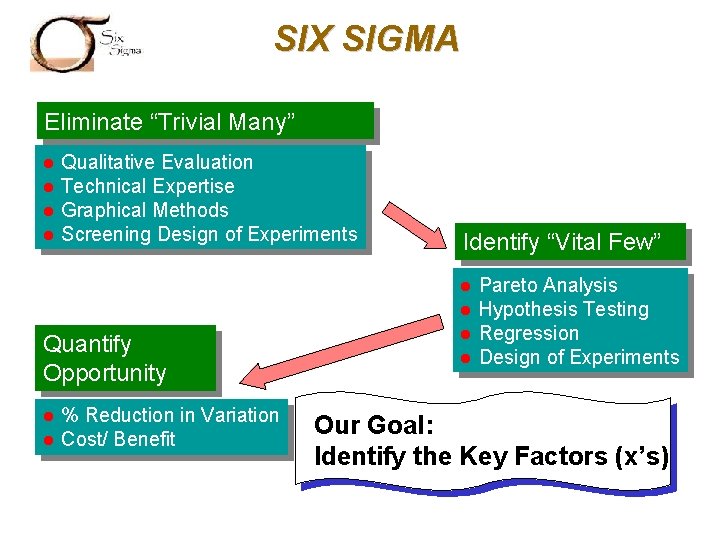
SIX SIGMA Eliminate “Trivial Many” l l Qualitative Evaluation Technical Expertise Graphical Methods Screening Design of Experiments Identify “Vital Few” l l Quantify Opportunity l l % Reduction in Variation Cost/ Benefit l l Pareto Analysis Hypothesis Testing Regression Design of Experiments Our Goal: Identify the Key Factors (x’s)
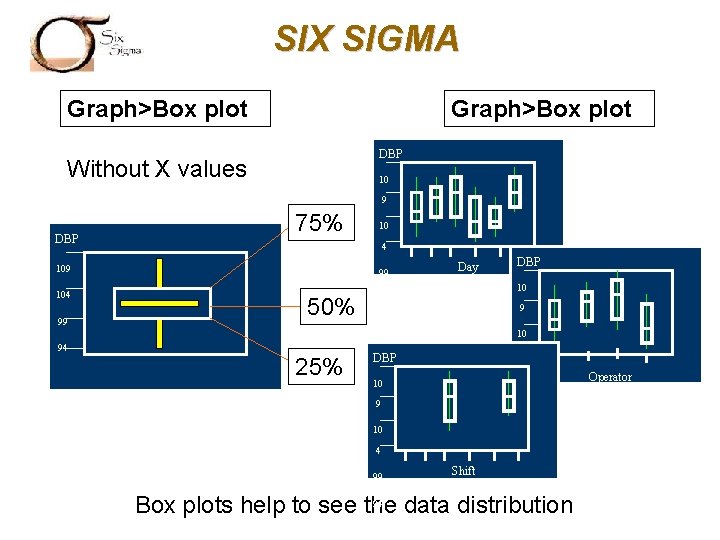
SIX SIGMA Graph>Box plot DBP Without X values 10 9 DBP 75% 4 109 104 99 10 99 Day DBP 10 50% 94 9 10 94 25% DBP 4 10 99 9 94 10 4 99 Shift 94 Box plots help to see the data distribution Operator
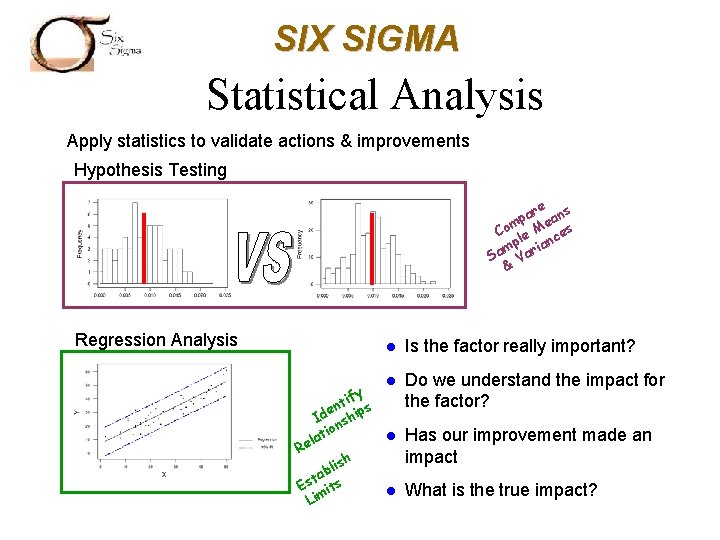
SIX SIGMA Statistical Analysis Apply statistics to validate actions & improvements Hypothesis Testing e ar ans p e m Co le M ces mp arian a S V & Regression Analysis l l y if nt ips e Id nsh tio l a l Re h lis b ta Es its l Lim Is the factor really important? Do we understand the impact for the factor? Has our improvement made an impact What is the true impact?
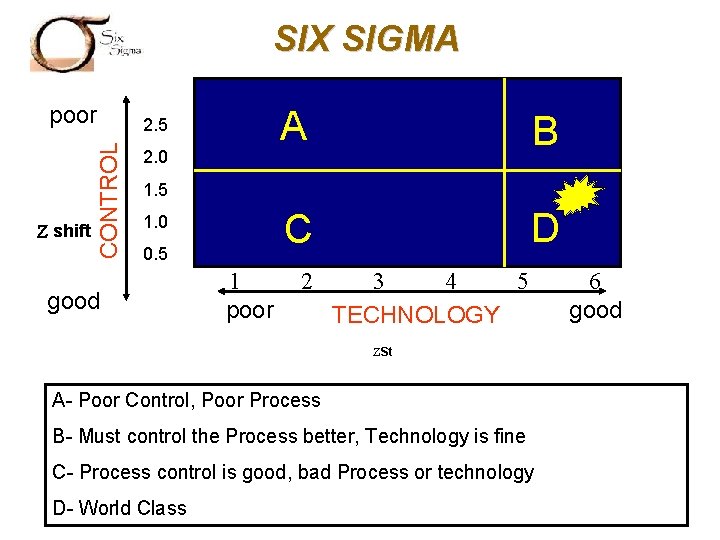
SIX SIGMA Z shift CONTROL poor 2. 5 2. 0 A B C D 1. 5 1. 0 0. 5 good 1 poor 2 3 4 5 TECHNOLOGY ZSt A- Poor Control, Poor Process B- Must control the Process better, Technology is fine C- Process control is good, bad Process or technology D- World Class 6 good
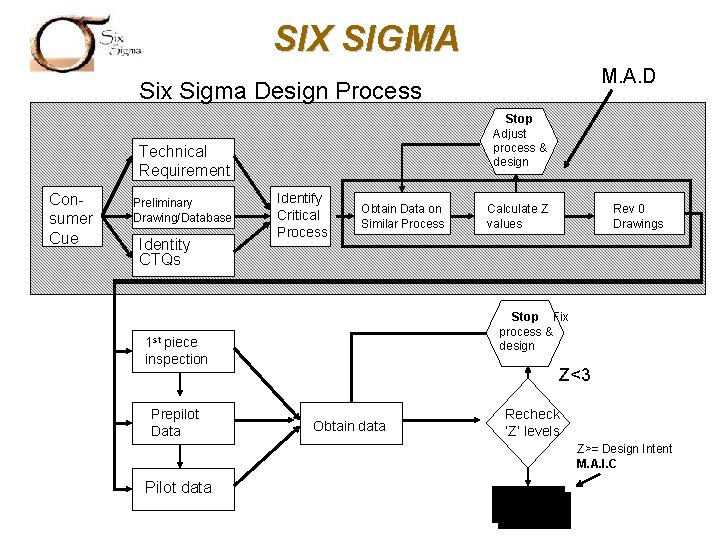
SIX SIGMA M. A. D Six Sigma Design Process Stop Adjust process & design Technical Requirement Consumer Cue Preliminary Drawing/Database Identity CTQs Identify Critical Process Obtain Data on Similar Process Rev 0 Drawings Stop Fix process & design 1 st piece inspection Prepilot Data Calculate Z values Z<3 Obtain data Recheck ‘Z’ levels Z>= Design Intent M. A. I. C Pilot data
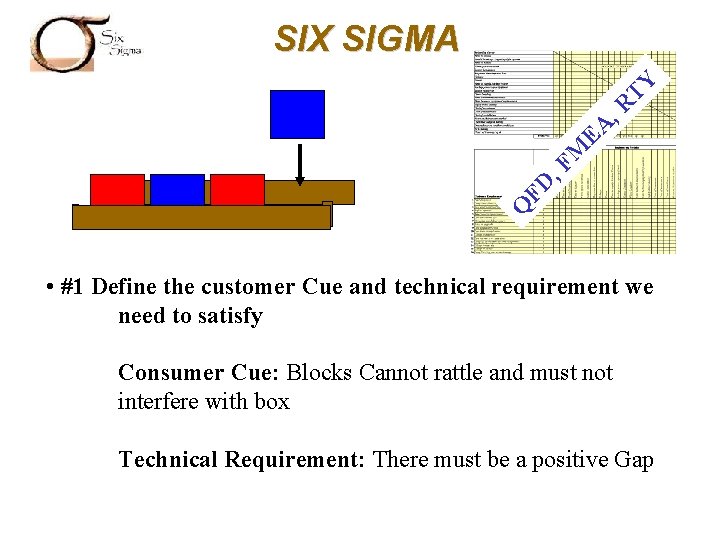
Q FD , F M EA , R TY SIX SIGMA • #1 Define the customer Cue and technical requirement we need to satisfy Consumer Cue: Blocks Cannot rattle and must not interfere with box Technical Requirement: There must be a positive Gap
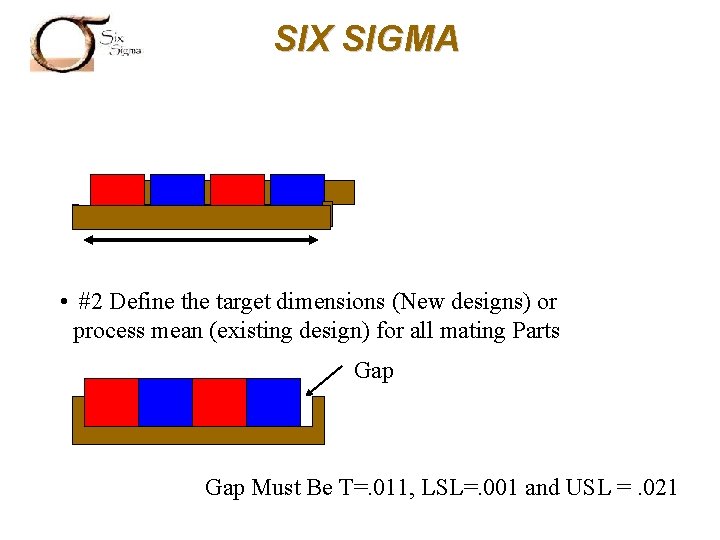
SIX SIGMA • #2 Define the target dimensions (New designs) or process mean (existing design) for all mating Parts Gap Must Be T=. 011, LSL=. 001 and USL =. 021
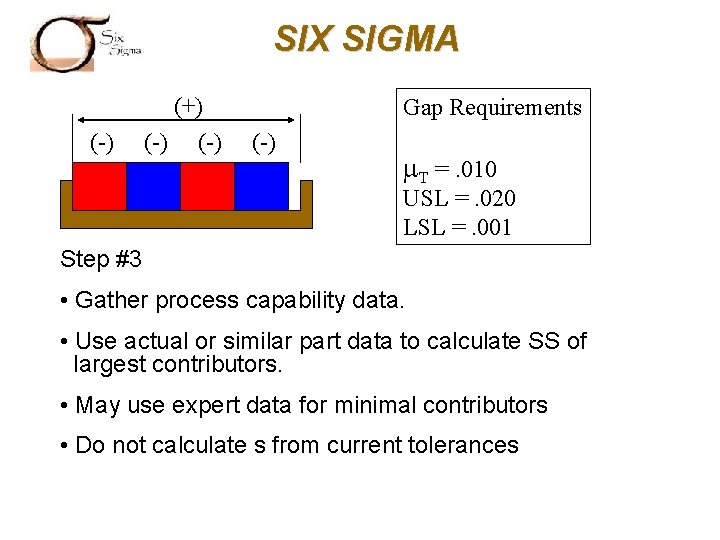
SIX SIGMA (-) (+) (-) Gap Requirements (-) m. T =. 010 USL =. 020 LSL =. 001 Step #3 • Gather process capability data. • Use actual or similar part data to calculate SS of largest contributors. • May use expert data for minimal contributors • Do not calculate s from current tolerances
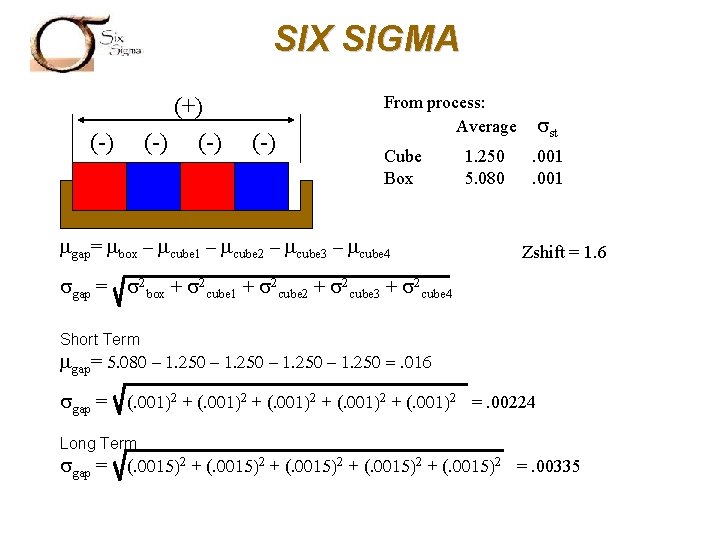
SIX SIGMA (+) (-) (-) From process: Average sst Cube Box . 001 mgap= mbox – mcube 1 – mcube 2 – mcube 3 – mcube 4 sgap = 1. 250 5. 080 Zshift = 1. 6 s 2 box + s 2 cube 1 + s 2 cube 2 + s 2 cube 3 + s 2 cube 4 Short Term mgap= 5. 080 – 1. 250 =. 016 sgap = (. 001)2 + (. 001)2 =. 00224 Long Term sgap = (. 0015)2 + (. 0015)2 =. 00335
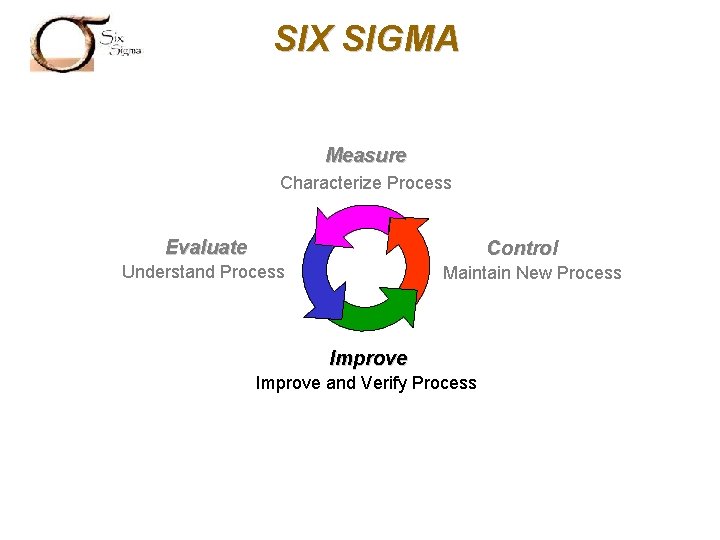
SIX SIGMA Measure Characterize Process Evaluate Control Understand Process Maintain New Process Improve and Verify Process
SIX SIGMA What Do I need to do to improve my Game? 6 GUTTER!
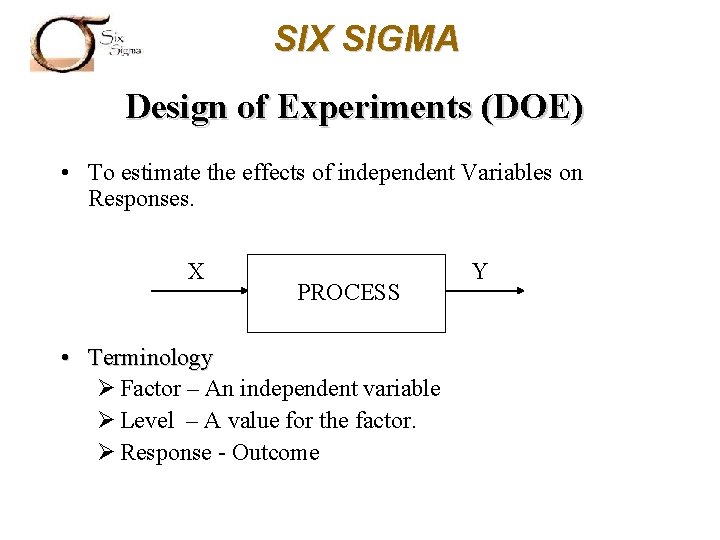
SIX SIGMA Design of Experiments (DOE) • To estimate the effects of independent Variables on Responses. X PROCESS • Terminology Ø Factor – An independent variable Ø Level – A value for the factor. Ø Response - Outcome Y
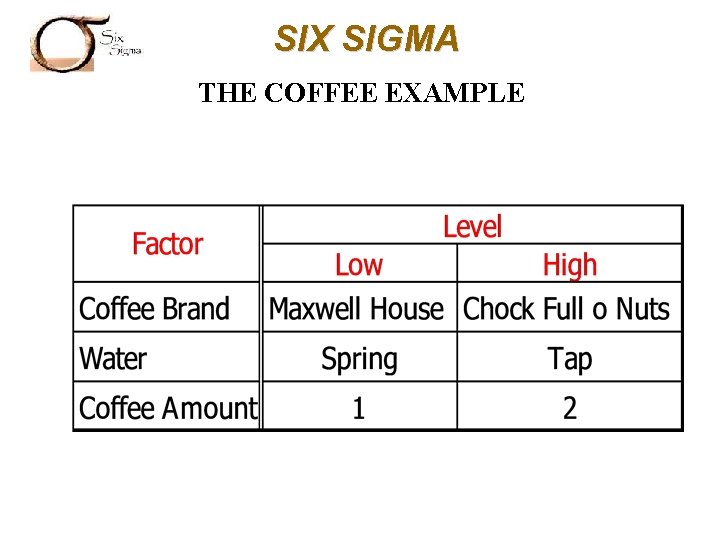
SIX SIGMA THE COFFEE EXAMPLE
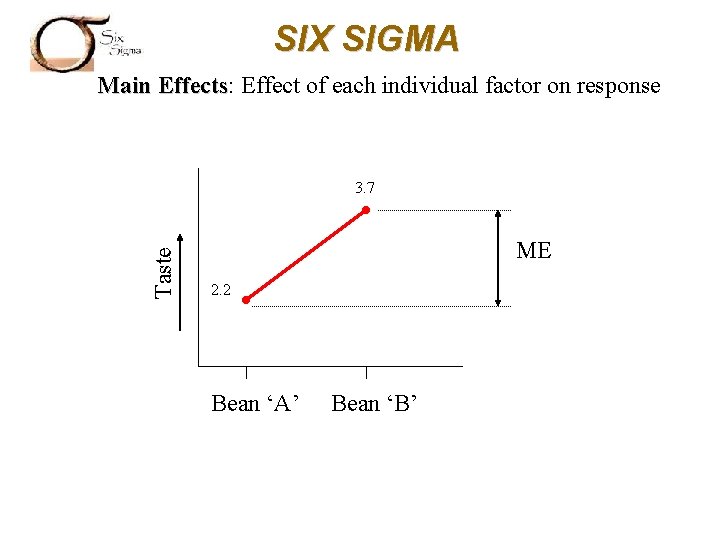
SIX SIGMA Main Effects: Effects Effect of each individual factor on response Taste 3. 7 ME 2. 2 Bean ‘A’ Bean ‘B’
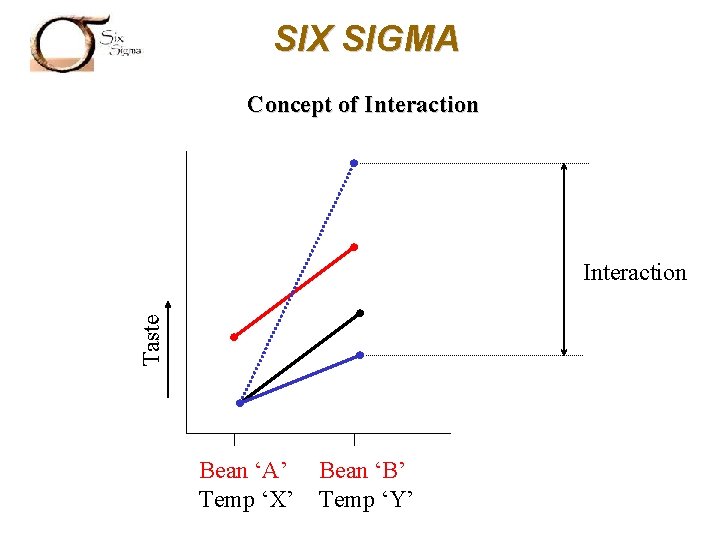
SIX SIGMA Concept of Interaction Taste Interaction Bean ‘A’ Temp ‘X’ Bean ‘B’ Temp ‘Y’
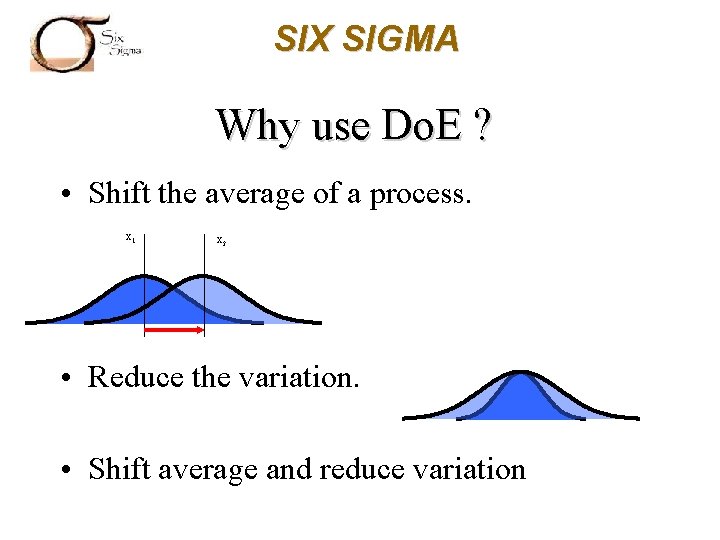
SIX SIGMA Why use Do. E ? • Shift the average of a process. x 1 x 2 • Reduce the variation. • Shift average and reduce variation
SIX SIGMA Do. E techniques • Full Factorial. 4 Ø 2 = 16 trials Ø 2 is number of levels Ø 4 is number of factors • All combinations are tested. • Fractional factorial can reduce number of trials from 16 to 8.
SIX SIGMA Do. E techniques…. contd. • Fractional Factorial • Taguchi techniques • Response Surface Methodologies • Half fraction
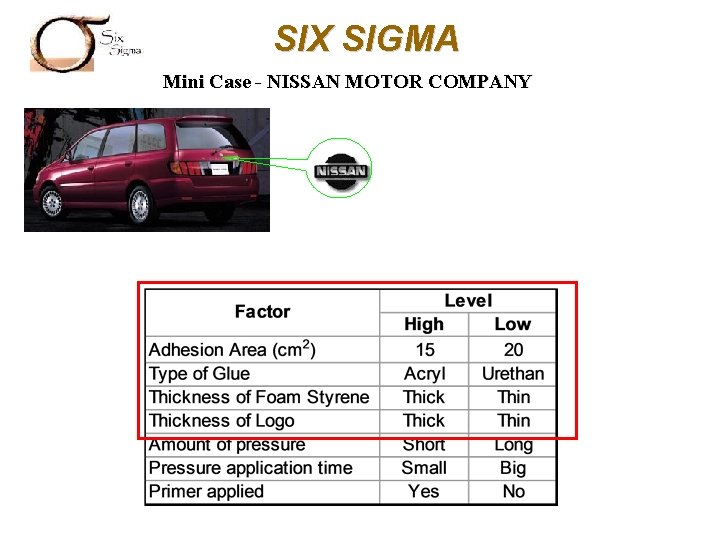
SIX SIGMA Mini Case - NISSAN MOTOR COMPANY
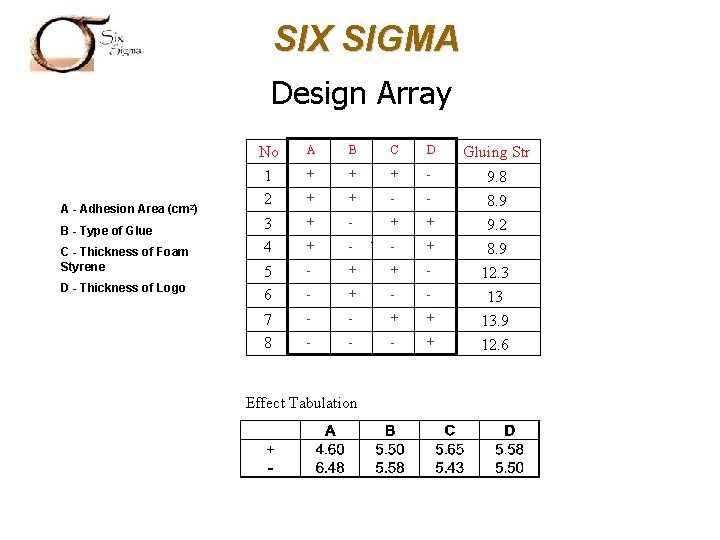
SIX SIGMA Design Array A - Adhesion Area (cm 2) B - Type of Glue C - Thickness of Foam Styrene D - Thickness of Logo No 1 2 A B C D Gluing Str + + + - - 3 4 + - + + + - - + 5 6 - + + - - 7 8 - - + + - - - + 9. 8 8. 9 9. 2 8. 9 12. 3 13 13. 9 12. 6 Effect Tabulation `
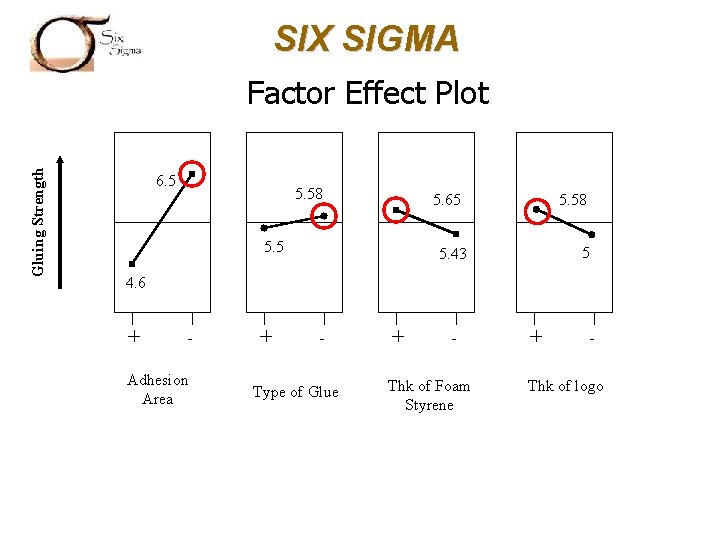
SIX SIGMA Gluing Strength Factor Effect Plot 6. 5 5. 58 5. 65 5. 58 5 5. 43 4. 6 + - Adhesion Area + - Type of Glue + - Thk of Foam Styrene + - Thk of logo
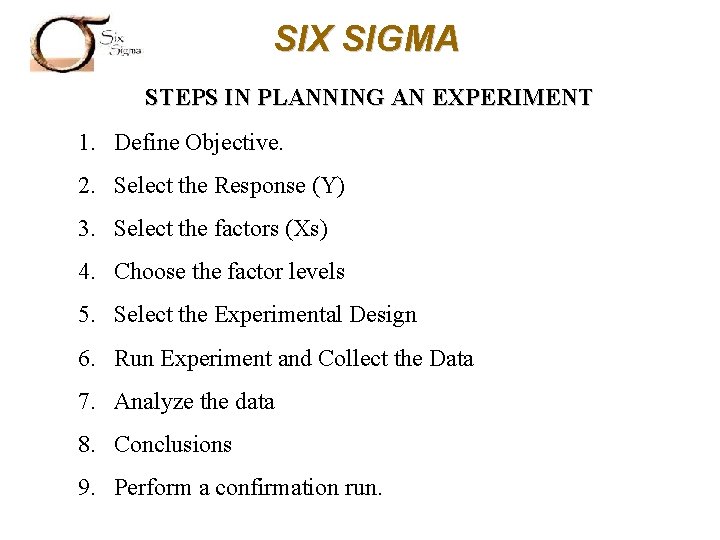
SIX SIGMA STEPS IN PLANNING AN EXPERIMENT 1. Define Objective. 2. Select the Response (Y) 3. Select the factors (Xs) 4. Choose the factor levels 5. Select the Experimental Design 6. Run Experiment and Collect the Data 7. Analyze the data 8. Conclusions 9. Perform a confirmation run.
SIX SIGMA “…. No amount of experimentation can prove me right; a single experiment can prove me wrong”. “…. Science can only ascertain what is, but not what should be, and outside of its domain value judgments of all kinds remain necessary. ” - Albert Einstein
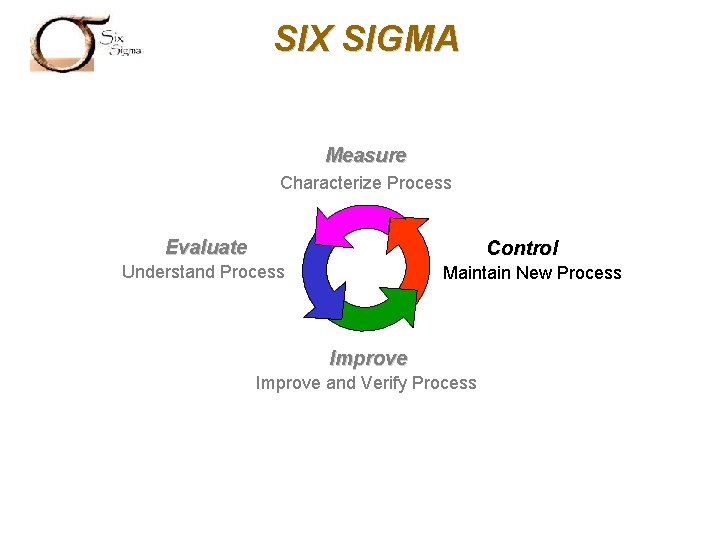
SIX SIGMA Measure Characterize Process Evaluate Control Understand Process Maintain New Process Improve and Verify Process
SIX SIGMA CONTROL PHASE - SIX SIGMA Control Phase Activities: -Confirmation of Improvement -Confirmation you solved the practical problem -Benefit validation -Buy into the Control plan -Quality plan implementation -Procedural changes -System changes -Statistical process control implementation -“Mistake-proofing” the process -Closure documentation -Audit process -Scoping next project
SIX SIGMA CONTROL PHASE - SIX SIGMA How to create a Control Plan: 1. Select Causal Variable(s). Proven vital few X(s) 2. Define Control Plan - 5 Ws for optimal ranges of X(s) 3. Validate Control Plan - Observe Y 4. Implement/Document Control Plan 5. Audit Control Plan 6. Monitor Performance Metrics
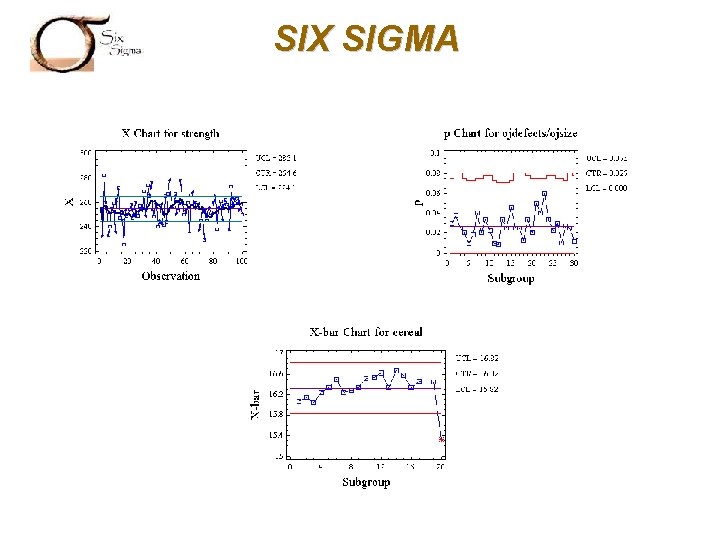
SIX SIGMA CONTROL PHASE - SIX SIGMA Control Plan Tools: 1. Basic Six Sigma control methods. - 7 M Tools: Affinity diagram, tree diagram, process decision program charts, matrix diagrams, interrelationship diagrams, prioritization matrices, activity network diagram. 2. Statistical Process Control (SPC) - Used with various types of distributions - Control Charts • Attribute based (np, p, c, u). Variable based (X-R, X) • Additional Variable based tools -PRE-Control -Common Cause Chart (Exponentially Balanced Moving Average (EWMA))
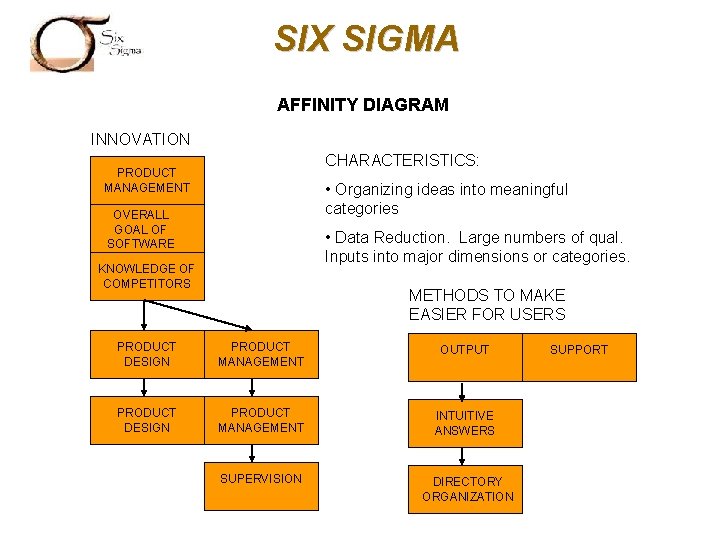
SIX SIGMA AFFINITY DIAGRAM INNOVATION CHARACTERISTICS: PRODUCT MANAGEMENT • Organizing ideas into meaningful categories OVERALL GOAL OF SOFTWARE • Data Reduction. Large numbers of qual. Inputs into major dimensions or categories. KNOWLEDGE OF COMPETITORS METHODS TO MAKE EASIER FOR USERS PRODUCT DESIGN PRODUCT MANAGEMENT OUTPUT PRODUCT DESIGN PRODUCT MANAGEMENT INTUITIVE ANSWERS SUPERVISION DIRECTORY ORGANIZATION SUPPORT
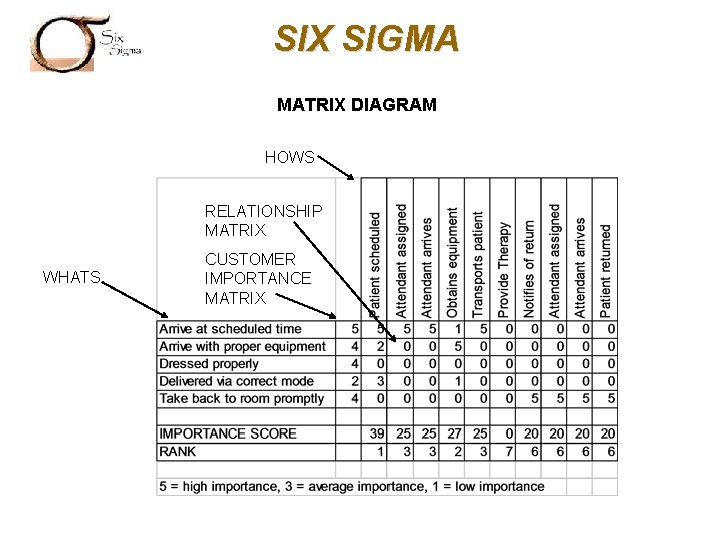
SIX SIGMA MATRIX DIAGRAM HOWS RELATIONSHIP MATRIX WHATS CUSTOMER IMPORTANCE MATRIX
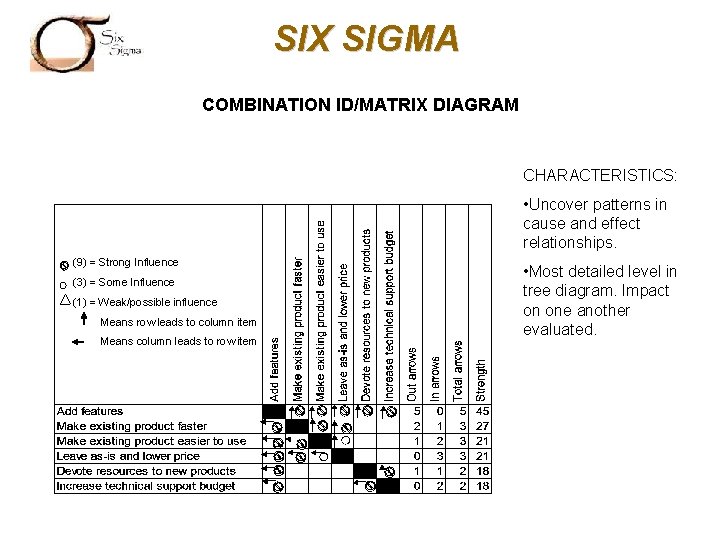
SIX SIGMA COMBINATION ID/MATRIX DIAGRAM CHARACTERISTICS: • Uncover patterns in cause and effect relationships. (9) = Strong Influence (3) = Some Influence (1) = Weak/possible influence Means row leads to column item Means column leads to row item • Most detailed level in tree diagram. Impact on one another evaluated.
SIX SIGMA CONTROL PHASE - SIX SIGMA Control Plan Tools: 1. Basic Six Sigma control methods. - 7 M Tools: Affinity diagram, tree diagram, process decision program charts, matrix diagrams, interrelationship diagrams, prioritization matrices, activity network diagram. 2. Statistical Process Control (SPC) - Used with various types of distributions - Control Charts • Attribute based (np, p, c, u). Variable based (X-R, X) • Additional Variable based tools -PRE-Control -Common Cause Chart (Exponentially Balanced Moving Average (EWMA))
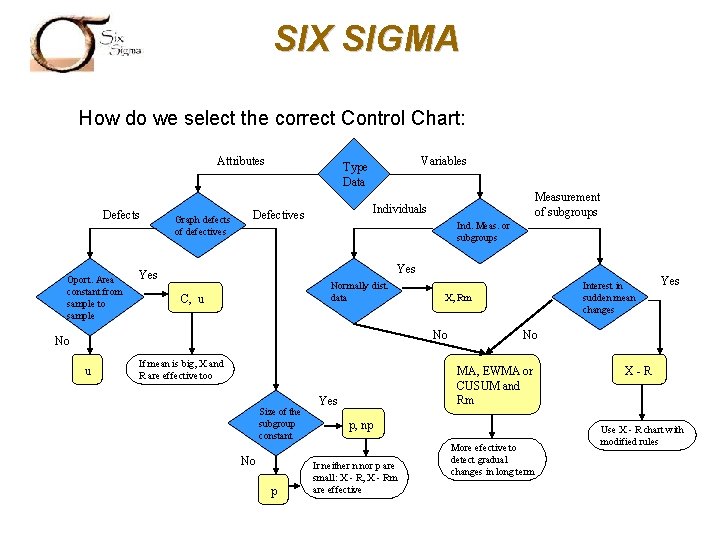
SIX SIGMA How do we select the correct Control Chart: Attributes Defects Oport. Area constant from sample to sample Graph defects of defectives Variables Type Data Measurement of subgroups Individuals Defectives Ind. Meas. or subgroups Yes Normally dist. data C, u X, Rm No No u If mean is big, X and R are effective too Size of the subgroup constant No p Interest in sudden mean changes No MA, EWMA or CUSUM and Rm Yes p, np Ir neither n nor p are small: X - R, X - Rm are effective Yes More efective to detect gradual changes in long term X-R Use X - R chart with modified rules
SIX SIGMA
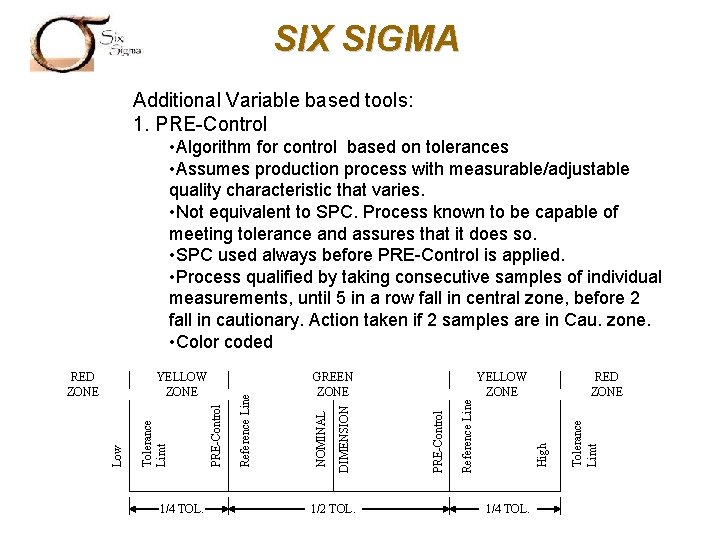
SIX SIGMA Additional Variable based tools: 1. PRE-Control 1/4 TOL. 1/2 TOL. 1/4 TOL. Tolerance Limt RED ZONE High Reference Line YELLOW ZONE PRE-Control DIMENSION GREEN ZONE NOMINAL PRE-Control Tolerance Limt YELLOW ZONE Low RED ZONE Reference Line • Algorithm for control based on tolerances • Assumes production process with measurable/adjustable quality characteristic that varies. • Not equivalent to SPC. Process known to be capable of meeting tolerance and assures that it does so. • SPC used always before PRE-Control is applied. • Process qualified by taking consecutive samples of individual measurements, until 5 in a row fall in central zone, before 2 fall in cautionary. Action taken if 2 samples are in Cau. zone. • Color coded
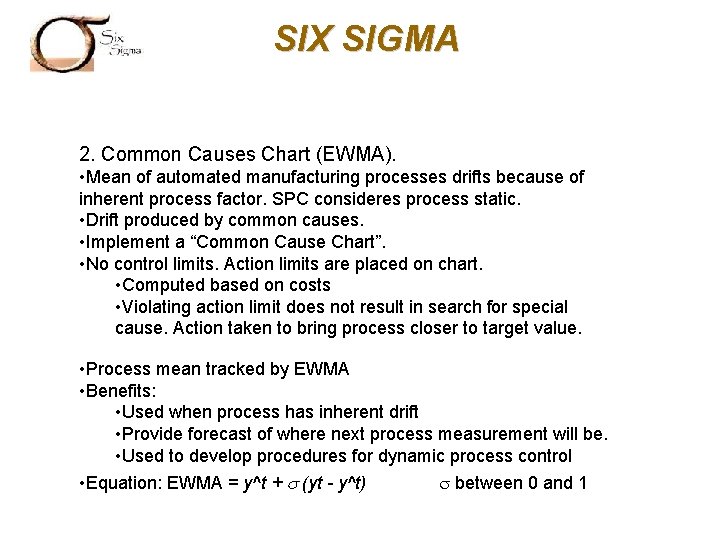
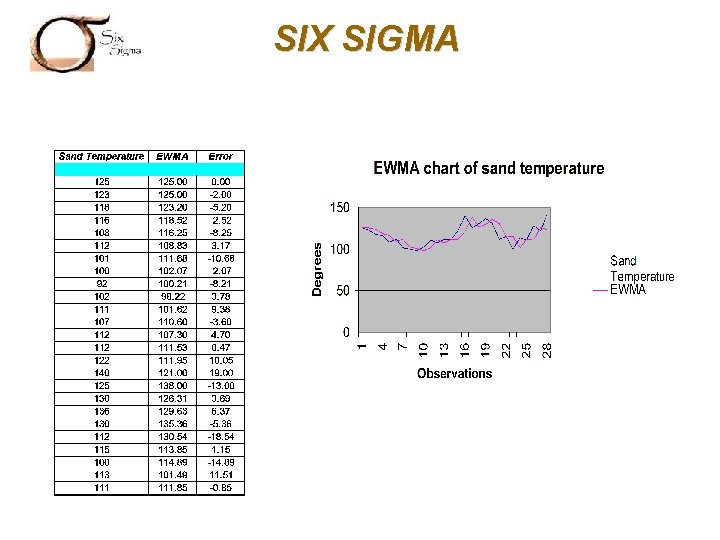
SIX SIGMA 2. Common Causes Chart (EWMA). • Mean of automated manufacturing processes drifts because of inherent process factor. SPC consideres process static. • Drift produced by common causes. • Implement a “Common Cause Chart”. • No control limits. Action limits are placed on chart. • Computed based on costs • Violating action limit does not result in search for special cause. Action taken to bring process closer to target value. • Process mean tracked by EWMA • Benefits: • Used when process has inherent drift • Provide forecast of where next process measurement will be. • Used to develop procedures for dynamic process control • Equation: EWMA = y^t + s (yt - y^t) s between 0 and 1
SIX SIGMA
SIX SIGMA Project Closure • Improvement fully implemented and process re-baselined. • Quality Plan and control procedures institutionalized. • Owners of the process: Fully trained and running the process. • Any required documentation done. • History binder completed. Closure cover sheet signed. • Score card developed on characteristics improved and reporting method defined.
SIX SIGMA Motorola ROI 1987 -1994 • Reduced in-process defect levels by a factor of 200. • Reduced manufacturing costs by $1. 4 billion. • Increased employee production on a dollar basis by 126%. • Increased stockholders share value fourfold. Allied. Signal ROI 1992 -1996 • $1. 4 Billion cost reduction. • 14% growth per quarter. • 520% price/share growth. • Reduced new product introduction time by 16%. • 24% bill/cycle reduction.
SIX SIGMA General Electric ROI 1995 -1998 • Company wide savings of over $1 Billion. • Estimated annual savings to be $6. 6 Billion by the year 2000.
SIX SIGMA Bibliography • Control Engineering On line, “Design for Six Sigma Capability” http: //www. controleng. com/, 1999 • Forrest W. Breyfogle III, “Implementing Six Sigma”, John Wiely & Sons, Inc, 1999 • Infinity Performance Systems, “Six Sigma Overview”, http: //www. 6 sigmaworld. com/six_sigma. htm, 2000 • Motorola Inc. , “What is 3 vs. 6 sigma”, http: //www. Motorola. com/MIMS/MSPG/Special/CLM/sld 011. htm, 1997 • Sigma Holdings, Inc. , “Six Sigma Breakthrough Strategy”, http: //www. 6 -sigma. com/Bts 1. htm, 2000 • Six Sigma SPC / Jim Winings, “Six Sigma & SPC”, http: //www. sixsigmaspc. com/six_sigma. html, 2001 • Stat. Point, LLC. “Six Sigma Tour”, http: //www. sgcorp. com/six-sigma_tour. htm, 2001
- Slides: 84