Lara Owens Katie Strass Amish Shah Jennifer Holzhauser


 P type Chart from http: //www. hartnell. cc. ca. us/faculty/scharnic/periodictable. html")


 Ú uses the")
 Ú Low to moderate temperatures resources Ú Ú – (90˚-150˚")
")


 –")


 n Proton Exchange Membrane")


 Large: 50 to 750")


 Ú Scientists have agreed that Global")


 Ú Animal waste – Manure, bedding from")


")


 – wood and agricultural residues, but most from natural")
 converting starch to sugar → fermenting sugar to alcohol")


- Slides: 150
Lara Owens Katie Strass Amish Shah Jennifer Holzhauser
Are We Running out of Energy/Resources?
The United States Energy Policy
Solar Energy http: //www. singleton. nsw. gov. au/ visitors/profilepubfacpower. html http: //www. turner. com/planet/ static/captain. html
Solar Energy Issues to consider: What is it? How does it work? Is it useful? What does it cost? When/Where to use? http: //www. turner. com/planet/ static/captain. html
Solar Energy Ú Energy from the sun Ú Collected and stored by many means Ú Plant life, wind, water Ú Passive and active systems
Solar Energy Ú Sun loses mass ~ 4 million tons / second Ú (English or Metric units? ) Ú Theoretical max energy converted from mass through fusion process: Ú E = mc 2 Ú Energy = (3. 6 x 10⁹ kg)(2. 998 m/sec)2 Ú ~ a very big number
Problem Ú Less than one-billionth actually reaches earth Ú ~ 5. 5 x 1024 Joules Smil, Vaclav. Energies
Solar Energy Ú The sun can provide about 1 k. W/m 2 on a perfectly clear day on earth Ú Clouds, dust, and particles can reflect 80% of the Sun’s radiation (Commoner, 126) Ú (Mostly visible light reaches surface) Ú 99% is converted to heat http: //www. iclei. org/EFACTS/PASSIVE. HTM
Average Solar Energy in U. S.
Brief History Is that the new Mach 3 triple blade razor? Word up! Shave up or Down! Ú The use of the Sun as a source of power has been used for thousands of years. The Sun protects me from Rickets!
Water Desalination ÚCan produce drinking water from saltwater Ú 100 € per cubic metre. 4. 06 € per cubic metre Ú using Rosendahl's solar water treatment with flat collectors. http: //www. mueller-solartechnik. de /desa_eng. htm#beispiele
Solar Engine Ú In 1860, Auguste Mouchout, a math teacher at Lyce de Tours, decided to build a solar motor due to his belief that coal would be exhausted. Ú In 1861, he received a patent for his solar engine. The engine trapped solar radiation in a glass-covered iron box which boiled water to create pressurized steam. Ú By 1872, his refined engine had a max power of ½ horsepower (about 370 Watts). Ú In 1878, William Adams produced a 2. 5 hp solar engine, although he lacked skills to create a business. http: //www. solarenergy. com/info_history. html
Solar Engine Ú Aubrey Eneas formed the Solar Motor Co. in 1900. Ú He utilized a parabolic mirror, which heated boiled water to steam, which pumped 1400 gallons of water per minute for irrigation. Ú Although a major milestone for solar energy, the system was eventually a business failure.
Solar Engine Ú In 1904, Henry Willsie built a 15 hp solar engine which collected and stored solar power as heated water, which could be used to run the engine during the night. Ú (It too, was a business failure). Ú In 1912, Frank Shurman’s solar irrigation plant could generate more than 55 hp. Ú Unfortunately combat in WW 1 destroyed his plant in Cairo, Egypt and he soon died a few years later
Late History Ú In 1900’s inexpensive fossil fuels dominated energy useage. Ú Solar electricity emerged in the 2 nd half of the 20 th century as an unlimited source for satellites in outer space. Ú In 1970’s, oil embargo forces America to consider renewable energies. Ú In 1996, solar energy was used to heat swimming pools for Olympics.
Forms of Solar Energy Ú Natural Systems Ú Photosynthesis Plants Convert Solar Energy Produce Fossil fuels Animals eat Plants, Humans burn wood Plants & Animals die And decay Humans Eat Animals & Plants
Hydro Power Ú Water evaporates to higher elevations Ú Potential energy http: //www. hooverdam. com
Passive Solar Systems Ú Structure with windows facing sun Ú Standard windows not enough insulation Ú Provides light and Ú Greenhouse-like heat
Passive Cooling and Heating
Passive Solar Systems
Active Solar Energy Ú Have moving parts and/or controls Ú Use a coolant to transfer energy from collector to point of use Ú (Cassedy, Introduction to Energy, 11) Ú Used for hot water heating, space, heating, cooling, and generation of electricity
Mirrors Ú Sun can be concentrated with parabolic mirrors Ú Boils water or another liquid Ú Least expensive solar solution Ú Cool Fact: Surface of Sun 10, 000 o. F Ú French Solar Furnace in Pyrenees 6000 o. F
Photovoltaic Cells Ú Companies are working to build 10 MW modules to produce electricity at 12 to 15 cents per k. Wh. The Energy Sourcebook, 176 Ú Currently used for some applications calculators, radios, outdoor home lighting Ú Also used to pump water, supply heat and electricity to remote homes and communities Ú Electricity for satellites
PV Cells Ú Electromagnet radiation excites electrons and forces movement Ú Many different types of cells Ú Each type of cell can only absorb a select range of frequencies of light
4+/- charge (stable) P type Chart from http: //www. hartnell. cc. ca. us/faculty/scharnic/periodictable. html N type
PV Cells Ú One layer is doped with a group 3 element Ú Other layer is doped with a group 5 element Ú P-type layer has “holes” that travel through the semiconductor to be filled by electrons, which creates a hole in a different part.
PV Cells Ú PV cells absorb a selected range frequencies of light, decided by desired voltage and current Ú Proposals to absorb more light: – Multilayered PV cells – Using different materials – Different crystal structures
Facts PV cells will cost 30 -40 cents per k. Wh n Current energy costs 3. 4 – 6. 3 cents / k. Wh n http: //www. swenergy. org/factsheets/UTfactsheet. pdf 10 to 20 % efficient n “Solar energy accounts for 1 percent of renewable electricity generation and 0. 02 percent of total U. S. electricity supply n n n National Energy Policy, May 2001 Report of the National Energy Policy Development Group
Goals Ú Production increases from 2 MW in 1976 to 288 MW in 2000 (Vital Signs 2002) Ú For 2010 to 2030: Ú An optimistic price of 6 - 10 cents per k. Wh Ú Systems currently last 20 to 30 years Ú Systems will last > 30 years Ú Renewable Power Pathways, 66 Ú 15 to 30 % efficiencies
Facts Ú Solar technology is emission free Ú Can be installed on existing buildings for heating and electricity Ú Passive solar systems can save up to 50% on heating costs (http: //www. solaraccess. com/education/solar. jsp? id=passive) Ú Like other technologies, will be cheaper when mass produced
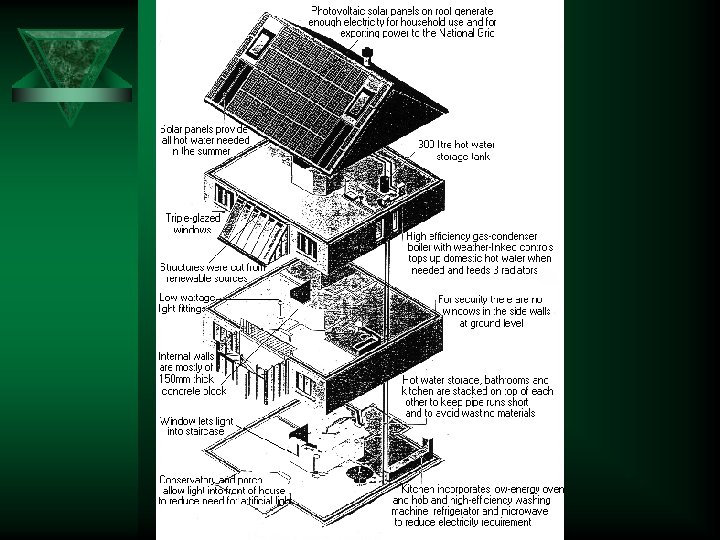
Case Study Ú The Oxford Solar house Ú Energy needs provided by solar cells in daytime Ú Built for efficiency http: //www. tve. org/ho/doc. cfm ? aid=224&lang=English
Facts and Figures Ú Costs of PV system: £ 21, 150 Ú Energy Consumption: 2964 k. Wh / year Ú Owner buys from utilities : 1524 k. Wh / year Ú But owner sells to utilities: 1692 k. Wh / year Ú She pays £ 0. 070 / k. Wh £ 106. 60 Ú She earns £ 0. 027 / k. Wh £ 45. 60 Ú She pays £ 61. 00 for consuming 2964 k. Wh Ú $94. 86 Ú This includes charging the electric car!
Hydropower Utility/Industrial hydro Small scale hydro
History Ancient Greeks used water power 2000 years ago. n American and European industries used the water wheel to power machines. n First hydro plant was built at Niagara Falls n 80, 000 dams in U. S. , but only 3% are used for electricity generation n
Hydroelectric Power n What is it? n n Conversion from kinetic energy of water to mechanical energy to electrical energy. Hydropower plants dam a flowing body of water The water is then stored reservoir. When the water is released from the reservoir, it flows through a turbine, causing it to spin and activating a generator to produce electricity.
How it works n n n n A dam blocks the water, holds it in a reservoir. Pipes called the penstock bring water from the reservoir to the powerhouse. The drop in elevation in the penstock is call the “head. ” The force created is the force need to create electricity. Higher volume of water and a higher force of the head create a greater amount of energy. The powerhouse contain the turbines. The turbines move from the force of the head as it flows down the penstock. The rotating turbines turn a shaft that drives generators that produce electricity. Water not used for producing energy is released over the spillway of the dam. ” http: //www. eere. energy. gov/state_energy/technology_overview. cfm? techid=7
Hydo power conversion process
Dams aren’t always necessary Some hydro power comes from channeling a portion of the river into a canal. n The water would then be pumped into a holding area. n When it is released, the generator housed in the canal would generate electricity. n
How much does PA use? n PA uses very little,
Energy Potential The U. S. is the 2 nd largest producer and consumer of hydo power in the world. (Canada is the first) n In the early 1900’s hydro power generated around 40% of the nation’s electrical needs. n n 1/10 of the nation’s energy. 81% of renewable energy generated n Large dams can generate 10, 000 MW n In PA. 5, 525, 646 MWh capacity n n Only about 3%
Viable Conditions High volume of moving water. n Change in elevation gradient. n Mississippi isn’t great although it has a large volume of water. n Mountain regions would be good, because of the drastic drop in elevation n Washington, Oregon, and California have the most hydo power. n
Economics of Hydro Power It is the cheapest form of renewable energy presently used in the U. S. n 85 -92% efficient n Washington and Oregon get 85% each year… efficient and cheap n Only 0. 6 cents is needed to pay for operating and maintaining the plant. n 2. 2 cents/k. Wh at nuclear plants n 2. 1 cents/k. Wh at coal plants. n
Economics Continued n n Hydropower is the cheapest way to generate electricity today. dependable and long-lived n n maintenance costs are low compared to coal or nuclear plants In 1994 it cost less than one cent per k. Wh (kilowatthour) to produce electricity at a typical hydro plant. n Hydro power costs 6 cents per k. Wh n http: //lsa. colorado. edu/essence/texts/hydropower. htm
World Values n 650, 000 MW installed across the world n 135, 000 are currently being installed n http: //www. damsreport. org/docs/kbase/contrib/eco 078. p df Operating life 50+ years n Capacity factor 31 MW n
How we will combat current problems? n n n “installing fish ladders to allow fish to migrate upstream to their spawning grounds; modifying turbine designs to reduce fish mortality and detrimental effects to water quality (for example, by changing the concentration of dissolved gases); and regulating water levels to provide suitable conditions for the downstream migration of young fish and to provide wildlife habitat for waterfowl. ” http: //www. eere. energy. gov/state_energy/technology_overview. cfm? techid=7
Benefits of Hydro Power 300 billion kilowatt-hours of electricity are produced in the U. S. each year n 160 million tons of coal would be required to generate that same amount. n No discharge of pollutants into the environment. n Existing dams used for flood control can be converted into hydro dams. n
Hydo – NO! Ú Valuable assets to the land are destroyed. Ú Changes in turbidity, water temperature, concentration of gases and nutrients. Ú Potential farmland, habitat, and native vegetation are lost. Ú Not all developers have an sense of intrinsic value. – historic and cultural sites; fisheries; wildlife habitat; legal issues; and geologic, recreational, or scenic attributes.
Future Problems Ú As the climate changes what could happen with hydro power? – Problems with precipitation flux can eliminate once viable hydo sources. – Low reservoir levels could lead to disease breeding – High fish deaths!- kills the industry – Continual erosion will lead to silt deposition against the dam – shortens life expectancey – Snow pack melt • High/ Low
Geothermal Tapping in…
Geothermal Energy geothermal energy = energy derived from the natural heat of the earth Ú Heat contained in the rock and fluid, derived from radioactive decay deep in earth Ú Certain geologic processes allow us to “tap” the heat in a less diffused state – – – Geysers Hot springs Thinned continental crust Rift systems Volcanic regions
Geothermal Resources Ú Depends upon the fluid phase Ú hydrothermal resources – vapor-dominated reservoirs (steam only) – liquid-dominated reservoirs (steam and water, or water only) Ú Hot Dry Rock (HDR) – No water, just hot, deep-seated rock
Geothermal Resources Ú Geothermal resources are classified by temperature: – low temperature • (less than 90°C or 194°F) – moderate temperature • (90°C - 150°C or 194 - 302°F) – high temperature • (greater than 150°C or 302°F).
Direct Use Ú Low to moderate temperature resources – (>20˚-150˚ C) Ú uses the heat in the water directly without a heat pump or power plant Ú Applications Greenhouses and aquaculture: http: //www. eere. energy. gov/geothermal/geodirectuse. html
Ground-Source Heat Pumps (GHP) Ú Low to moderate temperatures resources Ú Ú – (90˚-150˚ C) Uses more diffuse heat from the very shallow subsurface with underground or underwater pipe systems Cooling and Heating (sink and source) Heat exchanger uses long pipes in vertical well bores (400 ft/ton capacity) or deep horizontal trenches (800 ft/ton capacity) Applications
Geothermal Power Generation Ú Requires moderate to high temperature gradients (> 180 ºC ) Ú Presently generates 2700 megawatts (MW) of electric power in US per year Ú 3 rd largest renewable source Ú No hidden cost for clean-up or waste disposal
Dry Steam Power Plant Ú first type of geothermal power generation plants built Ú Steam extracted from the geothermal reservoir through well Ú Routed directly through turbine/generator units to produce electricity Ú Geysers and hotsprings http: //www. eere. energy. gov/geothermal/geopowerplants. html
Flash Steam Power Plants Ú Flash steam plants are the most common type of geothermal plant Ú Hot water is pumped under high pressure to surface where reduced pressure “flashes” the water to steam Ú steam directed through a turbine Ú Remaining hot water pumped back into reservoir http: //www. eere. energy. gov/geothermal/geopowerplants. html
Binary Cycle Power Plants Ú geothermal reservoir never comes in contact with the generator Ú water from the reservoir is used to heat another "working fluid" which is vaporized and used to turn the turbine/generator units. Both systems of water are confined in their own “closed loops” Ú Can operate with lower temp. geothermal waters by using working fluids with lower boiling point than water such as isobutane Ú produce no air emissions http: //www. eere. energy. gov/geothermal/geopowerplants. html
his ! t w ! Ne tury n ce Hot Dry Rock Power Plants Ú Invention of the 21 st century Ú Uses a man-made or enhanced hydrothermal reservoir Ú Artificial fractures are made in hot, impermeable rock Ú Cold water is injected from the surface into the fractures where the water is heated Ú A production well intersecting the man-made reservoir returns the heated water to the surface for use in direct-use or geothermal power applications. "All that is necessary to open up unlimited resources of power throughout the world is to find some economic and speedy way of sinking deep shafts. " — Nikola Tesla, 1931
his ! t w ! Ne tury n ce Geopressure Power Plants and Magma Technology Ú Geopressured geothermal technologies – would harness the mechanical energy from the high pressures Ú Magma geothermal technologies – May be able to extract thermal energy directly from shallow magma intrusions
Geographical Possibilities Ú Western USA – Top 3 states: • Nevada • California • Utah Ú Alaska, Hawaii Ú Iceland Ú New Zealand Ú The Philippines Ú South America http: //geoheat. oit. edu/colres. htm
Environmental Benefits Ú Electricity produced from geothermal resources in the U. S. prevents the emission of: – 22 million tons of carbon dioxide – 200, 000 tons of sulfur dioxide – 80, 000 tons of nitrogen oxides – 110, 000 tons of particulate matter Ú Meet the most stringent clean air standards Ú Minerals contained in geothermal fluid are recycled so that little or no disposal or emissions occur.
Environmental Benefits Ú Byproducts – Sulfuric acid production – Silica – Zinc Ú Not land hogs! Ú A typical geothermal plant requires several wells, but minimal impact Ú Desalination
Environmental Obstacles Ú It ain’t perfect! – some applications produce carbon dioxide and hydrogen sulfide emissions – require the cooling of as much as 100, 000 gallons of water per megawatt per day, and dispose of toxic waste and dissolved solids.
Home Economic Benefits Ú Greenhouse growers can cut their heating costs by up to 80% Ú Home heat pump – – – Save ~$15/month Electricity consumption reduced by 30% - 60% Operable for 30 years + Low maintenance Hot water at no cost in summer and at small cost in winter. Ú geothermal electricity costs ranges from about 4 to 8 cents per kilowatt-hour. Ú hopes to achieve 3 cents per kilowatt-hour.
Geothermal Economics Ú second largest grid-connected renewable electricity source, after hydropower Ú third most energy of all renewables, after hydroelectricity and biomass. Ú The U. S. government receives about $41 million annually in royalty and lease payments from geothermal energy production on Federal lands. Ú Nearly, 2, 300 MWe (megawatts electric) of geothermal power, producing 14 to 17 billion kilowatt-hours per year of electricity worth about $1 billion in annual utility sales, are generated in California, Hawaii, Nevada, and Utah Ú Geothermal power plants are on line an average of 97% of the time – coal plants average 75 % and nuclear plants average 65% of on-line time Ú Construction time for geothermal power plants is as little as 6 months for plants in the Ú Ú range of 0. 5 to 10 MWe and as little as 2 years for operations totaling 250 Mwe or more. 21 countries generate 7, 000 Mwe of electricity from geothermal resources. In 1994, 1, 200 Mwe of geothermal electricity were installed overseas by U. S. companies, representing a $2. 5 billion investment. The U. S. geothermal industry has contracted for 3, 000 Mwe of new geothermal capacity in the Philippines and Indonesia, representing $6 billion in new business. For each 1000 houses using geothermal heat pumps, a utility can avoid installing 2 to 5 megawatts of capacity.
Research and Development Ú Geoscience and Supporting Technologies – Core Research – Enhanced Geothermal Systems – Seismic Exploration – Detection and Mapping
Research and Development Ú Drilling Research – Innovative Subsystems – Near-Term Technology Development – Diagnostics-While-Drilling
Goals Ú Goals and Objectives to make Geothermal economically feasible by 2010 (DOE) – Double the number of states with geothermal electric facilities to eight by 2006 – Reduce the levelized cost of generating geothermal power to $0. 03 - $0. 05 per kilowatthour Ú Supply the electrical power or heat energy needs of 7 million homes and businesses in the United States by 2010
Obstacles - Reality n Limited to a handful of locations n n n Regions of sufficient quality to produce economic electricity are rare Many regions are located in protected wilderness areas Would need to "harvest" geothermal power through non-traditional means n n deep-crustal drilling acquisition of heat from magma
Obstacles n n n High equipment and installation costs Technology doesn’t exist to generate power everywhere Earth’s heat isn’t intense enough to produce power for the electrical distribution grid; it is only sufficient to reduce the draw from the grid. Natural Gas Infrastructure!!!
Necessary Advancements n Energy Systems Research and Testing Advanced Plant Systems n "Geo. Powering the West" n International Clean Energy Initiative n Industry Support n
Fuel Cells The future of energy or wishful thinking?
Brief History n n n First Developed in 1839 by William Grove Improved upon by Francis Thomas Bacon 1930 s-1950 s First Commercial use by NASA n n Pratt and Whitney Apollo space vehicles http: //www. voltaicpower. com/Biographies/Bacon. Bio. htm http: //www. voltaicpower. com/Biographies/Grove. Bio. htm
Technology “Fuel cells are electrochemical devices that convert the chemical energy of a reaction directly into electrical energy. ” 2 H+ + ½O 2 + 2 e-1 = H 2 O
Fuel Cell Schematic Load 2 e-2 Fuel In Oxidant In H 2 Positive Ion H 2 O Negative Ion Product Gas Out Anode 1/2 O 2 H 2 O Product Gas Out Electrolyte Cathode
How does a Fuel Cell Work? http: //www. utcfuelcells. com/fuelcell/how_fl. shtml
Types of Fuel Cells n Polymer Electrolyte Fuel Cell (PEFC) n Proton Exchange Membrane Fuel Cell (PEMFC) Alkaline Fuel Cell (AFC) n Phosphoric Acid Fuel Cell (PAFC) n Molten Carbonate Fuel Cell (MCFC) n Solid Oxide Fuel Cell (SOFC) n Intermediate Temperature (ITSOFC) n Tubular (TSOFC) n Flat Plate (FPSOFC) n
Major Differences PEFC AFC PAFC MCF C ITSOFC Electrolyte Ion Exchange Membrane Potassium Acid Liquid Phosphoric Acid Liquid Molten Carbonate Ceramic Operating Temperature 80ºC 65 -220ºC 205ºC 650ºC 600 -800ºC 800 -1000ºC Charge Carrier H+ OH- H+ CO 32 - O 2 - Cell Components Carbonbased Graphitebased Stainlessbased Ceramic Catalyst Platinum Nickel Perovskites
Advantages/Disadvantages PEFC n n Solid electrolyte Low operating temperature Low tolerance for CO Successful Trials http: //www. materiale. kemi. dtu. dk/FUELCELL/Pemfc. htm
Advantages/Disadvantages AFC n Excellent performance with H 2 Cathode: O 2 + 2 H 2 O + 4 e-1 4 OH-1 n Anode: H 2 + 2 OH-1 2 H 2 O + 2 e-1 n Wide range of electrocatalysts n Low tolerance of impurities n n n CO 2 + 2 KOH K 2 CO 3 + H 2 O Very Corrosive
Advantages/Disadvantages PAFC n n n Tolerance of CO 2 Less Complex Fuel Conversion Rejected heat and can be recycled Lower efficiency (37 -42%) High Cost for precious metal catalysts Electrochemical Reaction: n n Anode: H 2 2 H+ + 2 e-1 Cathode: ½O 2 + 2 H+ + 2 e-1 H 2 O
Advantages/Disadvantages MCFC Advantages of Higher Operating Temperature n CO 2 tolerance n Corrosive and mobile electrolyte n Material problems n Electrochemical Reaction: n Anode: H 2 + CO 32 - CO 2 + 2 e-1 n Cathode: ½O 2 + CO 2 e-1 CO 32 n
Advantages/Disadvantages SOFC n n n n No corrosion or mobility Fast cell kinetics Internal reforming Thermal expansion mismatches (~1000°C) Sealing problems Material constraints Electrochemical Reaction: n n Anode: H 2 + O 2 - H 2 O + 2 e-1 Cathode: ½O 2 + 2 e-1 O 2 -
Schematic of Anode Supported Cell
Advantages/Disadvantages ITSOFC Ceramic used for electrodes and electrolytes n Internal reforming n No corrosion or mobility n Electrolyte conductivity and electrode kinetics drops n
Barriers n n Infrastructure Hydrogen Source Hydrogen Distribution and Storage Market Acceptance
Infrastructure n n “Hydrogen filling stations capable of Fueling Stations supplying 100 vehicles a day, built in Pipelines sufficient numbers to realize respective A mechanic that knows how to fix your economics of scale, could sell the fuel car? at a price comparable to that of Partsgasoline. ” -Ford Motors
Hydrogen Source Hydrogen is not found naturally, so where is it coming from? n n n n Ethanol Methanol Electrolysis Gasoline Natural Gas Synthetic fuels Diesel “Gas-to-Liquid” http: //www. memagazine. org/backissues/dec 99/features/cells. html 2 H 2 O 2 H 2 + O 2 C 8 H 18 C + 2 H + 16 O 2 O 8 CO CO 2 + 9 H + 2 H 2
Hydrogen Distribution and Storage n Compressed Hydrogen n n Liquefying Hydrogen Metal Hydrides Carbon Nanotubes Glass Microspheres As of present, automotive goal 5. 5% hydrogen and 60 kg/m 3 volumetric capacity has not been reached http: //www. smlassociates. com/papers. shtml http: //www. eere. energy. gov/hydrogenandfuelcells/pdfs/30535 aq. pdf http: //www. eere. energy. gov/hydrogenandfuelcells/pdfs/32405 b 27. pdf http: //www. eere. energy. gov/hydrogenandfuelcells/pdfs/32405 b 29. pdf http: //www. euweb. de/fuel-cell-bus/storage. htm
Market Acceptance n Hydrogen Misconceptions “ 35 people died in the flames - and nobody knew why. Sabotage? A bolt of lightning? The mystery surrounding the disaster has never been resolved until now. In many years of research, a NASA scientist at Cape Canaveral has found proof that neither the hydrogen in the hull nor a bomb was to blame, but the fabric of the http: //www. vidicom-tv. com/tohiburg. htm Hindenburg's outer skin and a new protective coating. A single spark of static electricity was enough to make it burn like dry leaves. The ‘infallible’ German engineers had designed a flying bomb just waiting to explode. ”
Market Acceptance n n Cost will be a major factor in the acceptance of fuel cells Technology and Fuel will need to be competitive with current technologies
Fuel Cells: The Future “Fuel-cell technology is going to take a long time to bring to some sort of affordable fruition. There is not going to be a silver bullet. It is a long, slow haul, requiring a lot of consistent work in the areas of research and infrastructure, but there will be some very exciting episodes along the way with very small fleets built. ” n n n Richard Parry-Jones, Ford Group Vice President Ford is looking 15 -25 years into the future before the fuel cell is a viable alternative to the internal combustion engine
Fuel Cells: Technology for Today
Current Uses Ú Appliance Applications Ú Residential Ú Commercial Ú Transportation http: //www. tipmagazine. com/tip/INPHFA/vol-7/iss-4/p 14. pdf http: //www. ballard. com/t. D. asp? pgid=32&dbid=0 http: //www. hfcletter. com/letter/february 00/index. html
Appliance Application Ú Replace the Battery in Portable Electronics – Cell Phones – Labtops Ú Fuel Cell runs 20 X longer than nickel- cadmium batteries
Residential Ú Solid Oxide Fuel Cells Ú Stationary Fuel Cells for Homes Ú UTC Fuel Cells: 5 k. W Proton Exchange Membrane (PEM) power plant -- called the Energy Center http: //www. utcfuelcells. com/residential/overview. shtml
Commercial Case Study: UTC Fuel Cells Ú First National Bank of Omaha Ú Anchorage Mail Processing Center Ú Conde Nast Building NY, NY Ú City of Portland http: //www. utcfuelcells. com/commercial/applications. shtml
Transportation Ú PEMFC Ú Georgetown University Ú Daimler. Chrysler: Mercedes-Benz and Jeep nhttp: //www. fta. dot. gov/research/equip/buseq/fucell/fucell. htm http: //www. daimlerchrysler. com/index_e. htm? /news/top/2000/t 01107 a_e. htm
Case Study: Ballard Ú Ca. FCP – ZEbus Demonstration Program Ú Chicago and Vancouver Demonstration Programs Ú European Fuel Cell Bus Project http: //www. ballard. com/t. D. asp? pgid=31&dbid=0 http: //www. ballard. com/t. D. asp? pgid=28&dbid=0 http: //www. ballard. com/t. D. asp? pgid=30&dbid=0
Building an Infrastructure Ú Hydrogen Filling Station in Munich, Germany Ú Hydrogen Filling Station plan unveiled in Reykjavik, Iceland
World Wide Hydrogen Fueling Stations Ú Ú Ú Ú Ú Russelsheirr, Germany Davis, California El Segundo, California Ú Sindelfingen, Germany Ú 2 X Berlin, Germany 2 X Thousand Palms, California Sacramento, California Ú Copenhager 2 X Torrance, California Ú Lisbon Ú Erlangen, Germany Oxnard, California Chula Vista, California Ú Obersidorf Spa, Germany Ú Stuttgart, Germany Richmond, California Ú Stockholm, Sweden San Jose, California Ú London, United Kingdom Chicago, Illinois Ú Amsterdam, The Netherlands Dearborn, Michigan Ú City of Luxemburg Phoenix, Arizona Ú Oporto, Portugal Northern Nevada Ú Madrid, Spain Torino, Italy Ú Barcelona, Spain 2 X Munich, Germany 2 X Hamburg, Germany Ú Reykjavik, Iceland Ú Perth, Australia Nabem, Germany Ú Victoria, Australia Wolfsburg, Germany Ú South Korea Ú Ú Ú Ú Ú Beijing, China Shanghai, China Cairo, Egypt Mexico City, Mexico New Delhi, India Sao Paulo, Brazil Osaka, Japan Takamatsu, Japan Tsurumi, Japan 2 X Yokohama, Japan Tokai, Japan 2 X Tokyo, Japan Kawasaki City, Japan Vancouver, Canada Montreal, Canada Surrey, BC Canada Torino, Canada Oostmalle, Belgian Leuven, Belgian
The Future of Energy is Here Today These examples are case studies, and are by no means the only examples of Grab the Future! fuel cells currently being utilized worldwide
Wind Energy Water pumping, agricultural use. Danish wind mill Wind turbine, used for electricity Wind Farm
Who uses them? n Historically: n n n Nile 5000 B. C China grind grain pump water. Present day: n used for electricity n n n Utility power grids for domestic energy Can be combined with photovoltaics Homeowners, farmers, and ranchers
How wind turbines work n Kinetic to mechanical to electrical energy n Intermittent resource They make electricity by orienting the propellers upwind (into the wind). n “Works opposite of a fan” n Wind forces the blades to turn---The shaft then spins---The shaft is connected to a generator which makes electricity. n http: //www. eere. energy. gov/wind/animation. ht ml n
Common Design n n 3 bladed, 100 feet (30 meters) Large: 50 to 750 kilowatts Small: < 50 kilowatts Hawaii propellers = 100 yards 20 stories high n n Small = 8 -25 feet diameter, 30 ft. tall n n n 1400 homes. Home or small business Horizontal-axis variety Vertical-axis design n Darrieus model
Design http: //www. eere. energy. g ov/wind/feature. html
Energy Capacity n n n 6% of the U. S. continental land is viable for wind energy. Utility-scale 50 to 750 kilowatts. U. S. 4, 685 MW capacity n n n capacity of almost 30, 000 megawatts world wide n n n 1, 822. 3 MW in Ca. 2001 installed 1, 700 MW worth $1. 7 billion 6, 500 were installed world wide in 2001 $7 billion in sales Small scale single turbines- below 50 kilowatts n homes, telecommunications dishes, or water pumping.
Primary Energy Payback for Various types of Power Plants n Type of Power Plant. Payback (Months) Nuclear 0. 7 n Coal 0. 7 n Wind @ 7 m/s 2. 5 - 7. 5 n Wind @ 5. 5 m/s 3. 8 - 11. 4 n Wind @ 4 m/s 6. 3 - 22. 7 n
Wind Resources
States with the most potential Great Plains states n California has the most installed n Wind energy and the turbines are expanding rapidly. n Iowa, Minnesota, Texas, Wisconsin, and Wyoming n Appalachian Mountain region n
Performance Variables The power in the wind is proportional to the cube of the wind speed. n Probability of direction n Wind rose Gustiness n Shuts off at 65 mph
Economics of Wind Energy n The cost has dropped 85% in 20 years Looking good for the future n $. 35 -$. 025 n Current rate is 9 cents per k. Wh n Life cycle costs- low n Buy back rates- not feasible yet n 30% growth rate capacity of almost 6, 000 megawatts. n High capital cost n
Business Wind energy diversifies the nation's energy supply n Takes advantage of a domestic resources n Reduces greenhouse gases n NIMBY n Pollution-Economy- correlation n $1. 7 Billion Industry- evidence that the market is working! n Germany has surpassed the U. S. in installation of wind energy turbines n n 2, 600 MW installed in 2001
Policy Non-discriminatory transmission rules n Renewable Portfolio Standards n Fees on emission and pollution from electricity generation n Incentives for renewables- n could hurt businesses n Artificial sense of price n
We don’t have problems! 1 -2 Birds are killed a year per turbine n The noise level is hardly a problem n Transmission lines will become more viable n People are not going to oppose them so harshly. n n n Lowers their own energy bill The land is not being rendered unusable n Agriculture including grain and cattle
Wind Speeds and Prices
Wind Power Goals n n n Meet 5% of the nation's energy needs with wind energy by 2020 (i. e. 80, 000 megawatts installed) Double the states that have the capacity to supply more than 20 megawatts of wind power by 2005 and triple it to 24 by 2010 Keep making wind competitive with conventional sources of energy. n Still cheaper than nuclear
Problems with the Technology Aesthetics and visual impacts n Birds n Noise n Lightening n TV/Radio interference n
Benefits Ú “The electric industry remains the largest, single industrial source of air pollution. ” Ú http: //www. eere. energy. gov/state_energy/technology_overview. cfm? techid=2 Ú 1990, California's wind power – offset 2. 5 billion pounds of carbon dioxide – 15 million pounds of other pollutants that would have otherwise been produced. – It would take a forest of 90 million to 175 million trees to provide the same air quality. – Therefore, taking advantage of renewables will help us decrease the amount of air pollution.
EMISSION COMPARISON BETWEEN A WIND TURBINE AND A COAL PLANT OVER 25 YEARS Ú Plant type SOx(tons) NOx (tons) CO 2 (tons) Ú Wind 14 0. 3 87 Ú Coal 40 108. 0 31, 326 Ú The U. S wind industry offset 7. 5 million tons of carbon dioxide
Incentives Ú Pennsylvania’s Berks County Community Foundation. Ú The development and use of renewable energy and clean energy technologies; - Energy conservation and efficiency; - Sustainable energy businesses - Projects that improve the environment in the companies' service territories
Bottom Line Ú Wind Turbines REDUCE (CO 2) Ú Scientists have agreed that Global Warming is occurring, so lets start mitigating by using more wind power! Ú 750 -kilowatt (k. W) (typical for electrical use) produce 2 million kilowatt-hours (k. Wh) per year. Ú Approximately 1. 5 pounds of CO 2 are emitted for every k. Wh generated. An average turbine prevents: – 2 million k. Wh x 1. 5 pounds CO 2/k. Wh = – 3 million pounds of CO 2 = – 1500 tons of CO 2 each year. Ú “Ecological Footprint” – forest absorbs approximately 3 tons of CO 2 per acre of trees per year. Ú Thus, a single 750 k. W wind turbine prevents as much carbon dioxide from being emitted each year as could be absorbed by 500 acres of forest. http: //www. awea. org/faq/co 2 trees. html
Infrastructure Problems
Biomass
Bioenergy Ú Provides about 3% of all energy used in US. Ú In 2001, biomass provided over half of the renewable energy in US Ú Globally, biomass meets about 14% of the world's energy needs
Biomass Ú organic matter which can be converted to energy or fuels Ú Use of existing resources – “Cut it down, process it, then burn it” Ú Active creation of organic material or “energy crops” – “Grow it, process it, then burn it” Ú Use of plant and animal byproducts – “you get the picture”
Feedstocks Ú Biomass byproducts used for fueling power plants – Wood residue • • Mill Residues Urban Wood Residues Tree Trimmings Forest Residues – Agriculture residue • Bagasse • Rice husks – Energy crops • Crops grown specifically for fuel • fast-growing trees, shrubs, and grasses, hybrid poplar, willow, switchgrass, and eucalyptus.
Other sources Ú Municipal Solid Waste (landfills) Ú Animal waste – Manure, bedding from swine, cattle, poultry Ú Human Waste (sewage and sludge)
Combustion Direct combustion burning of unprocessed material by direct heat to produce heat or steam to generate electric power direct combustion is the simplest biomass technology wood, garbage, manure, straw, and biogas
Combustion Ú Residential • burning wood fireplace or woodstove • pellets stoves and compacted/ manufactured logs • space heating, cooking Ú Industry • Industrial biomass includes: – – wood agricultural residues wood pulping liquor municipal solid waste • Furnaces - burns fuel in a combustion chamber to create hot gases • Boiler - transfers the heat of combustion into steam used for electricity, mechanical energy or heat – pile burners – stationary or traveling grate combustors – fluidized-bed combustors.
Combustion Cogeneration – combustion facilities that produce electricity from boilers and steam-driven turbine-generators • conversion efficiency of 17 to 25 percent (85% improvement of overall system efficiency) – Bottoming Cycle: • steam product used first in an industrial process first and then routed through a turbine to generate electricity – Topping Cycle: • steam passes first through a turbine to produce electric power and then exhaust from the turbine is then used for industrial processes or for space and water heating • More common process
Combustion Direct-Fired Gas Turbine – Pretreated fuel (particle size <2 mm, moisture content <25%) – fuel burned with compressed air Co-Firing with Coal – secondary fuel (~20%)in a coal-burning power plant using highsulfur coal – decreases CO 2 emissions from the power plant Alkali Fouling – Allows the burning of agriculture products containing alkali compounds (K, Na) – Special boilers with low exit temperatures to reduce slag
Gasification Ú Process that converts biomass into a combustible “producer” gas – contains carbon monoxide, hydrogen, water vapor, carbon dioxide, tar vapor and ash particles – 70 – 80% of potential energy from feedstock – gas burned directly for space heat or drying – gas can be burned in a boiler to produce steam Ú Gas is cleaned by filters and scrubbers – internal combustion engine – fuel cells Ú Pyrolysis (first stage of gasification) 450° to 600° C – Vaporization of volatile components with controlled heat in absence of air – carbon monoxide, hydrogen, methane, volatile tars, carbon dioxide, water and charcoal Ú Char conversion (last stage of gasification) 700° to 1200° C – The charcoal residue + oxygen = carbon monoxide
Digester Gas Anaerobic digestion Biomass is mixed with water and then put in a a digester tank without air. converts organic matter to: a mixture of methane and CO 2 syngas, a mixture of carbon monoxide and hydrogen Sewage, manure, and food processing wastes
Digester Gas Landfill gas created from anaerobic digestion or decomposition of buried trash and garbage in landfills gas generated consists of ~50% methane
Biodiesel fuel Ú Substitute for petroleum diesel Ú Made by chemical conversion process that converts oilseed crops into biodiesel fuel – mechanical press extraction – solvent extraction Ú Vegetable oils, such as rapeseed, corn or safflower, can be used as a diesel fuel without further processing Ú Trans-esterification – reduces the high viscosity of vegetable oil – higher-quality fuel – oil reacts with alcohol in the presence of a catalyst to produce glycerol and rapeseed methyl or ethyl ester (RME or REE) – used straight or in a blend with petroleum diesel.
Fuel Alcohol Methanol (wood alcohol) – wood and agricultural residues, but most from natural gas Ú From biomass: made through high temp/pressure gasification – carbon monoxide and hydrogen catalyzed to condense into liquid methanol Ú Fuel alternative – Methanol is a high-octane fuel that offers excellent acceleration and vehicle power – Methanol-fueled trucks and buses emit practically no particulate matter less nitrogen oxides than diesel
Fuel Alcohol Ethanol (grain alcohol) converting starch to sugar → fermenting sugar to alcohol with yeast → distilling alcohol water mixture → ethanol wheat, barley, potatoes, waste paper, sawdust, and straw contain either sugar, starch, or cellulose for fermenting alternative fuel for internal combustion engines.
Ethanol Ú Ethanol is already penetrating the transportation market as gasohol as replacement fuel Ú Higher blends of ethanol, specifically E 85, are becoming increasingly available in certain regions of the US Ú Nearly 150 stations in 20 states in the Midwest and Rocky Mountains Ú All major automobile manufacturers have models that can operate on E 85, gasoline, or any mixture of the two.
Hemp http: //hightimes. com/photooftheweek. html – 10 tons per acre in four months – contains 77% cellulose • compared to wood containing 60% cellulose – requires no special equipment to plant or harvest – drought resistant – removes less nutrients from the soil than any other feedstock – hemp can yield up to eight times as much methanol per acre as corn – equals 1, 000 gallons of methanol per acre per year – hemp is perhaps the only plant capable of producing sufficient biomass to provide an alternative to fossil fuels
Tax Incentives ~ Renewable Fuels Ú Case Study: Hawaii – Act 143 (HB 1345, Relating to Energy Content of Fuels) – encourages use of alternative fuels (less energy per gallon) – adjusting the fuel tax to reflect the energy content of alternative fuels – reducing the fuel tax rate of alternative fuels for several years – Offsets discouragement to use alternative fuels that were once taxed higher http: //www. hawaii. gov/dbedt/ert /fueltax-act 143. html
Biomass Methods Conversion Process Type Major Biomass Feedstock Energy or Fuel Produced Direct Combustion Thermochemical wood agricultural waste municipal solid waste residential fuels heat steam electricity Gasification Thermochemical wood agricultural waste municipal solid waste low or medium-Btu producer gas Pyrolysis Thermochemical wood agricultural waste municipal solid waste synthetic fuel oil (biocrude) charcoal Anaerobic Digestion Biochemical (anaerobic) animal manure agricultural waste landfills wastewater medium Btu gas (methane) Ethanol Production Biochemical (aerobic) sugar or starch crops wood waste pulp sludge grass straw ethanol Biodiesel Production Chemical rapeseed soy beans waste vegetable oil animal fats biodiesel Methanol Production Thermochemical wood agricultural waste municipal solid waste methanol Technology http: //www. energy. state. or. us/biomass/Tech. Chart. htm
Environment Benefits Ú Theoretically inexhaustible fuel source Ú Biomass absorbs carbon dioxide during growth • Recycling Process Ú Reduce Landfill usage Ú Available to produce everywhere! Ú Low levels of sulfur and ash • Does not contribute to acid rain Ú Nitrous oxide emissions can be controlled Ú Co-firing with biomass helps existing power plants comply with clean-air laws
Biomass Economics n n n In 1992, biomass grossed $1. 8 billion in personal and corporate income in US 66, 000 jobs supported by biomass energy economic benefits expected to triple by 2010 supports agriculture and rural America Tax credits n 1. 5 ¢/k. Wh relief for electricity generated from "closed -loop biomass”
Biomass Disadvantages n n If burned directly, contributes CO 2 and particulates just like coal and petroleum! expensive source n n producing the biomass and converting it to alcohols On a small scale there is most likely a net loss of energy n energy must be put in to grow the plant mass!
Where are we going?