QCI D L SHAH QUALITY AWARD Sector Categories


- Slides: 45
QCI – D. L. SHAH QUALITY AWARD Sector & Categories – Infrastructure , Code: (M) “Reduction of weld repair to 5% level” in “Bogibeel Rail cum Road Bridge Project” at Dibrugarh , Assam Presented by : Sabyasachi Laha Chief Quality & HSE Manager, Bogibeel Date : 12 th April ‘ 15
Components & Assembly Fabricated Components Span Fabricated Components Launching
Key Information of Bridge S. No. Title Description 1 Length 4315. 20 m (As per Contract) 2 Revised Length 4940. 20 m (39 Normal Spans and 2 End Spans) 3 Span Arrangement 1 X 32. 6 m + 34 X 125 m + 1 X 32. 6 m 4 New Span Arrangement 1 X 32. 6 m + 39 X 125 m + 1 X 32. 6 m (5 Spans added) 5 Type of superstructure Composite welded Warren Truss Girder with road deck at top chord (with shear connector) and rail at bottom deck. 6 Superstructure configuration Two tier bridge with 2 BG Tracks on the lower deck and 3 lane roads on the top deck. 7 C/C of truss 10. 60 m 8 Depth of truss 12. 50 m 9 HFL 102. 92 m (RL) 10 Rail level 118. 297 m 11 Minimum required navigational clearance Horizontal – Vertical 100 m - 10 m
Quality Strategy & Implementation at Bogibeel CHALLENGES / OPPERTUNITIES ACTIONS Fully welded bridge 1 st time in India Recruited experts at different key positions Understand the quality requirement as Training on welding & NDT through WRI, per European standard -- Executor & Trichi in batches at site. also customer Regular interaction with Quality & welding expats from DSD Very high employee attrition or retention Some incentive to sub-contractor/worker of people Different mind set of sub-contractors Incentive scheme for engagement & stop leaving continuous Position restriction during welding & Developing workforce to suit conditions grinding through on job training Hard to convince the usage of Quality Management support & pivoting a key role Tools & Techniques for improvement by QHSE Head and Team communication. Success in one area believe to others.
Quality Strategy & Implementation at Bogibeel CHALLENGES / OPPERTUNITIES CHALLENGES ACTIONS / ACTIONS Communication amongst Engineers & Monthly IMS review meeting with all OPPERTUNITIES Managers across Organisation officers chaired by Project Manager to focus QHSE concerns & customer Focus Communication amongst Engineers & Monthly IMS review meeting with all Managers across Organisation officers chaired by Project Manager to Different work culture of Engineers & Training & continuous dialog . Daily Tool focus QHSE concerns & customer Focus workers recruited across India Box Talk at shop floor level Different work culture of Engineers & Training & continuous dialog. Daily Tool Difficulty in getting skilled work force to Develop workforce through continuous workers recruited across India Box Talk at shop floor level execute highest quality of job training & re-training. Involvement of expert from ESAB training school. Welders qualification per EN 287.
Diagnostic Approach Ø Daily, Weekly & Monthly cross functional meeting on weld repair Ø Walk the talk with welders & shop floor Supervisors / Engineers one to one basis Ø UT / RT data analysis on weld failure Ø Pin pointing sub- contractor & welders Ø 7 QC Tools & Techniques Ø DMAIC of Six Sigma Ø Small Group Activity
Methodology for Deployment Ø Objective & Target setting Ø Monitoring of welders performance Ø Discussion with welders & shop floor supervisors Ø Re-training of welders at welding school Ø Re-testing of welders Ø Training to new grinders Ø Involvement of people Ø Coaching to SGA group Ø Process Management Ø Motivation by Top Management Ø Line graph & monitoring weekly basis
Quality Objectives Sl. No. : BB/Q/ 14 -15/03 PROJECT: Bogibeel Rail cum Road Bridge Date: 25. 04. 14 Quality Objective Reduction of repair in Assembly in UT/RT of welds Rejection Report in UT / RT Basis Reduction from 24% in March to 5% by Sept’ 14 Target Sept ’ 14 Target Date Performance Indicator & Records Monthly rejection report Programme (Action Plan) Sl. No. Actions Responsibility Target Date 1. Capturing of Weld repair data daily basis and reporting QA Mgr / QA Engr Established in the system 2 Formation of cross functional group PM Done 3 Analysis of failure in cross functional group at least once in a week Fabrication Manager with Team 4. 5. Take action based on findings of Pareto Analysis Discuss with welders & grinders to follow the process Keep statistics of welders performance weekly basis Fab. Mgr / Engr Fab Manager & Engineer Training to welders & grinders on continuous basis Performance measurement & reporting to Management Fab. Mgr / Engr QA Mgr / QA Engr QA Dept 6. 7. 8 Fab. Mgr / Engr QA Mgr / QA Engr Continuous Continuous Weekly
Review of Progress Review Date : 30. 09. 2014 1. Proposed Actions Capturing of Weld repair data daily basis and reporting QA Mgr / QA Engr Established in the system On going PM Done Continuous Done 2. Formation of cross functional group 3. Analysis of failure in cross functional Fabrication group at least once in a week Manager Assy. with Team Take action based on findings of Fab. Mgr / Engr Pareto Analysis 4. Target Date Responsibility 5. Discuss with welders & grinders to follow the process Fab Manager & Engineer Continuous Reporting 6. Keep statistics of welders performance weekly basis Fab. Mgr / Engr Continuous QA Mgr / QA Engr Continuous 7. Training to welders & grinders on continuous basis Fab. Mgr / Engr QA Mgr / QA Engr Continuous 8 Performance measurement & reporting to Management QA Dept Daily July Avg repair below 2 % & 4% in Lay down & Vertical Assy C L O S E D S. No. Status of Next Target implementatio Date of n as on target completion (if date required)
SGA in Assembly
SGA in Assembly Improvement § Each joints fit up are inspected and addressed before welding § Showing defects and explains the causes to welders & grinders § Training the grinder and arc gougers. § Selection of proper grinding wheel § After back grinding of root with proper beveling & DP test to ensure sound metal § Welders involved to maintain process parameters as per approved WPS § Pre-heat, inter pass temperature , current & voltage are controlled as per WPS and same are monitored § Buttering , if necessary to be ensured soundness by NDT before final weld § Continuous supervision
SGA in Assembly
SGA in Assembly
SGA in Assembly
SGA in Assembly Table : 3 Laydown assembly yard Repair % from 22. 04. 2014 to 30. 04. 2014 SL NO DATE Scanned Repair Length Repair % length in mm 3 4 5 * UP to 22. 04. 2014 used Anand MIG filler wire. 22. 04. 2014 32450 3760 11. 6 23. 04. 2014 8320 0 0 24. 04. 2014 22490 620 2. 8 28. 04. 2014 18250 610 3. 3 29. 04. 2014 24500 9380 38. 3 30. 04. 2014 12070 7620 63. 1 *LR module welding was done without proper supervission and without welding parameter registering. Popele were busy in vertcal Assy welding TOTAL 118080 21990 18. 6 1 2 Remarks ESAB MIG wire started from 23 rd Apr'14 6 Avergae Repair =18. 6%
SGA in Assembly
SGA in Assembly Measurement & Control § Average repair 18. 6 % from 22. 04. 14 to 30. 04. 14 at the beginning of the SGA to start § Average repair 4. 5% from 02. 05. 14 to 10. 05. 14 has been achieved & shown in Table 3 § Continuous monitoring of process parameters & record
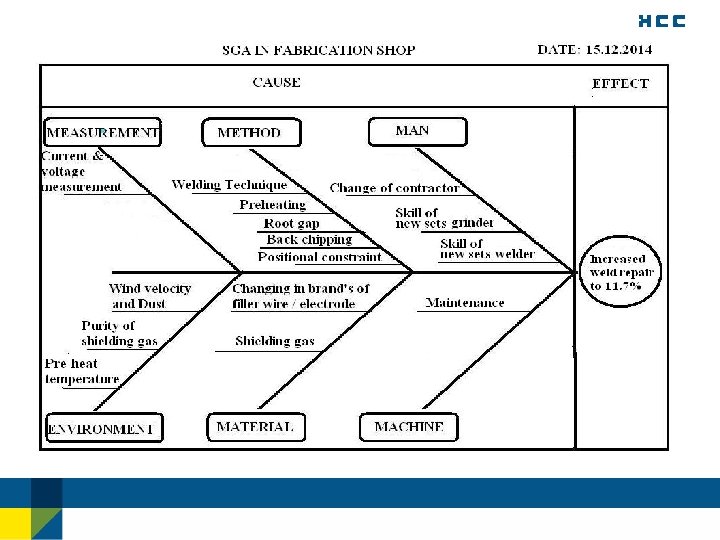
CROSS FUNCTIONAL TEAM MEETING IN REDUCTION OF WELD REPAIR FABRICATION SHOP
SGA in Fabrication Shop SGA on reduction of weld repair to 5% at Fabrication Shop Ø Team Leader : Mr Rakesh Kumar Singh / PCH Ø Team Members : Ø Mr Appaiyan / Mr A Senthilkumar – QC Manager Ø Mr Satyanarayan Busala – QA Engineer Ø Mr T Venkatachalamurthy – Welding & QA Engineer Ø Mr Santo Bhadhury / Mr S Kar – Fabrication Manager Ø Mr Birkanto Bhattacharya – Fabrication Engineer Ø Mr Narendran K – Welding Engineer. Ø Facilitator- Mr. Sabyasachi Laha. / Chief Quality & HSE Manager
Table : 1 Probable causes based on Process Concept Sl no. Man Skill of welder M/C Machine performance Matrial Changing in brand’s of filler wire / electrode. Method Preheating. Enviroment Measurement Wind velocity and Current and dust. voltage measurement. Shielding gas Back chipping Humidity. Purity of shielding gas 1 2 3 4 5 Skill of new sets of Grinders. Skill of new sets of Welders. Root gap. Change of Sub. Contractor Welding technique Pre-heating temperature Positional constraint
Table : 2 Brain Storming on Probable Causes Sl No. Finalisation of Causes 1 Change of sub-contractor 2 Skill of new sets of Grinders. 3 Skill of new sets of Welders. 4 Purity of shielding gas 5 Welding Technique 6 Positional constraint
Table: 3 Prioritisation of the probable root cause Rating by Team Member in 1 to 10 scale SL No. F Total Score Causes A B C D E Rating 1 Change of Contractor 10 10 10 6 6 8 50 1 st 2 Positional constraint 4 2 2 4 4 4 20 5 th 3 Skill of grinder 8 7 7 44 3 rd 4 Skill of welder 10 9 9 8 6 6 48 2 nd 5 Purity of shielding gas 2 3 3 2 2 2 14 6 th 6 Welding technique 6 7 8 5 7 7 40 4 th
Monthly Weld Repair Bar Chart 2014 -15 • 30 BAR Graph Fabrication Shop 25 Vertical Assy Laydown Assembly 20 15 10 5 0 Apr May June July Aug Sept Oct Nov Dec Jan Feb Mar
Weekly Weld Repair Line Graph Dec ‘ 14 to Mar ‘ 15 40. 0 Fabrication Shop L. Assy V. Assy Shop Weld Repair% 30. 0 Target 24. 3 20. 0 15. 4 14. 3 12. 75 10. 0 9. 0 8. 1 8. 2 5. 8 3. 5 0. 0 Dec. W 1 W 2 4. 9 5. 4 4. 8 1. 4 W 3 2. 1 0. 0 W 4 5. 0 2. 9 0. 0 W 5 9. 3 9. 0 3. 0 2. 0 10. 8 8. 8 4. 9 3. 6 0. 9 4. 1 0. 0 Jan W 1 W 2 12. 4 W 3 6. 3 3. 0 3. 8 1. 5 0. 0 W 4 Feb W 1 W 2 Week wise 9. 0 8. 3 7. 4 0. 0 W 3 0. 0 1. 6 1. 7 W 4 Mar W 1 W 2 7. 5 4. 9 5. 2 2. 4 2. 2 W 3 0. 0 W 4 W 5
Monthly Welders Performance
Monthly Welders Performance
Monthly Welders Performance
Monthly Welders Performance
Monthly Welders Performance
Training to welders in Welding School
Training to welders in Welding School
Training to welders in Welding School
Daily Tool Box Talk
Training to New Engineers
Top Management Communication
Management Communication
Financial and non-tangible benefits Ø Reduction of non-quality cost Ø Reduction of fabrication cycle time Ø Reduction in consumable cost Ø Overall satisfaction of welders & execution team and increase efficiency Ø Self motivation Ø Customer satisfaction
Sample Welding Cost COSTING BASED ON 1 Mtr OF 32 mm BEVEL FULL PENETRATION REPAIR WELD WITHIN 1. 5 Days COSTING HEAD Cost Rs / Day Total Cost of Repair ( Rs) 800 1200 560 840 1360 2040 4080 6120 e) Welding Wire cost @ Rs 170 X 5 Kg --- 850 f) Cost of Shielding Gas ---- 50 9060 a) Welder Cost @ Rs 20, 000 / month b) Gouging /Grinding @ Rs 14, 000 / month c) Total = a + b d) OH ( Plant, Equipment , Indirect labour Supervision , etc ) = 3 X (c) GRAND TOTAL
Non Quality cost data towards saving Non Quality Cost in Fabrication Shop REPAIR COST SAVINGS ( Rs lakhs) Rs (Lakhs ) 2014 -15 PRODUCTION (MT) FP WELD LENGTH (Mtr) WELD REPAIR APR 921 3628 27% 88. 75 MAY 1140 4492 17% 69. 19 JUN 900 3546 8% 25. 70 JULY 1296 5106 5% 23. 13 AUG 1145 4511 4% 16. 34 SEPT 1284 5059 3% 13. 75 OCT 974 3837 3. 9% 13. 56 NOV 974 3837 5. 5% 19. 12 DEC 962 3790 11. 7% 40. 17 JAN 970 3822 10. 4% 36. 02 FEB 1005 3960 7. 8% 27. 98 MAR 1240 4886 5. 3% 23. 46 TOTAL 12811 50474 397. 17 @27% repair Avg repair cost = 50474 mtr X 0. 27 X Rs 9060/mtr = Rs 1234. 69 837. 5
Non Quality cost data towards saving Non Quality Cost in Laydown Assembly Shop FP WELD LENGTH (Mtr) WELD REPAIR ( % ) REPAIR COST Rs (Lakhs ) 2014 -15 PRODUCTION (MT) APR 381 311 21 5. 92 MAY 140 115 3. 3 0. 34 JUN 270 220 3. 7 0. 74 JULY 552 451 1. 9 0. 78 AUG 611 499 3. 2 1. 45 SEPT 840 686 3. 4 2. 11 OCT 609 497 3. 3 1. 48 NOV 609 497 3. 5 1. 57 DEC 480 392 3. 9 1. 38 JAN 574 469 2. 3 0. 98 FEB 544 444 10. 1 MAR 752 614 4. 5 TOTAL 6362 5195 SAVINGS ( Rs lakhs) @21% repair Avg repair cost = 5195 mtr X 0. 21 X @ 4. 06 Rs 9060/mtr 3. 06 = Rs 98. 84 lakhs 23. 87 Rs 74. 97 lakhs
Non quality cost data towards saving Non Quality Cost in Vertical Assembly Shop 2014 -15 PRODUCTION (MT) FP WELD LENGTH (Mtr) APR WELD REPAIR ( % ) REPAIR COST Rs (Lakhs ) SAVINGS ( Rs lakhs) 21. 0 MAY -- JUN 270. 4 3. 4 0. 83 JULY 337. 7 3. 6 1. 90 AUG 495. 5 6. 2 2. 78 SEPT 84. 3 5. 2 0. 40 OCT 527. 4 4, . 4 2. 10 NOV 274. 5 5. 4 1. 34 DEC -- -- -- JAN 659. 6 4. 8 FEB -- -- MAR 659. 8 3. 8 TOTAL 3309. 2 @21% repair Avg repair cost = 2. 87 3309 mtr X 0. 21 X -Rs 9060/mtr 2. 27 = Rs 62. 96 lakhs 14. 49 Rs 48. 47 lakhs
Savings in 2014 -2015 Ø @ 27% weld repair in Fabrication shop saving = Rs (1235 – 397 )lakhs = Rs 838 lakhs Ø @ 21% weld repair in Laydown Assembly = Rs ( 75 – 24 ) lakhs = Rs 51 lakhs Ø @ 21% weld repair in Vertical Assembly = Rs (48. 5 -14. 5) lakhs = Rs 34 lakhs Ø Total NQC savings = Rs 923 lakhs Ø Reduction of cycle time from 16 weeks in 1 st Span to 7 weeks present level
Sustainability & Applicability in Other Areas Ø Monthly performance monitoring on weld repair at Laydown Assembly from Apr ’ 14 Ø New SGA in Fabrication Shop after Laydown Assembly success Ø Extension of Laydown Assembly to Vertical Assembly from 2 nd span Ø Decrease trend on weld repair shown in Bar chart & line graph Ø Addressed the increase repair for the changed circumstances through new SGA Ø Brought down the weld repair in Fabrication shop at target level
Thank you