Owens Corning Investor Day Financial Strategy Mike Thaman
- Slides: 19
Owens Corning Investor Day Financial Strategy Mike Thaman Chairman of the Board and CFO
Forward-looking Statement and Non-GAAP Measures This presentation contains forward-looking statements within the meaning of Section 27 A of the Securities Act of 1933, as amended, and Section 21 E of the Securities Exchange Act of 1934, as amended. These forward-looking statements are subject to risks and uncertainties that could cause actual results to differ materially from those projected in these statements. The forward-looking statements speak as of the date May 16, 2007, hereof and are subject to change. The Company does not undertake any duty to update or revise forward-looking statements. Further information on factors that could affect the Company's financial and other results is included in the Company's Forms 10 -Q and 10 -K, filed with the Securities and Exchange Commission. Additional Company information is available on the Owens Corning Web site: www. owenscorning. com. Certain data included within this presentation contains "non-GAAP financial measures" as defined by the Securities and Exchange Commission. A reconciliation of these non-GAAP financial measures to their most directly comparable financial measures calculated and presented in accordance with generally accepted accounting principles can be found in our most recent Form 10 -K and on our Web site referenced above. Results for 2006 reflect the application of Fresh Start accounting as of October 31, 2006. 2
2006 At A Glance • Record sales of $6. 5 billion, up 2. 2% over 2005 • Adjusted EBIT of $569 million, up 4. 6% compared with $544 million in 2005 • Gross margin as a percent of sales, excluding Fresh-Start Accounting and other restructuring charges, 17. 5% compared with 18. 3% in 2005 • SG&A 8. 3%, compared with 8. 9% in 2005 3
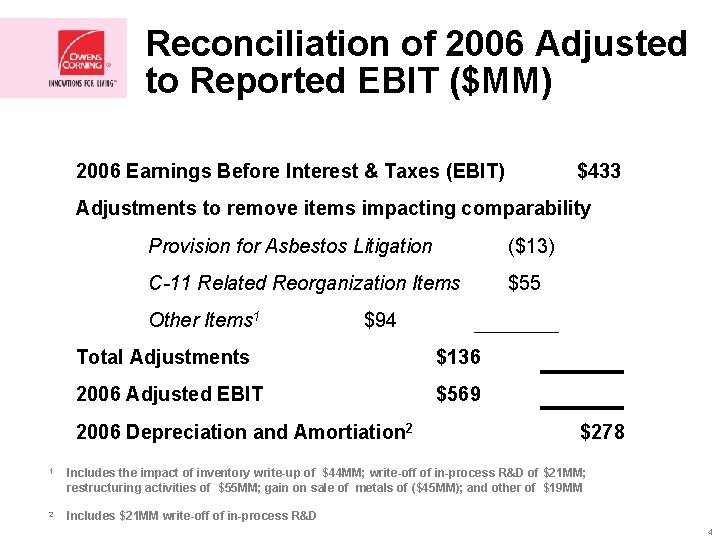
Reconciliation of 2006 Adjusted to Reported EBIT ($MM) 2006 Earnings Before Interest & Taxes (EBIT) $433 Adjustments to remove items impacting comparability Provision for Asbestos Litigation ($13) C-11 Related Reorganization Items $55 Other Items 1 $94 Total Adjustments $136 2006 Adjusted EBIT $569 2006 Depreciation and Amortiation 2 $278 1 Includes the impact of inventory write-up of $44 MM; write-off of in-process R&D of $21 MM; restructuring activities of $55 MM; gain on sale of metals of ($45 MM); and other of $19 MM 2 Includes $21 MM write-off of in-process R&D 4
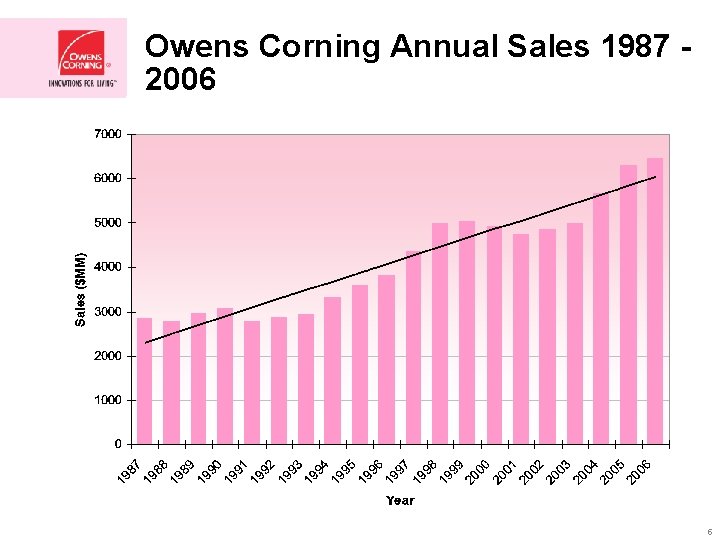
Owens Corning Annual Sales 1987 2006 5
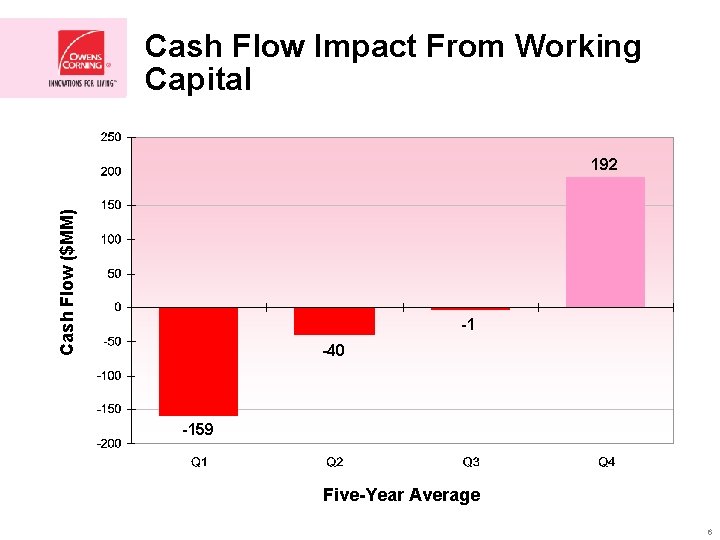
Cash Flow Impact From Working Capital Cash Flow ($MM) 192 -1 -40 -159 Five-Year Average 6
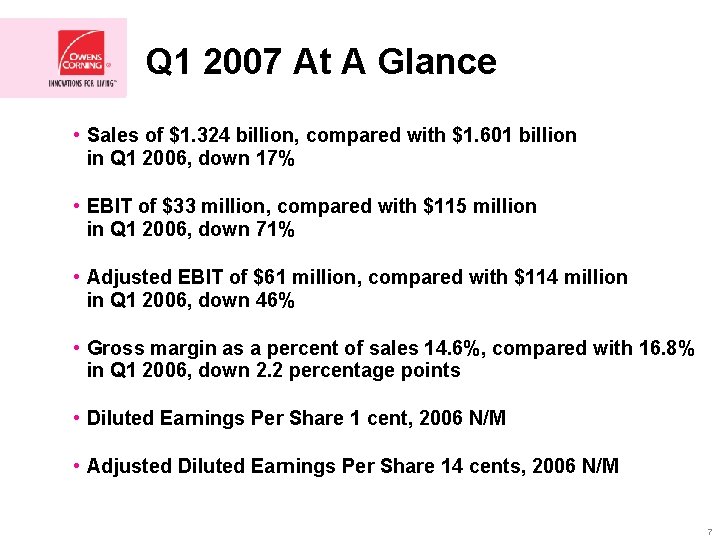
Q 1 2007 At A Glance • Sales of $1. 324 billion, compared with $1. 601 billion in Q 1 2006, down 17% • EBIT of $33 million, compared with $115 million in Q 1 2006, down 71% • Adjusted EBIT of $61 million, compared with $114 million in Q 1 2006, down 46% • Gross margin as a percent of sales 14. 6%, compared with 16. 8% in Q 1 2006, down 2. 2 percentage points • Diluted Earnings Per Share 1 cent, 2006 N/M • Adjusted Diluted Earnings Per Share 14 cents, 2006 N/M 7
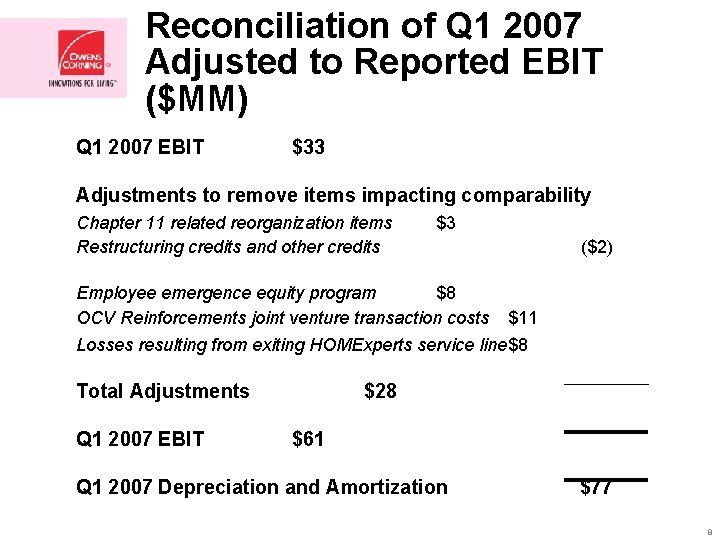
Reconciliation of Q 1 2007 Adjusted to Reported EBIT ($MM) Q 1 2007 EBIT $33 Adjustments to remove items impacting comparability Chapter 11 related reorganization items Restructuring credits and other credits $3 Employee emergence equity program $8 OCV Reinforcements joint venture transaction costs ($2) $11 Losses resulting from exiting HOMExperts service line$8 Total Adjustments Q 1 2007 EBIT $28 $61 Q 1 2007 Depreciation and Amortization $77 8
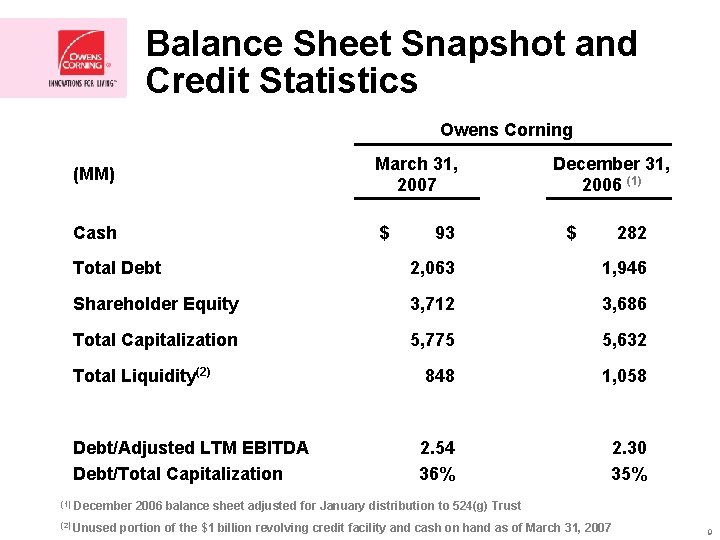
Balance Sheet Snapshot and Credit Statistics Owens Corning (MM) March 31, 2007 Cash $ $ 282 Total Debt 2, 063 1, 946 Shareholder Equity 3, 712 3, 686 Total Capitalization 5, 775 5, 632 848 1, 058 2. 54 36% 2. 30 35% Total Liquidity(2) Debt/Adjusted LTM EBITDA Debt/Total Capitalization (1) 93 December 31, 2006 (1) December 2006 balance sheet adjusted for January distribution to 524(g) Trust (2) Unused portion of the $1 billion revolving credit facility and cash on hand as of March 31, 2007 9
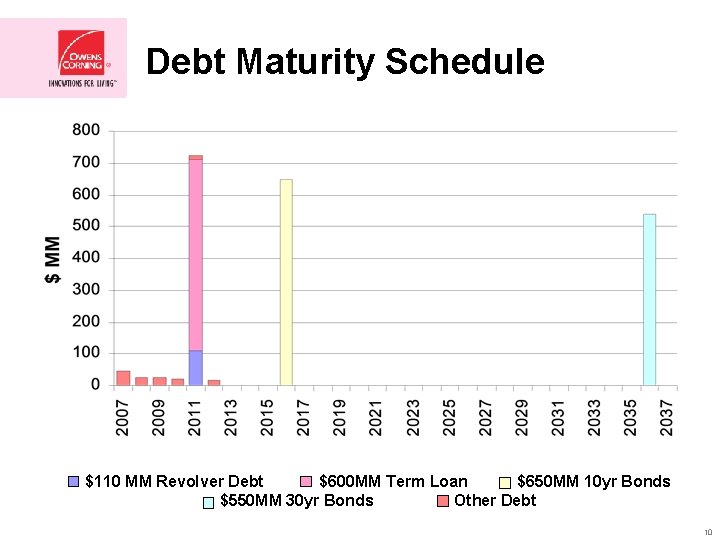
Debt Maturity Schedule $110 MM Revolver Debt $600 MM Term Loan $650 MM 10 yr Bonds $550 MM 30 yr Bonds Other Debt 10
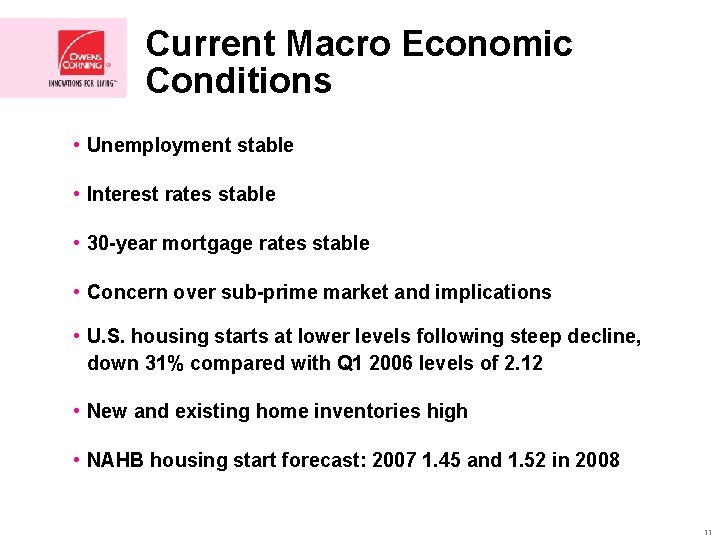
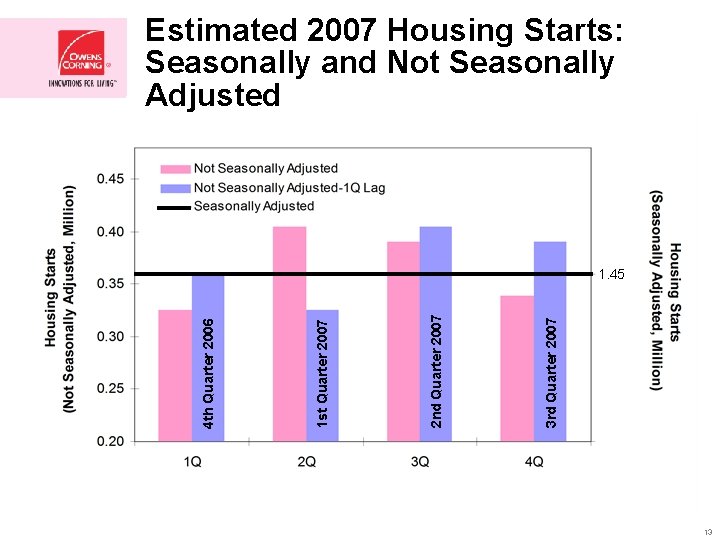
Current Macro Economic Conditions • Unemployment stable • Interest rates stable • 30 -year mortgage rates stable • Concern over sub-prime market and implications • U. S. housing starts at lower levels following steep decline, down 31% compared with Q 1 2006 levels of 2. 12 • New and existing home inventories high • NAHB housing start forecast: 2007 1. 45 and 1. 52 in 2008 11
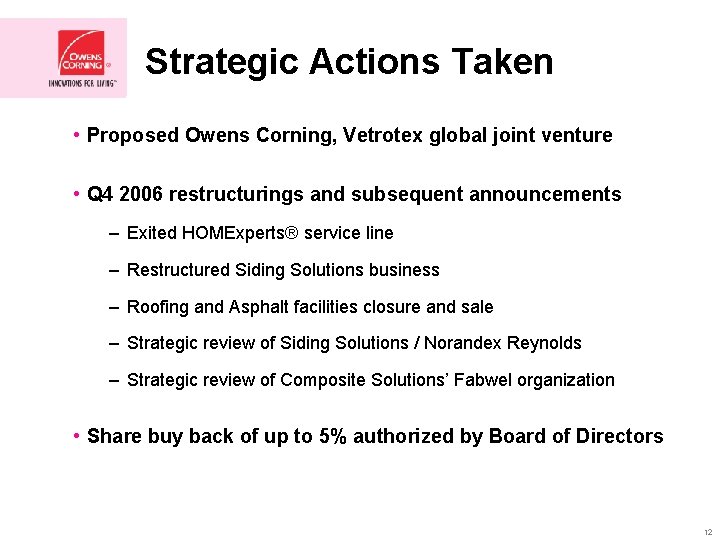
Strategic Actions Taken • Proposed Owens Corning, Vetrotex global joint venture • Q 4 2006 restructurings and subsequent announcements – Exited HOMExperts® service line – Restructured Siding Solutions business – Roofing and Asphalt facilities closure and sale – Strategic review of Siding Solutions / Norandex Reynolds – Strategic review of Composite Solutions’ Fabwel organization • Share buy back of up to 5% authorized by Board of Directors 12
Estimated 2007 Housing Starts: Seasonally and Not Seasonally Adjusted 3 rd Quarter 2007 2 nd Quarter 2007 1 st Quarter 2007 4 th Quarter 2006 1. 45 13
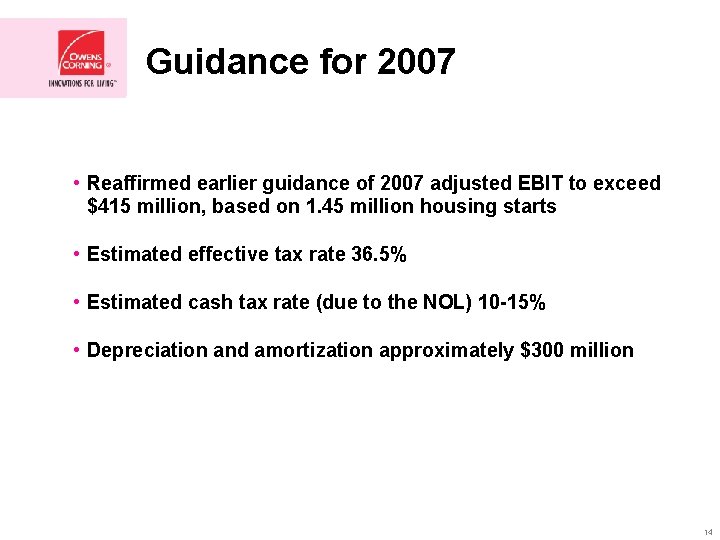
Guidance for 2007 • Reaffirmed earlier guidance of 2007 adjusted EBIT to exceed $415 million, based on 1. 45 million housing starts • Estimated effective tax rate 36. 5% • Estimated cash tax rate (due to the NOL) 10 -15% • Depreciation and amortization approximately $300 million 14
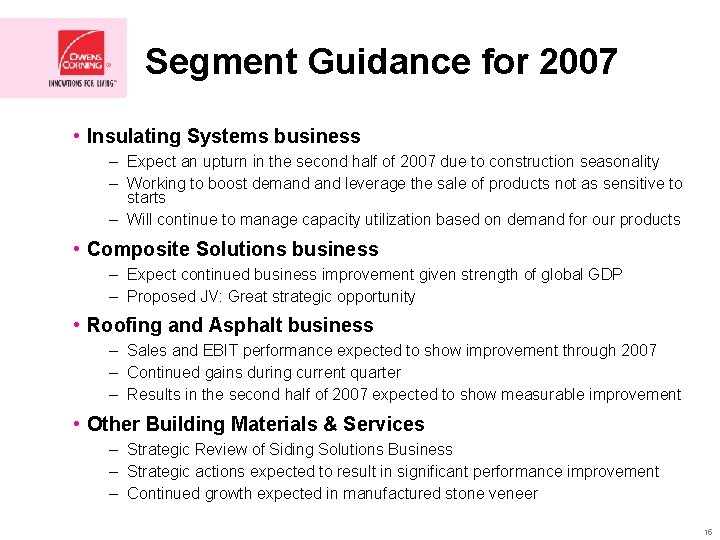
Segment Guidance for 2007 • Insulating Systems business – Expect an upturn in the second half of 2007 due to construction seasonality – Working to boost demand leverage the sale of products not as sensitive to starts – Will continue to manage capacity utilization based on demand for our products • Composite Solutions business – Expect continued business improvement given strength of global GDP – Proposed JV: Great strategic opportunity • Roofing and Asphalt business – Sales and EBIT performance expected to show improvement through 2007 – Continued gains during current quarter – Results in the second half of 2007 expected to show measurable improvement • Other Building Materials & Services – Strategic Review of Siding Solutions Business – Strategic actions expected to result in significant performance improvement – Continued growth expected in manufactured stone veneer 15
Financial Strategies • Financial performance and discipline – Strong operational Cash Flow to foster growth and innovation – Continued focus on Return on Net Assets in excess of Cost of Capital • Balanced use of Free Cash Flow – Maintain strong balance sheet and sustain investment-grade credit profile – Invest maintenance capital – estimated at 80% of depreciation – Invest remainder of depreciation to improve and grow operations – Focused and disciplined organic growth and acquisitions – Support shareholder returns 16
Housing Starts: A Long-Term View • NAHB Economic and Housing Forecast (2006) – Demographic trends and utilization of existing housing stock are likely to lead to production levels over the next decade that exceed the average during the last • Harvard University Joint Center for Housing Studies (2006) – Record levels of new construction and remodeling spending will be achieved during the next decade – Growth supports housing starts at average 1. 80 - 1. 85 million, net of manufactured housing 17
Managing Transition for Success • Chief Financial Officer • Chief Executive Officer 18
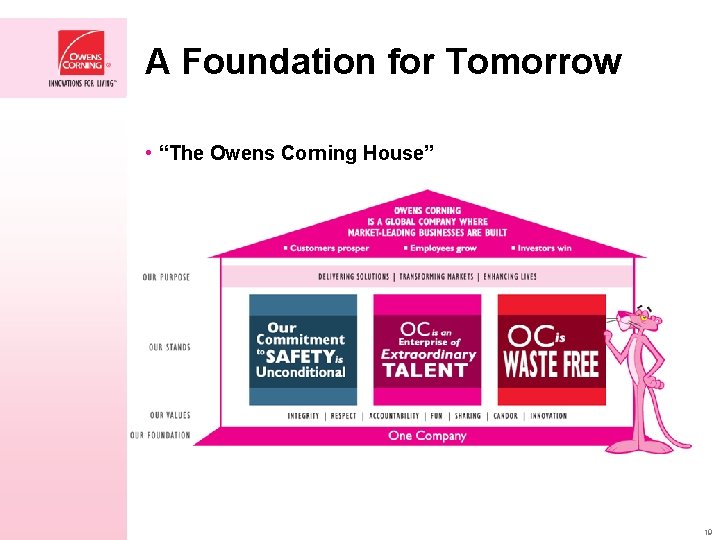
A Foundation for Tomorrow • “The Owens Corning House” 19