Executive Chairman Dr John Climax CEO Peter Gray


 Source:")

 RFP")


 Up 49% Yo. Y Up 38%")


 * Mid Point of")
 Q 4 ’")
 FY 2007 FY 2006 % Increase Net Revenue 631")

 May 31, 05 (Year) Net Cash")


 did")


")
 – Non-exclusive agreement • Phase")


 •")
")


 – Interactive Web Response (IWR) • Utilizes")


 has been in place for 8 years •")


 Since 2004: Increased emphasis on monitoring safety throughout the product")


 Publishing Systems (Core.")


 • Custom reagents from central source •")


 FILTERS TASK LISTS PROTOCOLS CODES FOR PROCESSING SERIES FOR PROCESSING")


- Slides: 182
Executive Chairman Dr. John Climax CEO Peter Gray ICON Central Laboratories President Bob Scott-Edwards ICON Development Solutions President Dr Thomas Frey VP Global IT Mike Mc. Grath ICON Contracting Solutions Global President Dr John Hubbard Commercial VP Bill Taaffe Snr VP Global BD Chief Executive Elizabeth Thiele Dr Ted Gastineau Brian O’Dwyer Snr VP Global Medical VP Corporate Training & Development Suzanne Gagnon Simon Holmes Corporate Development ICON Medical Imaging Eimear Kenny VP Market Development Ciaran Murray President Malcolm Burgess VP Strategic HR Anne Wesler Sean Leech Chief Financial Officer COO US VP Corporate QA Jo Coyle ICON Clinical Research VP Global Data Management Tom O’Leary
Executive Chairman Dr. John Climax CEO Peter Gray ICON Central Laboratories President Bob Scott-Edwards ICON Development Solutions President ICON Clinical Research Global President Dr John Hubbard Jo Coyle VP Global IT Mike Mc. Grath VP Strategic HR Eimear Kenny VP Corporate Training & Development Anne Wesler VP Market Development Simon Holmes Commercial VP Brian O’Dwyer President Sean Leech Dr Thomas Frey VP Corporate QA ICON Contracting Solutions COO US Malcolm Burgess Snr VP Global BD Elizabeth Thiele Snr VP Global Medical Suzanne Gagnon VP Global Data Management Tom O’Leary President Chief Financial Officer Ciaran Murray Corporate Development Bill Taaffe ICON Medical Imaging Chief Executive Dr Ted Gastineau
Forward Looking Statements Certain statements contained herein including, without limitation, statements containing the words “believes, ” “anticipates, ” “intends, ” “expects” and words of similar import, constitute forward-looking statements concerning the Company's operations, performance, financial condition and prospects. Because such statements involve known and unknown risks and uncertainties, actual results may differ materially from those expressed or implied by such forward-looking statements. Given these uncertainties, prospective investors are cautioned not to place undue reliance on such forward-looking statements. The Company undertakes no obligation to publicly update or revise any forward-looking statements, whether as a result of new information, future events or otherwise.
Global Full Service Clinical Development Global Clinical Q 4 Revenue by Region US 53% EU 38% ROW 9%
ICON’s Global Clinical Footprint North America 2 Countries 17 Offices >1, 900 Staff Eastern Europe / Russia 8 Countries 9 Offices > 350 Staff Japan 1 Country 2 Offices >80 Staff Western Europe / Africa 10 Countries 13 Offices >1, 600 Staff Asia Pacific 8 Countries 10 Offices >450 Staff Latin America 5 Countries 5 Offices >170 Staff Projects in 60+ Countries
Market Environment
Strong Market Environment with. . . • Continued R&D Spending Growth. – Phase II / III pipelines strengthening • Increased Outsourcing – Being accelerated by activity & funding in Biotech / Speciality – Globalisation of clinical research – New strategic thinking / cost containment • Increasing Regulation – More patients/ more studies – Post marketing surveillance 5
Preclinical Compounds in Development The Pipeline continued to fill in 2007 Up ≈ 23% Source: Pharmaprojects
Phase I Compounds in Development The Pipeline continued to fill in 2007 Up ≈ 22% Source: Pharmaprojects
Phase II/III Compounds in Development The Pipeline continued to fill in 2007 Up ≈ 14% Source: Pharmaprojects
US Biotech Funding Environment continued to grow $Billion Biotech fundraising (excluding debt financing) Source: Burrill and Company
ICON in this Market Environment
Gross RFP Value by Market Segment (Including RFPs that never progress to award) RFP Value by Market Segment 2007 Value Ø 54% Increase / PY Size of Projects Ø 41 > 20 Million Ø 168 > 5 Million Ø 959 < 5 Million 14
Strong RFP volume growth, with increasing average proposal value…
…which has led to increasing numbers of awards greater then $5 million.
Overall, Strong Gross Business wins has led to… ICON Gross Business Wins - Last 10 Quarters ($ millions)
. . excellent New Business wins and very strong book to bill ratios… Book to Bill Ratio Net Business Wins
…leading to record Total Backlog levels. ($ millions) Up 49% Yo. Y Up 38% Yo. Y
From this backlog, coverage of next 4 quarters revenues is robust……. . % coverage of next 4 quarters forecast revenues Value of backlog forecast to be earned in next 4 quarters
This has led to a diversified customer base…… Client Diversity 2005, 2006, 2007 - New Business by Customer Segment
…. and broad therapeutic expertise. Revenue by Therapeutic Area 2007
Strategy
ICON’s Core Strategy is Organic Growth, with acquisitions made to add new services or scale. Acquisitions to date - 11 • Revenues acquired $114 m • Staff acquired – 1, 100 • => Organic growth >80% Capitalise on market fundamentals to drive organic growth in all business units. Pursue acquisitions to enhance depth and scale of current operations and to additional complementary services e. g. Phase I - US Bioanalytical / Biomarkers Therapeutic specialists Safety / Phase IV Patient Recruitment Staffing Cross-sell services to grow sales and margin
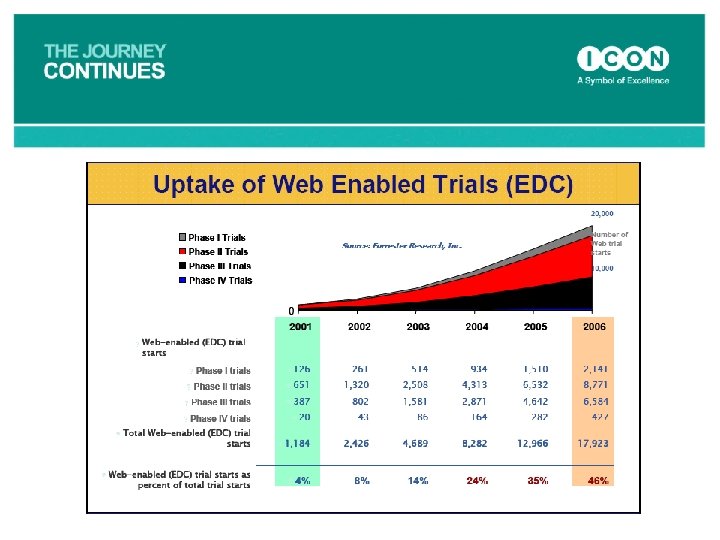
Key Strategic Trends • Strategic v Tactical Outsourcing – More large companies are seeking to use outsourcing strategically rather than tactically. – ICON fully engaged. • Globalisation – Growth in Eastern Europe, Latin America and Asia as a venue. – ICON growing rapidly in these regions • Greater Scientific Involvement – Customers seeking greater scientific input from CROs – ICON has added TAGS, IDS, Imaging, new Lab technologies etc. to respond. • EDC – Estimated that over 40% of clinical trials now use EDC – 49% of ICON’s Data Management activity in 2007 was EDC
Executive Chairman Dr. John Climax CEO Peter Gray ICON Central Laboratories President Bob Scott-Edwards ICON Development Solutions President ICON Clinical Research Global President Dr John Hubbard Jo Coyle VP Global IT Mike Mc. Grath VP Strategic HR Eimear Kenny VP Corporate Training & Development Anne Wesler VP Market Development Simon Holmes Commercial VP Brian O’Dwyer President Sean Leech Dr Thomas Frey VP Corporate QA ICON Contracting Solutions COO US Malcolm Burgess Snr VP Global BD Elizabeth Thiele Snr VP Global Medical Suzanne Gagnon VP Global Data Management Tom O’Leary President Chief Financial Officer Corporate Development Bill Taaffe Ciaran Murray ICON Medical Imaging Chief Executive Dr Ted Gastineau
Net Revenue CAGR of over 30% since 2002 22% Forecast for ‘ 08 % 2 R 3 G CA * Mid Point of 2008 Guidance issued December, 2007
Earnings Per Share Growth 6% 2 R G CA (E) * Mid Point of 2008 Guidance issued December 2007
Recent Financial Performance ($ millions, except EPS; includes stock option expense) Q 4 ’ 07 Q 4 ’ 06 % Increase Net Revenue 181 129 40% Direct Costs 100 73 37% 55 38 45% 5 _____ 4 _____ 37% _____ Operating Income 20 14 43% Operating Margin 11% 10. 7% 16 _____ 11 _____ 40% _____ 53 c 39 c 36% 29. 9 m 29. 1 m 2. 7% SG & A D & A Net Income EPS (Inc SFAS 123 R) Weighted Average no. of Shares (Inc SFAS 123 R)
Recent Financial Performance ($ millions) FY 2007 FY 2006 % Increase Net Revenue 631 456 38% Direct Costs 355 256 38% SG & A 188 137 38% 19 _____ 15 _____ 27% _____ Operating Income 69 48 45% Operating Margin 11% 10. 5% 56 _____ 38 _____ 46% _____ 188 c 133 c 41% 29. 7 m 28. 7 m 3. 5% D & A Net Income EPS (Inc SFAS 123 R) Weighted Average no. of Shares (Inc SFAS 123 R)
Margin improvement is a key focus • Approx. 25% of ICON’s business is generating single digit margins – Further margin growth in Lab – Improve performance from Phase I and Consultancy businesses – Bring Japan to higher profitability • Expand margins in Phase II – IV through leverage as growth moderates. • Currency Movements creating some “Headwinds” 5
Summary Balance Sheet and Cash Flow ($ millions) May 31, 05 (Year) Net Cash Dec 31, 05 (7 mths) Dec 31, 06 (Year) Dec 31, 07 (Year) $78. 4 $82. 3 $98 $23. 8 Total assets $347. 6 $349. 1 $476. 3 $693. 1 Shareholder’s equity $233. 1 $241. 6 $302. 7 $388. 4 Cashflow from operations $23. 8 $11. 7 $51. 5 $42. 9 Capital expenditures $15. 6 $12. 1 $31. 5 $75. 4 CAPEX Excl. Dublin Extn. $15. 6 $12. 1 $20. 4 $36. 8 27. 8 28. 0 28. 5 28. 8 Shares outstanding
Executive Chairman Dr. John Climax CEO Peter Gray ICON Central Laboratories President Bob Scott-Edwards ICON Development Solutions ICON Clinical Research ICON Contracting Solutions President Global President Dr Thomas Frey VP Corporate QA Jo Coyle VP Global IT Mike Mc. Grath VP Strategic HR Eimear Kenny VP Corporate Training & Development Anne Wesler VP Market Development Simon Holmes Sean Leech Chief Financial Officer Ciaran Murray President Corporate Development Bill Taaffe Dr John Hubbard ICON Medical Imaging Commercial VP Brian O’Dwyer COO US Chief Executive Malcolm Burgess Dr Ted Gastineau Snr VP Global BD Elizabeth Thiele Snr VP Global Medical Suzanne Gagnon VP Global Data Management Tom O’Leary
The Globalisation of Clinical Research: Challenges and Opportunities in Argentina, Brazil, Russia, China and India John W. Hubbard, Ph. D. , FCP Global President, ICON Clinical Research
Products in Development by Therapeutic Area Source – Bio. Pharm. Insight. com, 2007
Pharma & Device Industry Challenges Trend Cost per trial Cost of clinical development Driver Cost per patient • Treatment naïve patients Cost per investigator • Qualified investigators Complexity of protocols • Number of procedures, and type of inclusion/ exclusion criteria Infrastructure cost • Number and size of trials • Regulatory requirements Global trend for higher costs, more patients and experienced clinical investigators! Source Mc. Kinsey 2004
Why Conduct Global Clinical Trials? • Access to treatment naïve patients, or patients who have only been treated with older medications • Emergent disease populations, e. g. , Type II diabetes, treatment resistant infections such as HIV, tuberculosis, hepatitis B & C, and various forms of cancer, and cardiovascular disease • Cost and time benefits: Faster patient recruitment and lower cost base • Since 1990, global clinical research has grown from 28 to 79 countries and the amount of FDA regulated research has increased 16 -fold • ICH E 5 regulations allow the use of foreign data in new drug submissions Pharmafocus. Asia, 2005
Drivers of Country Selection • Medical practice • Regulatory process • Commercial and post-marketing value • Cost of the trial • Disease demographics • Speed of enrollment • Quality, quality Quality is the key driver: If a country cannot deliver quality, all other benefits are irrelevant
ICON’s Global Clinical Footprint Eastern Europe / Russia 8 Countries 9 Offices 339 Staff North America 2 Countries 17 Offices 1896 Staff Japan 1 Country 2 Offices 72 Staff Western Europe / Africa 10 Countries 13 Offices 1554 Staff Asia Pacific 8 Countries 10 Offices 448 Staff Latin America 5 Countries 5 Offices 166 Staff Projects in 60+ Countries
Key Countries for Clinical Trials Based on the Overall Country Attractiveness Index 1 6. 88 4. 90 5. 26 5. 55 5. 58 6. 10 1 A. T. Kearney Attractiveness Index , Pharmaceutical Executive Supplement, 2006
Clinical Research in Russia, Argentina, Brazil, China and India: Opportunities and Challenges
ICON’s Clinical Trial Experience in Russia Country Russia Office Locations Services Moscow / Novosibirsk Clinical Operations, Regulatory/EC/submissions, Current Staff by 2010 >80 250 - 300 Number of Ongoing Studies ~50
Russia: Opportunities and Challenges • Opportunities – Population of more than 142 million, with only 274 ongoing multi-national clinical trials (only 5% of the clinical research potential) – Large urban hospitals and medical centers – 768 Clinical sites registered by the Federal Service for Healthcare and Social Development in the Russian Federation – High average patient enrollment rates of 4. 7 patients/site/month – FDA has conducted 36 audits since 1995 and ranks #1 in quality amongst other E 7 countries – Low cost relative to Western EU and the US – Relatively straight forward regulatory and clinical site contracting process • Challenges – New regulatory requirements regarding the shipment of blood, DNA, and tissue samples – Rapidly maturing marketplace Sources: UBC International Clinical Trials, 2007
Russia versus U. S. in Clinical Research Key Features of a Clinical Trial U. S. Russia Medium High No. of patients with tropical diseases Low Speed of recruiting patients for trial Low-Medium Very High Speed of conducting a trial Medium High Follow-up rate of patients Medium High Very High Medium-High Awareness of ICH GCP guidelines Very High Availability of technology to streamline trials Very High Medium-High Low-Medium No. of patients across urban life style diseases Number of qualified doctors and clinicians Heterogeneous populations Regulatory & ethical issues and barriers Key: Red color = An area of development or current limitation.
ICON’s Clinical Trial Experience in Latin America Country Office Locations Services Current Staff by 2010 Number of Ongoing Studies Argentina Buenos Aires Clinical Monitoring / Project Management / Regulatory Submissions / Pharmacovigilance 73 145 43 Brazil Sao Paulo Clinical Monitoring / Project Management / Regulatory Submissions 33 90 30 Mexico / Chile / Peru Capital Cities Clinical Monitoring / Project Management / Regulatory Submissions 60 150 >40
Latin America: Opportunities and Challenges • Opportunities – The seven main Latin American markets add up to 448 million people with a GDP of US $2. 5 trillion in 2006. • Highly concentrated: 70% urban / mega-cities • Only two main languages • Counter-season enrollment in Southern Hemisphere – Led by Mexico, Brazil and Argentina, they are expected to represent a market value of US $52 billion at retail prices by 2011. Sources: Espicom / PWC
Latin America: Opportunities and Challenges – Between 1995 & 2000, the number of clinical trials executed in the region rose by a factor of ten. • High quality of medical practice and experienced clinical investigators • Growing clinical trails sector – Development of dedicated CT sites, ERBs, SMOs – Expansion of CROs and Pharma clinical operations – Availability of GCP/CRA/SC training Courses – Support services: central labs, CTM logistics, QA consultants • Challenges – Regulatory agencies are “stretched” due to lack of resources to meet the clinical trial demand – Longer regulatory start-up in some countries (e. g. , Brazil) – Evolving regulatory environment – Some agencies are recognizing the need to adapt their regulations harmonization initiatives, which could enhance the attractiveness of the region Sources: Espicom / PWC
Latin America versus U. S. in Clinical Research Key Features of a Clinical Trial U. S. Latam No. of patients across urban life style diseases Medium No. of patients with tropical diseases Low High Speed of recruiting patients for trial Low-Medium High Speed of conducting a trial Medium Follow-up rate of patients Medium High Number of qualified doctors and clinicians Very High Medium Heterogeneous populations High Medium Awareness of ICH GCP guidelines Very High Availability of technology to streamline trials Very High Medium Regulatory & ethical issues and barriers Low Medium Key: Red color = An area of development or current limitation.
ICON’s Experience in India and China Services Current Staff Projected Staff by 2010 Number of Ongoing Studies Beijing / Hong Kong Clinical Operations, Regulatory, Consulting 22 130 16 Chennai Bangalore Clinical Operations, Data Management, Biostatistics, IVRS, Pharmacovigilance, Medical Imaging 350 550 -600 20 Country Office Locations China India
China: Opportunities and Challenges • Opportunities – Homogenous population of 1. 3 billion – Increasing incidence and prevalence of infectious diseases, cancer, and metabolic disorders – History of pharmaceutical usage – Clinical Trial Site Management Regulation enacted in 2004 • Only GCP-certified sites were approved to conduct clinical trials – Centralized medicine: 80% of medical resources are in large cities – Strong commercial pharmaceutical market approaching $75 billion by 2010
China: Opportunities and Challenges • Challenges – Slow to accept ICH/GCP requirements – High demand for limited resources – Inexperienced clinical investigators may under report AEs/SAEs – Long regulatory approval to initiate clinical trials (6 -12 months) – All regulatory documents must be translated into Chinese and local dialects may be a challenge – Restricted export of whole blood – Lab analysis and clinical chemistries need to be conducted in the country – Logistical challenges: Time and costs may be higher than other locations
China versus U. S. in Clinical Research Key Features of a Clinical Trial U. S. China No. of patients across urban life style diseases Medium Very High No. of patients with tropical diseases Low Very High Speed of recruiting patients for trial Low - Medium Very. High Speed of conducting a trial Medium Follow-up rate of patients Medium - High Number of qualified doctors and clinicians Very High Low - Medium Heterogeneous populations High Low Awareness of ICH GCP guidelines Very High Low Availability of technology to streamline trials Very High Medium Regulatory & ethical issues and barriers Low High Key: Red color = An area of development or current limitation.
India: Opportunities and Challenges • Intellectual Property Changes – India Patent Act (1970) did not recognize pharmaceutical patents – India agreed to uphold the Trade-Related Intellectual Property Rights (TRIPS) agreement in 1995 and committed to enforcement by 2005 – Significant expansion of local pharmaceutical and bulk chemical manufacturing Source: Pharmaceutical Manufacturing and Packing Sourcer, 2006
India: Opportunities and Challenges • Opportunities – – – – Large English speaking Caucasian population (> 1. 1 billion) Educated and cost-effective workforce Nearly 700, 000 hospital beds 221 Medical colleges Robust IT infrastructure FDA has accepted data from India in large pivotal trials Improving regulatory approval times for study start-up (12 -18 weeks) $100 million market in 2007 for clinical trials outsourced to India growing to $1. 1 - $1. 5 billion by 2010 Source: Pharmaceutical Manufacturing and Packing Sourcer, 2006
India: Opportunities and Challenges • Challenges – Concerns over quality of patient data – High demand for limited resources and experienced clinical investigators – Large patient populations are dispersed throughout the country – Infrastructure across the country is under developed – Less desirable market place for pharmaceutical companies to commercialize products • Low health insurance coverage • Limited consumer purchasing power • Controlled drug-pricing • Entrenched generic market
India versus U. S. in Clinical Research Key Features of a Clinical Trial U. S. India No. of patients across urban life style diseases Medium Very High No. of patients with tropical diseases Low Very High Speed of recruiting patients for trial Low-Medium Very High Speed of conducting a trial Medium Very High Follow-up rate of patients Medium Very High Number of qualified doctors and clinicians Very High Medium – High Heterogeneous populations High Awareness of ICH GCP guidelines Very High Low – Medium Availability of technology to streamline trials Very High Low - Medium Regulatory & ethical issues and barriers Low Medium - High Key: Red color = An area of development or current limitation.
• Case Study: Study No 2: Phase II/III study Type 2 Diabetes-1 protocol
Diabetes Estimates in Emerging Countries Source: World Health Organization & Contract Pharma, May 2007
Regional Performance US Israel Argentina India Total Screened 245 215 239 477 1176 Run-In 106 142 140 305 693 Randomized 46 85 84 181 396 Completed 42 78 74 169 363
In Conclusion…. • Globalization of clinical trials is accelerating and will continue to develop in regions such as Eastern Europe, Latin America, and Asia. Pacific (India, and China) • There are many challenges and opportunities that must be addressed as the market matures in these regions • This represents a huge opportunity for CROs who have a global structure and capability to conduct trials in these regions • ICON is well positioned in these locations and will continue to expand its global clinical development capabilities to meet our client’s needs
Executive Chairman Dr. John Climax CEO Peter Gray ICON Central Laboratories President Bob Scott-Edwards ICON Development Solutions President Dr Thomas Frey VP Corporate QA Jo Coyle VP Global IT Mike Mc. Grath VP Strategic HR Eimear Kenny VP Corporate Training & Development Anne Wesler VP Market Development Simon Holmes Commercial VP Brian O’Dwyer ICON Clinical Research ICON Contracting Solutions Global President Dr John Hubbard COO US Malcolm Burgess Snr VP Global BD Elizabeth Thiele Snr VP Global Medical Suzanne Gagnon VP Global Data Management Tom O’Leary Sean Leech Chief Financial Officer Ciaran Murray President Corporate Development Bill Taaffe ICON Medical Imaging Chief Executive Dr Ted Gastineau
CRO Marketplace Dynamics Elizabeth Thiele Sr. Vice President Global Business Development ICON Clinical Research
Why is Growth so High for CROs… “Large Pharma & Biotech are Searching for Ways to Stretch R&D Funds & Small Biotech/Emerging Pharma are Holding onto their Assets Longer” • Increased Number of Strategic Outsourcing Initiatives – Reduced Oversight Models – Use of Low Cost Regions for Process Rich Services – Implementation of Alternative Study Execution Methodologies – Integration of Technology Based Information Management Systems • Growing Number of Global Projects Across All Market Segments
RFP Flow by Market Segment 2007 Volume Ø 500+ RFIs Ø 1100+ RFPs - 38% Increase / PY - Program vs. Project - 32% Multi-Region 66
RFP Value by Market Segment 2007 Value Ø 54% Increase / PY Size of Projects Ø 41 > 20 Million Ø 168 > 5 Million Ø 959 < 5 Million 67
RFP Flow by Participating Region 68
RFP Value by Participating Region 69
Why is Growth so High for CROs… “With Large Pharma & Biotech Searching for Ways to Stretch R&D Funds & Small Biotech/Emerging Pharma Holding on their Assests Longer” • Increased Number of Strategic Outsourcing Initiatives – Reduced Oversight Models – Use of Low Cost Regions for Process Rich Services – Implementation of Alternative Study Execution Methodologies – Integration of Technology Based Information Management Systems • Growing Number of Global Projects Across All Market Segments • Incremental Number of Requests for Feasibility Related to Study Design and/or Available Patients • Greater Demand for Regulatory Support Services • Overall Demand for “Scientific” Input
Observations in the Post Approval Arena… • Three-fold Increase in the Number of RFIs Overall & a Specific Interest in the Universe of Post-approval Services at ICON • Emerging RFIs Related to “Risk Minimization Action Plan” Development (starting approximately 1 Q 07) • Increased Number of RFIs & 75% Increase in RFPs for 2007 Related to Stand-alone Safety & Pharmacovigilance Work • Increase in the Number of RFIs & RFPs for Assistance with Epidemiological Design & Analysis • Increase in the Number of RFPs for Registries, Particularly Originating in Europe
Executive Chairman Dr. John Climax CEO Peter Gray ICON Central Laboratories President Bob Scott-Edwards ICON Development Solutions President Dr Thomas Frey VP Corporate QA Jo Coyle VP Global IT Commercial VP Brian O’Dwyer ICON Clinical Research ICON Contracting Solutions Global President Dr John Hubbard COO US Malcolm Burgess Snr VP Global BD VP Strategic HR Elizabeth Thiele Eimear Kenny Snr VP Global Medical Suzanne Gagnon Anne Wesler VP Market Development Simon Holmes Ciaran Murray President Corporate Development Bill Taaffe ICON Medical Imaging Chief Executive Mike Mc. Grath VP Corporate Training & Development Sean Leech Chief Financial Officer VP Global Data Management Tom O’Leary Dr Ted Gastineau
Global Data Management and EDC Thomas O’Leary Vice President Global Head of Data Management ICON Clinical Research
EDC Adoption in the Market Place • What is driving Electronic Data Capture (EDC) Adoption – – Number of clinical procedures quadrupled in last 20 years Data more complex, speed of availability is critical Paper based processes not scalable 2005: Watershed year for EDC Market • Two Enterprise-level leaders emerge in the market place – 2006: Crossing the Chasm • Industry switched their concerns about not being first to not being last • Where is EDC headed (2008 -2011) – Spending expected to exceed $3. 1 billion – Average time to deploy study will be halved
EDC Capabilities at ICON • Medidata Rave™ (February 2005) – Non-exclusive agreement • Phase Forward Inform™ (January 2007) – Rave™ and Inform™ dominated 2007 (about 40% of market each) – Allows us to cover the majority of our EDC committed client base • Oracle Clinical OC RDC™ (Dec 2007) – Oracle have invested heavily in order to establish market share – Specific clients committed due to heritage • Niche products emerging (eg Phase I, Late Phase/registry trials) – Medidata and Phase Forward specific products for early and late phase requirements. – ICON has agreed partnerships with two niche providers – ICON extends clinical reach with such providers • Recognised as CRO who understands optimal use of technology
EDC Adoption Metrics • In the last 4 years – ICON has won 6 times as many EDC projects than pre 2003 – EDC Wins have more than doubled year on year • 8 wins in 2004, 17 wins in 2005, 38 wins in 2006, 79 wins 2007 – Requests for proposals featuring EDC comprised about 52% of our portfolio at the end of 2007 (<1% in 2003) – Currently over 33% of our projects are using EDC, this is projected to reach 45 -50% by the end of 2008, 85 -90% by 2010 • Current EDC project portfolio – 116 ongoing EDC studies (plus 37 completed studies) • 77 studies in Medidata Rave™ • 22 studies using Phase Forward Inform™ • 17 studies using other EDC systems (client mandated)
Data Management Locations Edinburgh Dublin San Francisco Marlow Philadelphia Hong Kong North Carolina Chennai
Data Management Headcount Position East Coast West Coast Europe India Support Offices Global Total DM Project Managers 31 5 24 3 1 64 Data Coordinators /EDC Analysts 123 14 80 48 0 265 Data Entry Specialists / EDC Testers 24 0 6 53 0 83 Medical Coders 3 1 3 2 0 9 DBAs / EDC Study Builders 16 4 15 15 2 52 Total Staff 197 24 128 121 3 473
Data Management Metrics 2007 • Databases set up – 96 (EDC = 29%) • Edit checks programmed – 89, 504 • CRF pages processed – 3, 189, 323 (EDC = 49%) • DM Queries processed – 352, 169 • All Queries processed – 472, 206 • Medical terms coded – 437, 111 • Databases closed (final) – 67 • Audits Performed – 30
Technology & Capabilities • Electronic Data Capture – Medidata Rave™ (v 5. 6. 1) – Phase Forward In. Form™ (v 4. 5) – Oracle Clinical RDC ® (v 4. 5. 2) • Oracle Clinical® (v 4. 0. 3, 4. 5. 1) • Data. Fax™(v 3. 7) • Clintrial™ (v 4. 4) • • Opt. ICON (Integic) - CRF Scanning & Workflow Manager ICONet – Web Portal Application • • ICOSaurus – coding application SAS (8. 2, 9. 1. 3) Frame. Maker (v 8. 0) - CRF design, structured (XML) E-Diaries (CRF Inc & PHT & Invivodata)
Technology & Capabilities Integration with other ICON systems
Executive Chairman Dr. John Climax CEO Peter Gray ICON Central Laboratories President Bob Scott-Edwards ICON Development Solutions President Dr Thomas Frey VP Corporate QA Jo Coyle VP Global IT Mike Mc. Grath VP Strategic HR Eimear Kenny VP Corporate Training & Development Anne Wesler VP Market Development Simon Holmes Commercial VP Brian O’Dwyer ICON Clinical Research ICON Contracting Solutions Global President Dr John Hubbard COO US Malcolm Burgess Snr VP Global BD Elizabeth Thiele Snr VP Global Medical Suzanne Gagnon VP Global Data Management Tom O’Leary Sean Leech Chief Financial Officer Ciaran Murray President Corporate Development Bill Taaffe ICON Medical Imaging Chief Executive Dr Ted Gastineau
IVR in Clinical Trials & the impact of technology on CR Malcolm Burgess Chief Operating Officer, U. S. Operations ICON Clinical Research
IVR/IWR Defined • Interactive Voice Response (IVR) – Interactive Web Response (IWR) • Utilizes telephone to collect data – Mobile or landline • Technology used in many different industries – Banking, IT support, etc • IVR usage in Clinical trials – Been around for 25 years – IWR more recently adopted • Modern IVR systems integrated with IWR – Allows users to select interface that works best for them
IVR/IWR in Clinical Trials • Low cost solution for simple data entry • Enrollment and Randomization – Prevents over recruitment – Can also be used to recruit patients • Dispensing pharmaceuticals drugs – according to need or type of clinical trial • Used to record complete clinical trial data about the recruitment of subjects • Can be integrated with other tools to manage the clinical study data (CTMS, EDC, etc) • Maintain a record of drug accountability – Dispensed, used, returned, etc • Patient Reported Outcomes – Improves Quality and Integrity of data
IVR/IWR Cost Saving Advantages • Enrollment – Reduced costs due to over-enrollment of patients • Randomization – Supports complex randomization and Adaptive trials • Drug Management – Reduce costs of drug due to less waste • Patient Report Outcomes – Improve quality and integrity of the data collected
Electronic Patient Report Outcomes • IVR can be used for Electronic Patient Report Outcomes (e. PRO) – FDA mandates and guidance will drive the number trials requiring e. PRO up significantly • None of the implementation costs associated with handheld e. PRO solution • PRO can be submitted using the IVR or IWR concurrently • Low cost, Global, Multilingual solution
ICON IVR Metrics • Current IVR project portfolio – 325 active IVR projects – >650 projects launched sinception in March 2000 • Growth since 2006 – 90% increase in per study revenue – 105% increase in total awards • Staff – 235 global staff – 35 staff in Chennai providing back end support
ICON Global Reach Dublin Marlow Chicago Philadelphia Houston Raleigh Chennai “ 200+ ICOPhone dedicated staff worldwide"
ICON Advantage • ICON solution (ICOPhone) has been in place for 8 years • Utilized in over 650 clinical trials • Integrates with all major CTMS and EDC platforms • Combines IVR and IWR in a seamless package • All data is available real-time for decision making • New technology release – EDGE – Reduce timelines for setup by 50%
So where is the technology taking us …… • Changing the paradigm of Clinical Research – Site Monitors more focused on … • Site Management • Representing the client rather than monitoring the data – Data Flow accelerated • • Direct data collection from site/patient (eg EDC, e. PRO) On-line (instead of on-site) data review Majority of query & study management done remotely Real time data access and decisions (adaptive designs) – Reduced classical Data Management • No data entry, minimal manual queries – reduced workload • More focus on holistic ‘clinical management’ of the study • More focus on technology, less of a commodity • But slowly – many still think in the paper paradigm
Executive Chairman Dr. John Climax CEO Peter Gray ICON Central Laboratories President Bob Scott-Edwards ICON Development Solutions President Dr Thomas Frey VP Corporate QA Jo Coyle VP Global IT Commercial VP Brian O’Dwyer ICON Clinical Research ICON Contracting Solutions Global President Dr John Hubbard COO US Malcolm Burgess Snr VP Global BD VP Strategic HR Elizabeth Thiele Eimear Kenny Anne Wesler VP Market Development Simon Holmes Ciaran Murray President Corporate Development Bill Taaffe ICON Medical Imaging Chief Executive Mike Mc. Grath VP Corporate Training & Development Sean Leech Chief Financial Officer Snr VP Global Medical Suzanne Gagnon VP Global Data Management Tom O’Leary Dr Ted Gastineau
Developments in Pharmacovigilance Suzanne Gagnon Snr VP Global Medical Affairs & Drug Safety ICON Clinical Research
Developments in Pharmacovigilance (PV) Since 2004: Increased emphasis on monitoring safety throughout the product life cycle – Recent withdrawals of several marketed products – Increased scrutiny of Regulatory Agencies – Lack of enforcement of Phase IV commitments – Impression that FDA was not adequately protecting the public health – Need to respond
Regulatory Agencies’ Response • FDA’s – Office of Drug Safety – Office of Surveillance and Epidemiology • Task Forces – IOM’s 2006 Report on the Future of Drug Safety – Promoting and Protecting the Health of the Public • Guidance Documents • Risk Management • European Directive on Pharmacovigilance • Increased Safety Audits
Pharmaceutical Companies’ Response • Phase IV clinical trials, observational studies, safety registries • Data basing of legacy cases • Risk Minimization Plans (Risk. MAPs) – Increased outsourcing – FSP model for safety – Total product safety support • Case processing • Signal detection and analysis • Drug Information and product complaints • Regulatory report writing
ICON’s Response 2004… 2008… Global Headcount: 68 Global Headcount: 392 Safety Management: 10 Safety Management: 28 Safety Centers WW: 3 Safety Centers WW: 5 Stand Alone Projects 3 Stand Alone Projects: Value Largest Project $350 K 16 Value Largest Project: $ >30 M
ICON Global Safety Portfolio 2004
ICON Global Safety Portfolio 2007
ICON’s 2008 Plan for Drug Safety • Safety Alliance within ICON – Medical Affairs and Drug Safety (Case Processing) – Lifecycle Sciences Group (Registries) – Development Solutions (Consulting) – Medical Imaging (Endpoints) – Biostatistics (Signal Detection and Analysis, DSMBs) – Call Center (Safety Reporting, Drug Information, Product Complaints) – Regulatory Affairs • Global Safety Marketing Campaign • Total Product Safety Solution
Off-shoring to Low Cost Markets 2008 • Only certain clients want low cost options off-shore for PV • Services to be off-shored vary – Case processing – Safety Narratives – Call Center activities • Not all PV services off-shored easily • Technology enables seamless interaction between ICON Safety Centers • Training within the cultural framework is key • Currently 48 Medical Affairs and Drug Safety staff in Chennai, India • Plan to increase to > 100 by end of 2008 as workload increases
Executive Chairman Dr. John Climax CEO Peter Gray ICON Central Laboratories President Bob Scott-Edwards ICON Development Solutions President Dr Thomas Frey VP Corporate QA Jo Coyle Commercial VP Brian O’Dwyer ICON Clinical Research ICON Contracting Solutions Global President Dr John Hubbard COO US Malcolm Burgess Elizabeth Thiele Mike Mc. Grath VP Strategic HR Snr VP Global Medical Eimear Kenny Suzanne Gagnon VP Corp Training & Development VP Global Data Management Anne Wesler Tom O’Leary VP Market Development Simon Holmes Ciaran Murray President Corporate Development Bill Taaffe ICON Medical Imaging Chief Executive Snr VP Global BD VP Global IT Sean Leech Chief Financial Officer Dr Ted Gastineau
Jo Coyle VP Quality Assurance ICON plc
Agenda § § ICON’s quality framework and philosophy Internal QA Program Client and Regulatory focus The year ahead
Quality is our Focus
ISO 9001: 2000 Registered External assessment of ICON’s Global Quality System • Group registration for the whole company § Annual random surveillance audits across regional offices to monitor compliance - audit frequency is based on office size and number of services § All new offices independently audited to attain registration • 2007 audit program § USA: PA, FL, NC, CA-Irvine, CA-Redwood City § Europe: IRL, GER, SWE, RUS, HUN, § ROW: South Africa, CAN, MEX*, ARG (*new offices registration audit) The following accreditations are maintained by ICON Laboratories § ISO 17025 § CAP accreditation § CLIA (New York facility only)
Quality is our focus… ICON Internal QA Audits – 2007 Division US EU ROW Total ICR 221 154 50 425 ICL 54 22 0 76 IDS 30 220 0 250 IMI 23 0 0 23 Corporate system audits 18 43 28 89 346 439 78 863
…Clients check it… Client, Regulatory and ISO Audits – 2007 Division Sponsor ICR 148 ICL 41 IDS 31 IMI 18 238
…Regulatory Agents inspect it… Office Date Region Auditing Authority Outcome Redwood City, CA Oct 2003 US FDA No findings (no FDA 483) New York City, NY Mar/Apr 2005 US FDA No findings (no FDA 483) North Wales, PA May 2005 US FDA No findings (no FDA 483) Nashville, TN Oct/Nov 2005 US FDA No findings (no FDA 483) North Wales, PA Dec 2005 US FDA No findings (no FDA 483) Nashville, TN Jan 2006 US FDA No findings (no FDA 483) Eastleigh, UK Oct 2004 EU MHRA No critical findings Dublin, Ireland Apr 2005 EU IMB No critical findings Eastleign/Marlow, UK Sept 2007 EU MHRA No critical findings Frankfurt. Germany Sept 2007 EU Local regulatory authority: RP Darmstadt No critical findings Singapore Oct 2005 ROW HSA - Health Services Authority of Singapore No critical findings
…and Third Parties validate it… Survey Year Comments William Blair / Pharma. Mediation 2004 Top CRO for quality and execution. Center. Watch Survey of Investigative Sites 2005 Top 3 CRO for Investigator relationships and site management. Frost Sullivan 2006 Top 3 CRO for timely database lock and key attributes of overall quality, personnel expertise, therapeutic expertise, and project turnaround. Frost Sullivan 2007 North American Service Provider of the Year Thomson Center. Watch and William Blair 2007 Vendor you most prefer working with based on quality. Lehman Brothers 2007 Top CRO for quality of global execution. SGS – ISO Audit Annual Passed without significant comments since 1992
Quality plans for the year ahead… • Integration of new US Phase I facility into Quality System • Development of the Quality System in new ICON offices • New ISO registrations in IMI, Brazil, Bangalore and Italy • Acquire new MHRA Supplementary accreditation for Phase 1 units (UK) • Implementation of electronic QA system - improve efficiency in internal audit process • Expansion of audit program in ROW region
Executive Chairman Dr. John Climax CEO Peter Gray ICON Central Laboratories President Bob Scott-Edwards VP Corporate QA ICON Development Solutions President Dr Thomas Frey Jo Coyle ICON Clinical Research ICON Contracting Solutions Global President Dr John Hubbard COO US Malcolm Burgess VP Global IT Mike Mc. Grath VP Strategic HR Commercial VP Brian O’Dwyer Anne Wesler Group Director Market Development Simon Holmes Ciaran Murray President Corporate Development Bill Taaffe ICON Medical Imaging Chief Executive Snr VP Global BD Elizabeth Thiele Eimear Kenny VP Corporate Training & Development Sean Leech Chief Financial Officer Snr VP Global Medical Suzanne Gagnon VP Global Data Management Tom O’Leary Dr Ted Gastineau
Thomas Frey President ICON Development Solutions
Expeditious Drug Development – Enhanced Decision Making Regulatory Strategy Development Plan IND/CTA Clinical Pharmacology Proof Of Concept
Expeditious Drug Development – Enhanced Decision Making Regulatory Strategy Scientific Consulting Pre-clinical CMC Formulation Development Target Product Profile
Expeditious Drug Development – Enhanced Decision Making Development Plan Scientific Consulting Phase I Development Plan & Protocol Design Proof Of Concept Study Design Outline Of Phase II & III Non-Clinical Development Plan Cost Of Development
Expeditious Drug Development – Enhanced Decision Making IND/CTA Regulatory Affairs Pre-IND Meeting/Regulatory Advice IND Compilation Paper & Electronic Submissions Annual Updates
Expeditious Drug Development – Enhanced Decision Making Clinical Pharmacology Phase I Full Range of Regulatory Pharmacokinetic Special Populations Studies PK/PD Studies – Pharmacodynamic Models Bioanalytical & Immunoassay Analysis PK/PD Analysis, Modeling & Simulations Data Management, Statistics, Medical Writing
Expeditious Drug Development – Enhanced Decision Making Proof Of Concept Phase IIa Planning, Management & Execution Of Targeted Proof of Concept Studies Bioanalytical & Immunoassay Analysis PK/PD Analysis, Modeling & Simulations Data Management, Statistics, Medical Writing
Expeditious Drug Development – Enhanced Decision Making NONMEM - NONlinear Mixed Effects Model-base analyses – Developed at the University of California, San Francisco – Licensed to end-users by ICON Development Solutions – Used worldwide in drug development to quantify exposure (PK) - response (PD) relations in support of internal decision-making and to provide evidence of safety and efficacy for regulatory evaluation. • ICON Development Solutions provides a proprietary interface program, PDx-POP, that runs the NONMEM Software Package in a Windows-like environment.
Expeditious Drug Development – Enhanced Decision Making Anticipated Added Value For Users: • To improve numerical stability & computational efficiency • To ease code maintenance • To add more modern, robust estimation methods Anticipated Added Value For ICON: • Intellectual property • Enhanced pricing • Visibility and scientific reputation throughout the industry
Expeditious Drug Development – Enhanced Decision Making Global Publishing System • GPS is a validated, 21 CFR Part 11 compliant, centralized system for the organization, assembly, and dispatch of navigable electronic & paper documents to regulatory agencies • Changing Regulatory Environment – e. CTD “requirement” with FDA (January 2008) and EMEA (2009) – The UK, NL & Belgian authorities are already requesting electronic submissions
Expeditious Drug Development – Enhanced Decision Making Document Management System (Documentum) Publishing Systems (Core. Dossier, Insight Publisher) Submission Sent To Regulatory Authorities (e-Gateway) Submission Source Documents
Executive Chairman Dr. John Climax CEO Peter Gray ICON Central Laboratories ICON Development Solutions ICON Clinical Research ICON Contracting Solutions President Global President Bob Scott-Edwards President Dr Thomas Frey Dr John Hubbard VP Corporate QA Jo Coyle VP Global IT Mike Mc. Grath VP Strategic HR COO US Commercial VP Phase I Malcolm Burgess Brian O’Dwyer Snr VP Global BD Anne Wesler Group Director Market Development Simon Holmes Ciaran Murray President Corporate Development Bill Taaffe ICON Medical Imaging Chief Executive Elizabeth Thiele Eimear Kenny VP Corporate Training & Development Sean Leech Chief Financial Officer Snr VP Global Medical Suzanne Gagnon VP Global Data Management Tom O’Leary Dr Ted Gastineau
Phase I Developments Brian O’Dwyer, General Manager & Vice President
Manchester Phase I Clinical Research Unit • Clinical Trial Directive Implementation in 2004 negatively impacted most of UK based CPUs • Inadequate business development contributed to the sluggish business • High value and high risk studies combined with significant cancellations aggravated the situation • Imbalance between high science and low business acumen
Manchester Phase I Clinical Research Unit Way to Success • Maintained scientific strengths complemented by commercial and operational management – Focus on biomarker models incl. imaging techniques, e. g. CNS, diabetes, CV – Improved volunteer recruitment & study delivery • Strengthened business development significantly • Re-branded to ICON Development Solutions and creating the “quality” brand image with sponsors • Increased substantially bed utilization and backlog
MEU Collaboration • Access to hospital based beds for FIM & complex studies • Enhanced flexibility through additional bed capacity • For MEU access to support services e. g. bioanalysis, DM, PK etc. • Access to respiratory patients • Proof of Concept capability • MEU is quality unit, close proximity to existing facility & strong reputation in respiratory internationally
Phase I Acquisition In The US • 85 bed clinical research unit in San Antonio, TX • Experienced team with excellent market reputation • Clinical pharmacology platform in the US to complement the UK CPU • Highly synergistic to our existing Development Solutions business and service offering • Healthy client base, RFP flow and new business wins
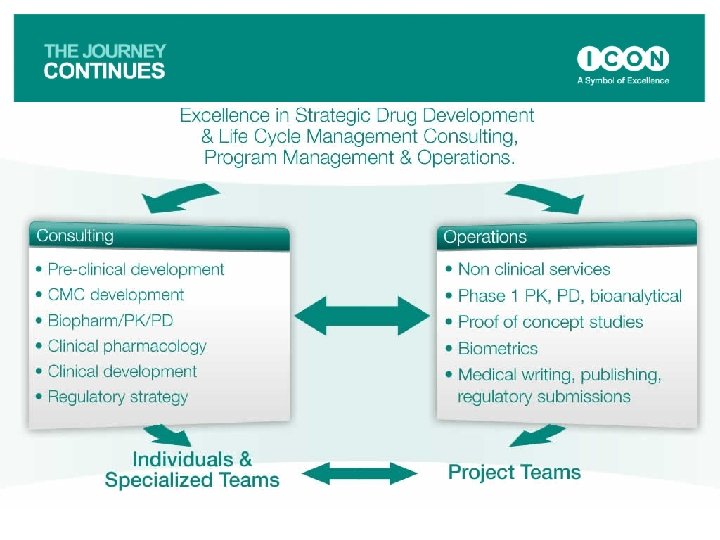
Development Solutions - Key Differentiators • Full spectrum of services to support early drug development from compound selection to proof of concept (and beyond – RA, PK/PD • Clients may wish to choose individual functional services or the integrated IDS package: regulatory strategy, development planning, operational execution, evaluation and reporting • The IDS business model is unique in our industry. The competition offers a similar “shopping list”, but lacks the early phase drug development integration
Executive Chairman Dr. John Climax CEO Peter Gray ICON Central Laboratories President VP Corporate QA Jo Coyle VP Global IT ICON Development Solutions ICON Clinical Research ICON Contracting Solutions President Global President Dr Thomas Frey Dr John Hubbard Bob Scott. Edwards Commercial VP Brian O’Dwyer COO US Malcolm Burgess Snr VP Global BD VP Strategic HR Elizabeth Thiele Eimear Kenny Anne Wesler Group Director Market Development Simon Holmes Ciaran Murray President Corporate Development Bill Taaffe ICON Medical Imaging Chief Executive Mike Mc. Grath VP Corporate Training & Development Sean Leech Chief Financial Officer Snr VP Global Medical Suzanne Gagnon VP Global Data Management Tom O’Leary Dr Ted Gastineau
Robert Scott - Edwards President ICON Central Laboratory
ICON Central Laboratories - Quick Facts: • 425 staff in 4 Labs – NY, NJ, Dublin, Singapore • 528 active studies Backlog >$126 m • Won 284 studies in 2007 (Strike rate = 48%) • Built >600, 000 kits in 2007 • Resulted >8, 000 tests in 2007 • 87% of New Business is repeat • 70% Clients say we are the best CL! (26%=same!)
Drivers of the Business: • The search for subjects… – – USA Classic Europe New Europe Asia/Pacific remains strong remains steady still growing very strongly showing good growth/high interest • More complex testing required… – More than just “safety testing” – Biomarkers and esoteric testing
Our Challenges: • LOGISTICS – Getting a sample into a Laboratory; TIME/COST • BROADENING MENU of TESTING – New technology, investment, having scale & mass • FLEXIBLE IT system to support global activity – Data is what we deliver – From a global platform – Serviced & supported 24/7
STRATEGY: • Expand Network to support market growth – Additional testing in Singapore: – New Laboratory in India: – Strengthen partnership in China: June 2008 September 2008 Ongoing • Expand technology base to meet market demand – Ongoing: Example: Flow Cytometry network • Upgrade IT systems to support business – Ongoing: Pilot phase successful
Global Flow Cytometry: • Standardized analyzers (BD) • Custom reagents from central source • Link all cytometers to central hub for analysis/gating • Build EDC system and give Client access • FC is key for Oncology, Immunology, Cell Signaling • NY, Dublin, Singapore, Japan, Argentina, India
• The challenge in meeting Client demand for more complex testing is simple: VOLUME! • Unlike Bioanalytical work in the phase I arena, CL testing is not batch-oriented. • Margin comes from being adept at managing volume. • Volume, Informatics, Agility 8 Margin 6 4 2 0 Volume -2
Critical Success Factors: • Global Coverage is essential… – USA, Europe, China, India, Asia/Pacific – Strong Logistics skills • Broad Test Menu is essential… – 65% of testing is esoteric – Rapid deployment of technology on global scale • Flexible IT system is essential… – Information to support proactive management – Global data & 24/7 Customer Support
Executive Chairman Dr. John Climax CEO Peter Gray ICON Central Laboratories ICON Development Solutions ICON Clinical Research ICON Contracting Solutions President Global President Bob Scott-Edwards President Dr Thomas Frey Dr John Hubbard VP Corporate QA COO US Sean Leech Chief Financial Officer Ciaran Murray President Corporate Development Bill Taaffe Malcolm Burgess ICON Medical Imaging Mike Mc. Grath Snr VP Global BD VP Strategic HR Elizabeth Thiele Chief Executive Jo Coyle VP Global IT Commercial VP Brian O’Dwyer Eimear Kenny VP Corporate Training & Development Anne Wesler Group Director Market Development Simon Holmes Snr VP Global Medical Suzanne Gagnon VP Global Data Management Tom O’Leary Dr Ted Gastineau
Ted Gastineau CEO ICON Medical Imaging
Medical Imaging • ICON Medical Imaging is focused on medical imaging endpoints for the development of pharmaceutical, biotech, and medical device products. • Our industry leading technology enables clients through digital asset management, real time information access, and knowledge management.
Medical Imaging • X-Ray, MRI, CT, Nuclear Medicine, PET, Ultrasound, Video, Photography • Imaging shows how drugs work inside the body • Medical Imaging in clinical trials is growing across Phase I, III and IV PET Movie
Medical Imaging • Why? – See and measure structure and function – Dose effects, target effects, side effects – Better information faster – Phase I: Internal decision making/ Compound screening – Phase II: Dose, Safety, Efficacy, Accelerated Approval – Phase III: Surrogate Endpoint, Disease Modifying Effect, Safety, Efficacy
Medical Imaging • FDA Continues to Accept and Promote Imaging • Critical Path: Janet Woodcock, MD Deputy Director, CMO FDA – “Imaging technologies are currently very important, and will become even more crucial to therapeutic development” – “FDA, under its critical path initiative, is seeking to advance development of these imaging biomarkers in an organized fashion” • Oncology Guidance Document: updated May 2007 – Supports the use of Objective Response Rate and Progression Free Survival…all are imaging based endpoints – “When the study endpoint is based on tumor measurements (e. g. , PFS or ORR), tumor endpoint assessments should be verified by central reviewers blinded to study treatments”
Medical Imaging Genentech Clears Hurdle On Cancer Drug Avastin By MARILYN CHASE and ANNA WILDE MATHEW Wall St Journal February 23, 2008; Page A 3 – Accelerated approval based on Progression Free Survival – Independent Review of Imaging data was key – "We are very confident of the effect of this drug on progression -free survival. " said Richard Pazdur, director of the FDA's office of oncology-drug products. ” – “Dr. Pazdur said the Avastin decision didn't represent a shift for the agency, which has considered progression-free survival in a number of other approvals. "We're not boxed in to a survivalonly mentality, " he said. "We have to demonstrate regulatory flexibility. "
Medical Imaging • Therapeutic Initiatives – – – Oncology: 40% - 70% Cardiovascular 40% CNS: 10%-20% Musculoskeletal: Gastrointestinal: Dermatology:
Medical Imaging • Cardiac Safety – Cardiovascular function with CT, MR, Nuclear Med, US, Angio – Echo growing as measure of cardiac function – Integrated offering differentiates ICON – Adjudication of Cardiac Events powered by IMI technology (MIRA) – Key academic relationships: Harvard, Duke, Cleveland Clinic, UCSF, Oxford (UK)
Medical Imaging
Medical Imaging
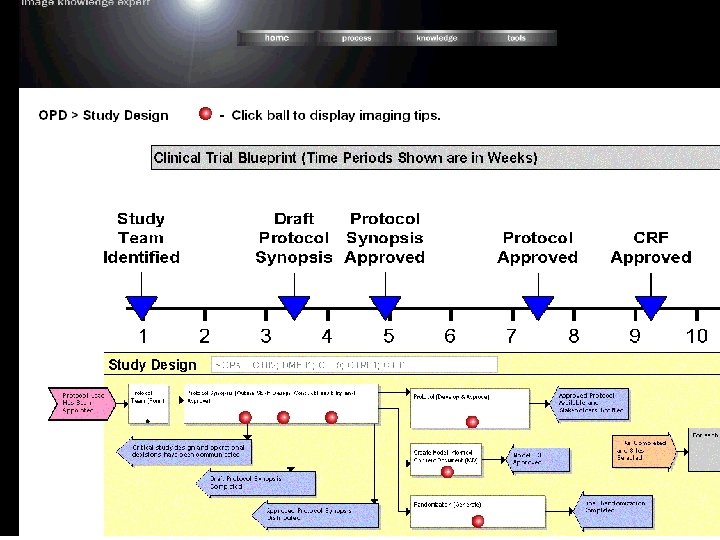
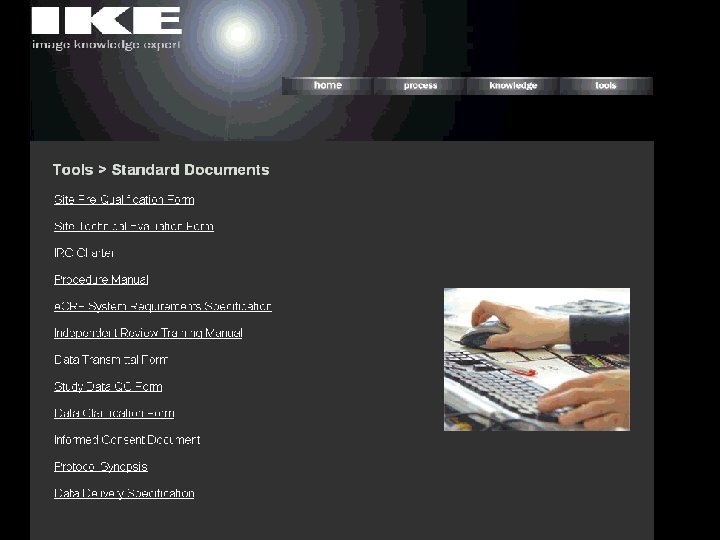
Medical Imaging • Technology – MIRA ™ IMI’s leading image management/project tracking platform • Complete workflow • 24/7 access to images and information • Real time data – Speed. Trial™ IMI’s validated cancer review application • Image display and analysis • Linked in electronic case report form • Ready to Read in as little as 2 weeks – Image Knowledge Expert (IKE™) • Image based Educational/Information Portal • Built for Major Pharma • Available for clients and projects
Algorithms Remote User MRI User Computational Platform: HW-OS PET User Process User Query Project Management Clinical DB Legacy Data Sales and Marketing Meta Data Retrieve Identify Query Common Back-plane Image Storage Retrieve Images or Information Standardization Image Data
Browser Interface SITES CODES CASES PROTOCOLS STUDIES SERIES
Task Lists (Work Flows) FILTERS TASK LISTS PROTOCOLS CODES FOR PROCESSING SERIES FOR PROCESSING
Sean Leech President ICON Contracting Solutions
MARKET DEVELOPMENTS & DEFINITION
DEFINITION Staffing Industry Definition The staffing industry can be broadly defined as a collection of business that provides organisations and individuals with a range of employment related services. The industry has evolved from what was once very discreet types of businesses, for example temporary hire, retained search, permanent placement, contract project staffing and professional employer organizations (PEO) into one industry with many sectors with the lines of demarcation blurring as the industry develops further.
MARKET DEVELOPMENTS • Shift in Business Models – – – Temporary to Permanent Contract Teams FSP VMS Unique Projects • A Move to Full Service • Global Positioning • Fewer Vendors Consolidation(i 3, KForce, Kelly, RPS, Inventiv) • Candidate Acceptance Move to scale & flexible solutions
MARKET SCALE
WORLD STAFFING MARKET Country US$B USA 119. 9 Europe UK 47. 8 France 25. 3 Germany 10. 6 Netherlands 10. 2 Switzerland 5. 1 Sweden 1. 6 Denmark 1. 0 Norway 0. 9 Finland 0. 9 ROW Japan 26. 2 China 2. 7 South Africa 2. 2
CLINICAL STAFFING MARKET Source: Centerw. Watch October 2005
MARKET SPLIT Regional Clinical Staffing Market Breakdown of Market 1% Staff leasing EU 44% 75% Temporary Help US 44% ROW 12% 9% Insourcing 15% Place and Search
TEMPORARY STAFF PENATRATION RATES ICS COVERAGE
INDUSTRY SECTOR GROWTH US 2005
OUR GROWTH 2007 2008 Growth EUROPE $30 m € 45 m 50% USA $16 m € 20 m 25% TOTAL ICS $46 m € 65 m 41%
OUR MARGIN OPPORTUNITY • Leverage centralised cost/management infrastructure. • Project/Multiple assignment focus = reduced business/candidate acquisition cost. • Layered in permanent placement revenue. • Value added service – More $ same client. • Candidate market therefore pricing is favourable. Average Operating Margin excess 15% within 2 years
STRATEGY
STRATEGY • Full Range of Staffing Services • Global Infrastructure – Greater scale required in the US; acquisition a possibility • Flexible Solutions
ICON CONTRACTING SOLUTIONS – INTERNATIONAL, NOT YET GLOBAL New York North Carolina Tampa Sweden Denmark Finland Netherlands Poland Germany x 2 Belgium France UK x 3
STRATEGIC STAFFING SOLUTION PERMANENT PLACEMENT TRAINING FLEXIBILITY Permanent Placement - Executive Search - Search and Selection - Basic Search - Advertising - Assessments Training - Traineeships - Coaching - Training and Education CONTRACT PLACEMENT Contract Placement - Project based - Project or functional teams - Vacancy Management - Interim Management - Administration FROM ONE ASSIGNMENT TO INTEGRATED STRATEGIC INSOURCING
SUMMARY ICS is the staffing arm of ICON, providing flexible staffing solution to the Pharma Industry on an International basis