Earths Atmosphere 1 The Earths atmosphere unique in


- Slides: 57

Earth’s Atmosphere 1

The Earth’s atmosphere - unique in Solar System Earth’s atmosphere has changed over time 2

Evolution of Earth's atmosphere 1. Original gases in vicinity would have been dominated by H & He. 2. Earth's gravity too weak to retain H & He, but could retain H 2 O. Dominant constituent of early atmosphere. 3. Earth cooled, Sun also dimmer - H 2 O condensed to oceans, leaving no atmosphere, until gradually: 4. New atmosphere from compounds “outgassed” from volcanic activity (much H 2 O, CO 2, NH 3) and (not so important) from comets (mostly H 2 O and CO 2). Most CO 2 dissolved into oceans and formed carbonate rocks (e. g. limestone) within 109 years. NH 3 broken by solar 3 UV, eventually into H 2, which escaped, and N 2.

5. Life forms affected atmosphere starting at about 1 billion years (algae at first, then plants and oceanic creatures with shells), absorbing CO 2 and releasing O 2 (photosynthesis). 6. Respiratory life at about 2 billion years started to stabilize the O 2 level. 7. Nitrogen also liberated from rocks by bacteria. 8. O 2 level set by balance of photosynthetic and respiratory life. Left with 78% N 2, 21% O 2 and 1% other This process did not happen on Venus or Mars! 4

Structure of the atmosphere Pressure = Force/Area Units: 1 atm = 1 atmosphere = 14. 7 lbs/in 2 = 1. 01 x 105 N/m 2 or Pa Atmospheric pressure is due to weight of overlying air at that height. 5

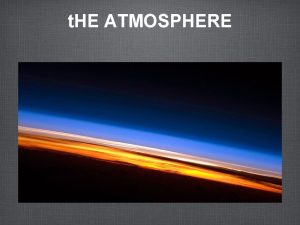
Atmospheric pressure decreases smoothly with increasing altitude (drops by ½ every 5. 5 km). Temperature is more complicated: or “thermosphere” (our book) 6

• • Troposphere: T decreases upward away from solar-heated surface. “Weather” = convection, is here. Stratosphere: T rises as result of heating by absorption of UV light in ozone layer (O 3). No convection. Mesosphere: Little ozone, so no UV absorption T decreases again. Ionosphere (or thermosphere): Oxygen and nitrogen are atomic, and absorb very shortwavelength UV radiation and X-rays, thus heated. A small fraction (10 -3 – 10 -4) is ionized. 7

Convection Earth's surface heated by Sun. Must get rid of the energy as fast as it gets it. Could do this by radiating, but atmosphere at surface thick enough so that radiation gets out slowly. Result: heat is trapped near surface, leading to convection. Convection also occurs when you boil water, or soup. Heat is released by radiation higher up. Convection causes both small-scale turbulence and large scale circulation patterns. It also occurs within Earth, on other 8 planets, and in stars.

Note: at high altitudes, T of atmosphere is very high, e. g. 1000 C at 300 km, near orbit of space shuttle. Why don’t astronauts get cooked? 9

How hot should the Earth be at its surface? Total power in sunlight that reaches the top of our atmosphere is 1. 75 x 1017 W. Earth’s “albedo” is 0. 31, i. e. 31% reflected back into space. If Earth had no atmosphere, 69% is absorbed by Earth’s surface, and would be reradiated. This amounts to (0. 69)(1. 75 x 1017 W) = 1. 21 x 1017 W Absorbed, reradiated emission from warm object: blackbody 10 spectrum.

How much power would one square meter of Earth radiate (emergent flux)? Area = 4 r 2 where r = 6. 38 x 106 m A = 4 (6. 38 x 106)2 = 5. 1 x 10¹⁴ m 2 Power radiated per square meter is = 237 W m-2 11

So what’s the temperature? Recall Stefan-Boltzmann law: F = T 4, so T = 254 K = -19 °C Wha? Actual average surface temperature is 287 K ! 12

What’s going on? First, consider how a blackbody at T=254 K would radiate: What kind of radiation is this? 13

Earth is warmer than expected due to the Greenhouse Effect. Predominant greenhouse gases are water vapor (H 2 O), carbon dioxide (CO 2), and methane (CH 4). They are transparent to visible light, but not to infrared radiation. 14

15

Greenhouse gases • CO 2 increases through use of petroleum products, fuel and biomass burning. • Increased 21% since 1958: • CH 4 increases from grazing ruminant animals, sewage, biomass decay 16

Increase in greenhouse gases • Humans are putting CO 2 into atmosphere, especially through use of petroleum products. • Removal of forests decreases Earth’s capacity to absorb CO 2, and produce oxygen. • Global warming? Global Warming!!! 17

CO 2 data from bubbles trapped in ice, depth indicates age. Recent T data from thermometers, historical data also from trapped air bubbles in ice. Oxygen isotope ratio sensitive T indicator. 18 "Warming of the climate system is unequivocal" Intergovernmental Panel on Climate Change (IPCC) 2007

19

• More on the ionosphere: – Particles in the upper atmosphere ionized by the Sun – Radio signals below ~20 MHz can bounce off the ionosphere allowing communications over the horizon. 20

Global warming: primary cause • Pollution: Burning carbon-containing fossil fuels produces carbon dioxide C + O 2 => CO 2 21

• Humans have increased CO 2 more than 35% since industrial revolution National Oceanic and Atmospheric Administration 2006 • The most CO 2 in 650, 000 years (IPCC) 2007 22

Surface Air Temperature Trends 1942 -2003 Alaska is Ground Zero: In past 50 years, temperatures have increased 4º F. National Assessment Synthesis Team Worldwide, temperatures have increased slightly more than 1º F (IPCC) 2007 Chapman and Walsh, 2004 23

Why has Alaska warmed the most? Global Warming: The Greatest Threat © 2006 Deborah L. Williams The Albedo Effect • Snow and sea ice reflect 85 -90% of sun’s energy. • Ocean surface and dark soil reflect only 1020%. Increased melting of snow and sea ice Land or water warms faster (ACIA 2004) More dark earth and ocean surface is exposed More of sun’s heat energy is absorbed “White shirt versus Black shirt” 24

Melting Sea Ice • An area twice the size of Texas has melted away since 1979 (over 20% decrease). (National Snow and Ice Data Center 2005) • Ice 40% thinner. (Rothrock, D. A, et al. 1999) Source ACIA, 2004 Jennifer Allen Animation • Ice only 6 – 9 feet thick at North Pole (NOAA FAQ 2007). • Bering Sea Ice Sheet also retreating (Science 3/10/06). 25

Glacial Retreat Mc. Call Glacier Bay (Riggs Glacier) • The rapid retreat of Alaska’s glaciers represents about 50% of the estimated mass loss by glaciers through 2004 worldwide. • Loss of over 588 billion cubic yards between ’ 61 and ’ 98. (Climate Austin Post photo (ACIA 2004) 1941 1958 USGS photo • Alaska’s glaciers are responsible for at least 9% of the global sea level rise in the past century. (ACIA 2004) 2004 2003 26 Matt Nolan photo Change 11/05) Bruce Molnia photo

Ocean Acidification Global Warming: The Greatest Threat © 2006 Deborah L. Williams Over the last 200 years, about 50% of all CO 2 produced on earth has been absorbed by the ocean. (Royal Society 6/05) Remains in the atmosphere (greenhouse gas) Dissolves in sea water CO 2 + H 20 H 2 CO 3 (CARBONIC ACID) Water becomes more acidic. CO 2 27

Inundation • Sea level has increased 3. 1 mm/year between 1993 and 2003 (IPCC 2007). • 4 -6 meters of sea level rise locked in by 2100 if 3 times pre-industrial CO 2 or 1% increase/year (Overpeck et al. 2006). 28

Inundation from Four Meter Sea Level Rise (or, 1 m rise + 3 m storm surge) Weiss and Overpeck, 2006 29

Finally, CFCs: refrigerants and aerosol propellants (spray cans), affects the ozone layer! Chlorofluorocarbons (CFCs) and halons have damaged ozone layer. Now banned, but damage will take years to heal. (Use sunscreen!) 1979 – 2003 decrease of 50% in ozone over Antarctica, 10 – 20% 30 over mid-latitudes.

• Extra slides 31

What We Can Do Action Is Essential at Every Level • Individual • Corporate • Local • State • Federal • International 32 Photo courtesy of 7 summits. com Global Warming: The Greatest Threat © 2006 Deborah L. Williams REDUCE CO 2 EMISSIONS

Making a Difference as an Individual Conservation Measures: • Walk, bike, ride public transit, or carpool • Make sure your tires are fully inflated and your car tuned up • Lower your water heater and home thermostats • Run your dishwasher only with full loads • Reduce your shower length and temperature • Buy locally produced food • Unplug appliances not in use • Turn off lights when leaving a room • Use recycled paper • Reuse or recycle as much as you can • Cut down on consumerism • Encourage elected officials to address on state/national level. 33

Animals at Risk • • Polarbears Walruses Ice seals Black guillemots Kittiwakes Salmon Caribou Arctic grayling • Rising temperatures • Shrinking habitat • Food harder to get • Expanding diseases • Competition 34

Is it Achievable? Carbon Emissions (Billions of tons per year) 14 7 h n rre Cu t a t. P At least TRIPLING CO 2 STABILIZATION TRIANGLE Flat Path Avoid doubling CO 2 1. 9 1954 2004 2054 35 Pacala and Socolow, Science 2004

Wind Power Courtesy of Chris Rose 36

Measuring Your Carbon Footprint • Major Carbon Contributors: • Electric Consumption • Gas/Heating Oil Consumption • Car and Miles Driven • Miles Flown • Recreational Vehicle Use • Average Footprint is 24, 000 pounds 37

Conservation: Three Examples • Unplug Appliances: Vampires! • 43 billion k. WH lost/year in US • Est: 1, 000 lbs/year/person • Pump Up Tires: • 4 million gallon of gas wasted daily in US • Extends life of tires by 25% • Est: 1, 000 lbs/year/person • Lower Thermostat • 2 degrees • Est: 2000 lbs/year/person 38

Energy Efficiency: Two Examples • Compact Fluorescents • Four to six times more efficient • Est: for each bulb converted, save about 100 lbs/year • Bus/Walk/Bike • Save money on fuel and maintenance • Est: 5, 000 lbs/year 39

Imaging the Earth • Zoom in on some features we might want to look for on other planets: canyon systems (Grand Canyon) and active volcano (Etna) 40

…at other wavelengths • Through clouds, via radar on Endeavour, sensitive to ice roughness, water content (curving features are glaciers) Radar and visual imaging of Mt Everest 41

• IR often shows heat distribution • San Francisco Bay area 42

Earth at night 43

Molecular weights Hydrogen Helium Methane Ammonia Water Neon Nitrogen Oxygen Argon CO 2 2 4 16 17 18 20 28 32 40 44 Air: 29 (Ar, CO 2, Ne, He and other rare gases). Early atmosphere: CO 2, steam, NH 3 and CH 4 (volcanoes). No oxygen. Steam condensed to water => seas Photosynthesis: CO 2 and H 2 O to O 2. NH 3 and CH 4 reacted with O 2. 44

“The Earth has been cooling since 1998” - wrong 45

46

Earth’s Atmosphere and Magnetic Field 47

A consequence of the Earth’s partially molten metal interior, plus the Earth’s rotation: The Earth has a magnetic field Why? Electrically charged particles in motion produce a magnetic field. Electric currents flow in liquid metal outer core. 48

Magnetic field around Earth has dipole shape. A compass needle points toward north magnetic pole, not true 49 geographic North Pole – tilted by 11. 5°.

Earth’s magnetic field interacts with the charged particles from the Sun (solar wind) – flow of mostly protons and electrons. The Earth’s Magnetosphere – A Good Thing Some charged particles get trapped in the Van Allen belts. Their origin is not clear – Solar Wind and cosmic rays probably involved. 50

Charged particles tend to move along magnetic field, but they can lose energy by collisions and fall into upper atmosphere. They flow along field to poles, deeper into atmosphere, where they collide with molecules, exciting their electrons, which drop back toward ground state emitting light. Produce northern lights (aurora borealis) or southern lights (aurora australis). Question: what kind of spectrum? 51

Space Shuttle photo of Aurora Borealis: 52

Aurora from ISS 53

Aurora and volcano in Iceland 54

55

Aurora over clouds 56

From Alaska: 57
 Earths early atmosphere contained
 4 spheres of the earth
 Plasticity in earth's layers
 Earths interior
 Earths major crustal plates
 Earths kayers
 Whats earths moon called
 Whats the name of earths moon
 Earth's honey
 Whats earths moon called
 What does the earths tilt cause
 Earths orbit seasons
 What does earths tilt do
 Earths biomes
 Continental drift theory
 What is earths thickest layer
 Earth layers foldable
 Description of earth's atmosphere
 Brown earth soil ireland
 Earths boundaries
 Most abundant element on earth
 Earths crust
 Lithosphere
 Earths roation
 What is the true shape of earth
 Study of the earth's physical features
 Từ ngữ thể hiện lòng nhân hậu
 Diễn thế sinh thái là
 V. c c
 Phép trừ bù
 Tỉ lệ cơ thể trẻ em
 Hát lên người ơi
 Khi nào hổ con có thể sống độc lập
 đại từ thay thế
 Vẽ hình chiếu vuông góc của vật thể sau
 Quá trình desamine hóa có thể tạo ra
 Công của trọng lực
 Thế nào là mạng điện lắp đặt kiểu nổi
 Hát kết hợp bộ gõ cơ thể
 Lời thề hippocrates
 Các loại đột biến cấu trúc nhiễm sắc thể
 Vẽ hình chiếu đứng bằng cạnh của vật thể
 Phản ứng thế ankan
 Các môn thể thao bắt đầu bằng từ đua
 Sự nuôi và dạy con của hươu
 điện thế nghỉ
 Một số thể thơ truyền thống
 Biện pháp chống mỏi cơ
 Trời xanh đây là của chúng ta thể thơ
 Voi kéo gỗ như thế nào
 Ng-html
 Số nguyên tố là
 Thiếu nhi thế giới liên hoan
 Tia chieu sa te
 Các châu lục và đại dương trên thế giới
 Thế nào là hệ số cao nhất
 Sơ đồ cơ thể người
 Tư thế ngồi viết
