Untargeted Lipidomics Using the Q Exactive David A


- Slides: 48
Untargeted Lipidomics Using the Q Exactive David A Peake, Ph. D Thermo Fisher Scientific Metabolomics and Lipidomics Group San Jose, CA, USA
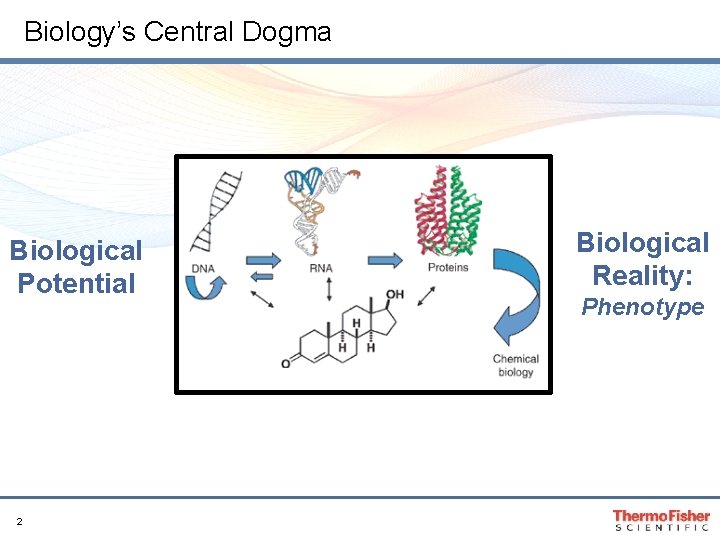
Biology’s Central Dogma Biological Potential 2 Biological Reality: Phenotype
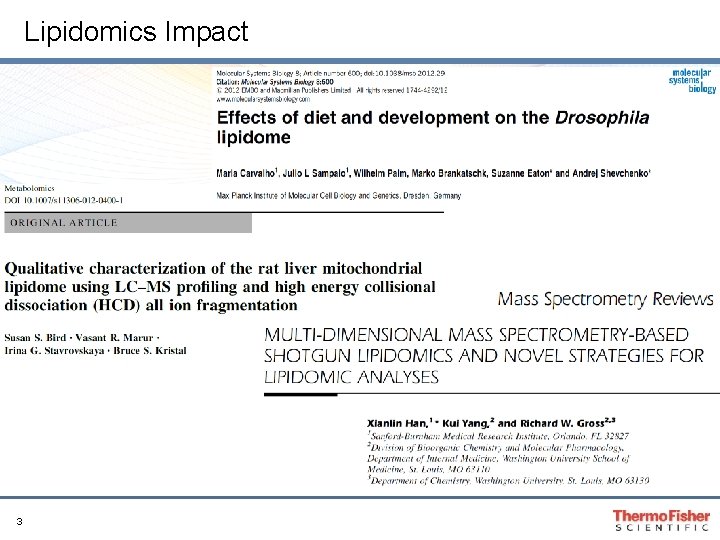
Lipidomics Impact 3
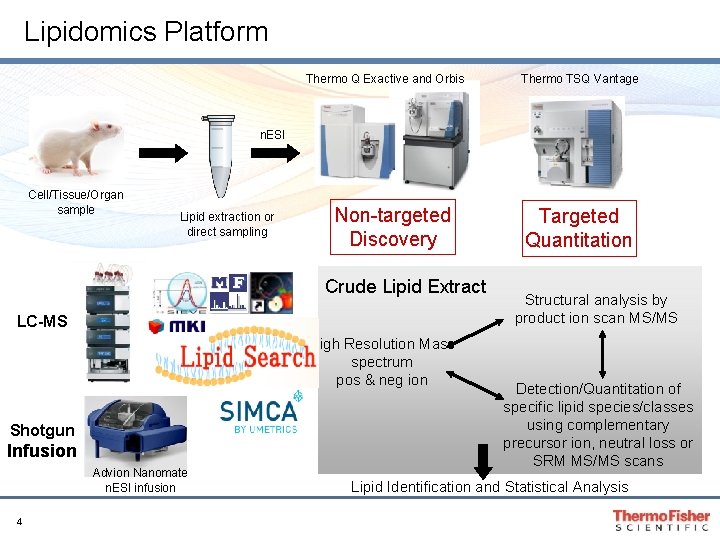
Lipidomics Platform Thermo Q Exactive and Orbis Thermo TSQ Vantage n. ESI Cell/Tissue/Organ sample Lipid extraction or direct sampling Non-targeted Discovery Crude Lipid Extract LC-MS High Resolution Mass spectrum pos & neg ion Shotgun Infusion Advion Nanomate n. ESI infusion 4 Targeted Quantitation Structural analysis by product ion scan MS/MS Detection/Quantitation of specific lipid species/classes using complementary precursor ion, neutral loss or SRM MS/MS scans Lipid Identification and Statistical Analysis
ASMS 2012 Higher-efficiency lipid profiling system using a quadrupole orbitrap mass spectrometer and an automated search engine Lipid Search Takayuki Yamada 1, Takato Uchikata 1, Shigeru Sakamoto 2, Yasuto Yokoi 3, Eiichiro Fukusaki 1, Takeshi Bamba 1 1. Dept. of Biotechnology, Grad. School of Engineering, Osaka University, Suita, JP 2. Thermo Fisher Scientific, Yokohama, JP 3. Mitsui Knowledge Industry, Tokyo, JP 5
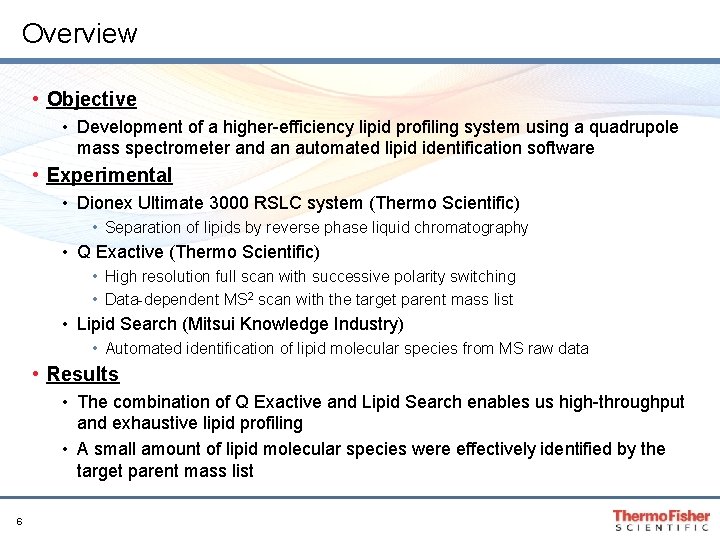
Overview • Objective • Development of a higher-efficiency lipid profiling system using a quadrupole mass spectrometer and an automated lipid identification software • Experimental • Dionex Ultimate 3000 RSLC system (Thermo Scientific) • Separation of lipids by reverse phase liquid chromatography • Q Exactive (Thermo Scientific) • High resolution full scan with successive polarity switching • Data-dependent MS 2 scan with the target parent mass list • Lipid Search (Mitsui Knowledge Industry) • Automated identification of lipid molecular species from MS raw data • Results • The combination of Q Exactive and Lipid Search enables us high-throughput and exhaustive lipid profiling • A small amount of lipid molecular species were effectively identified by the target parent mass list 6
Workflow for High-throughput Lipid Profiling Sample preparation LC/MS analysis • Full scanning high mass accuracy and resolution • Data-dependent MS 2 scanning targeting the parent mass from the Lipid Search database 7 Data processing • Identification of lipid molecular species based on accurate mass from full scan MS and dd-MS 2 • Fast, automated peak detection
Introduction What is needed for Lipidomics? Mass spectrometry • Full scanning with high mass accuracy and high resolution • Lipid molecular species with similar molecular weight exist • High-speed product ion scanning for polar head groups and fatty acid chains • There a lot of structural isomers by the difference of fatty acid chain composition • Polarity switching in short cycle time • Polar lipid ionization efficiency and detection specificity depend on the acquisition polarity • Product ions from polar head groups show high sensitivity in positiveion mode, and product ions from fatty acid chains show high sensitivity in negative-ion mode 8
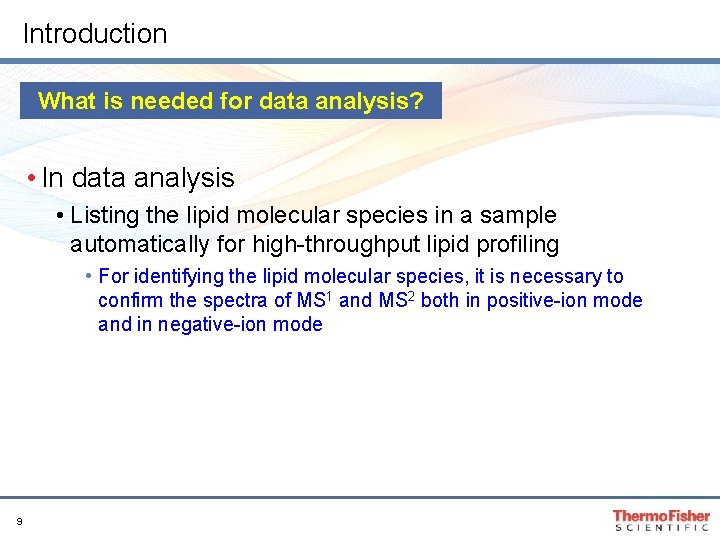
Introduction What is needed for data analysis? • In data analysis • Listing the lipid molecular species in a sample automatically for high-throughput lipid profiling • For identifying the lipid molecular species, it is necessary to confirm the spectra of MS 1 and MS 2 both in positive-ion mode and in negative-ion mode 9
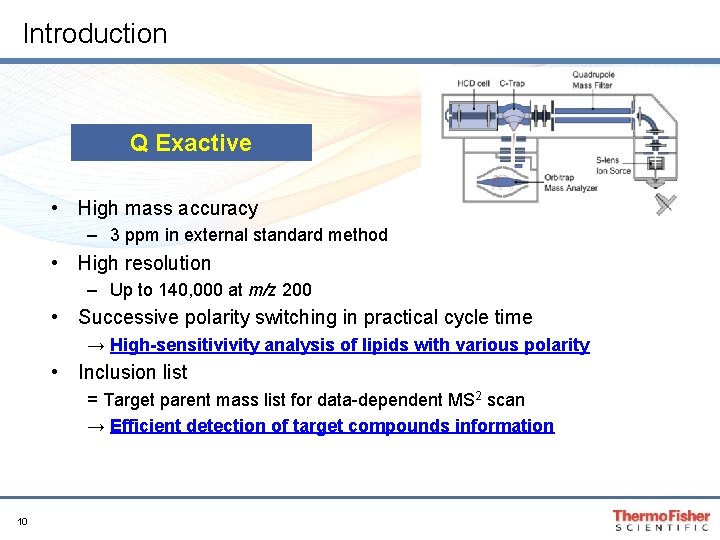
Introduction Q Exactive • High mass accuracy – 3 ppm in external standard method • High resolution – Up to 140, 000 at m/z 200 • Successive polarity switching in practical cycle time → High-sensitivivity analysis of lipids with various polarity • Inclusion list = Target parent mass list for data-dependent MS 2 scan → Efficient detection of target compounds information 10
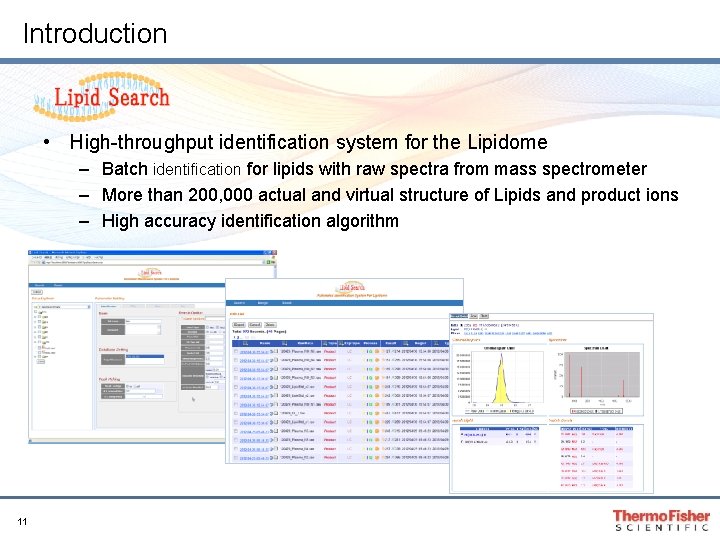
Introduction • High-throughput identification system for the Lipidome – Batch identification for lipids with raw spectra from mass spectrometer – More than 200, 000 actual and virtual structure of Lipids and product ions – High accuracy identification algorithm 11
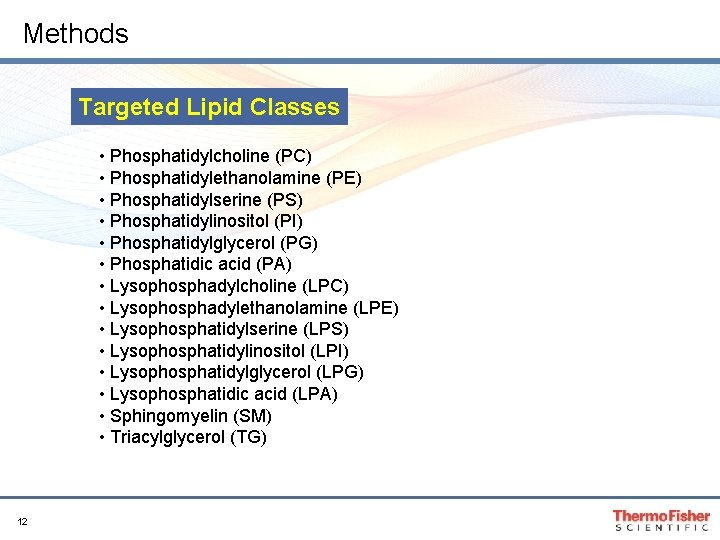
Methods Targeted Lipid Classes • Phosphatidylcholine (PC) • Phosphatidylethanolamine (PE) • Phosphatidylserine (PS) • Phosphatidylinositol (PI) • Phosphatidylglycerol (PG) • Phosphatidic acid (PA) • Lysophosphadylcholine (LPC) • Lysophosphadylethanolamine (LPE) • Lysophosphatidylserine (LPS) • Lysophosphatidylinositol (LPI) • Lysophosphatidylglycerol (LPG) • Lysophosphatidic acid (LPA) • Sphingomyelin (SM) • Triacylglycerol (TG) 12
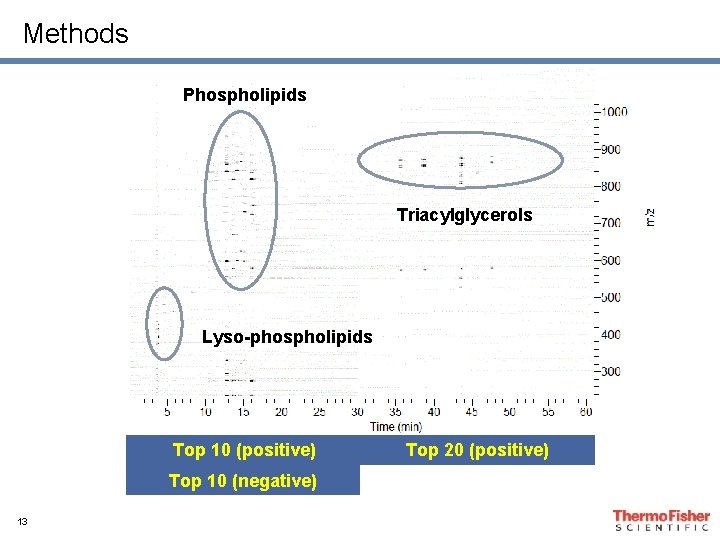
Methods Phospholipids Triacylglycerols Lyso-phospholipids Top 10 (positive) Top 10 (negative) 13 Top 20 (positive)
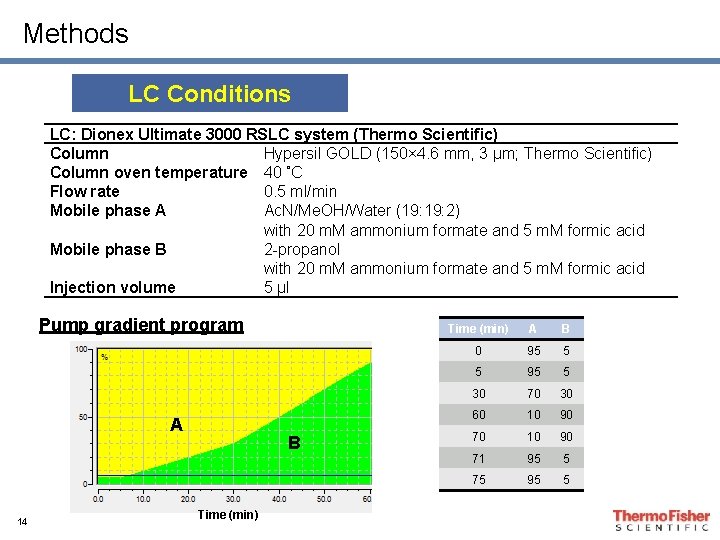
Methods LC Conditions LC: Dionex Ultimate 3000 RSLC system (Thermo Scientific) Column Hypersil GOLD (150× 4. 6 mm, 3 µm; Thermo Scientific) Column oven temperature 40 ˚C Flow rate 0. 5 ml/min Mobile phase A Ac. N/Me. OH/Water (19: 2) with 20 m. M ammonium formate and 5 m. M formic acid Mobile phase B 2 -propanol with 20 m. M ammonium formate and 5 m. M formic acid Injection volume 5 µl Pump gradient program A 14 B Time (min) A B 0 95 5 5 95 5 30 70 30 60 10 90 71 95 5 75 95 5
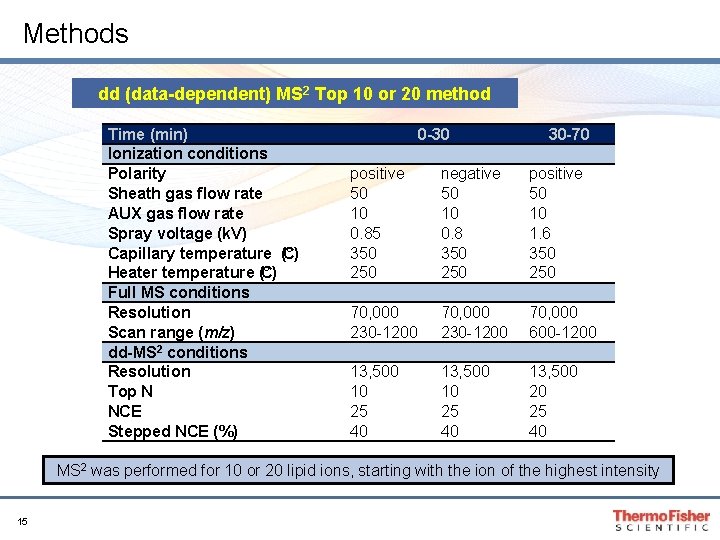
Methods dd (data-dependent) MS 2 Top 10 or 20 method Time (min) Ionization conditions Polarity Sheath gas flow rate AUX gas flow rate Spray voltage (k. V) Capillary temperature (° C) Heater temperature (° C) Full MS conditions Resolution Scan range (m/z) dd-MS 2 conditions Resolution Top N NCE Stepped NCE (%) 0 -30 30 -70 positive 50 10 0. 85 350 250 negative 50 10 0. 8 350 250 positive 50 10 1. 6 350 250 70, 000 230 -1200 70, 000 600 -1200 13, 500 10 25 40 13, 500 20 25 40 MS 2 was performed for 10 or 20 lipid ions, starting with the ion of the highest intensity 15
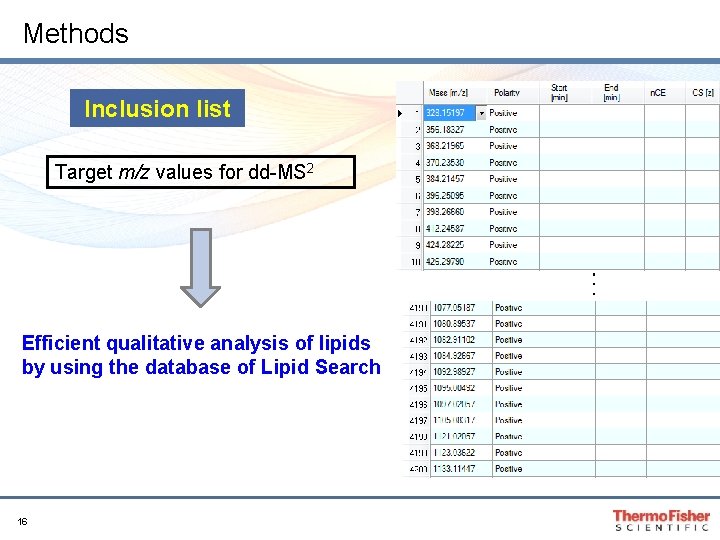
Methods Inclusion list Target m/z values for dd-MS 2 ・ ・ ・ Efficient qualitative analysis of lipids by using the database of Lipid Search 16
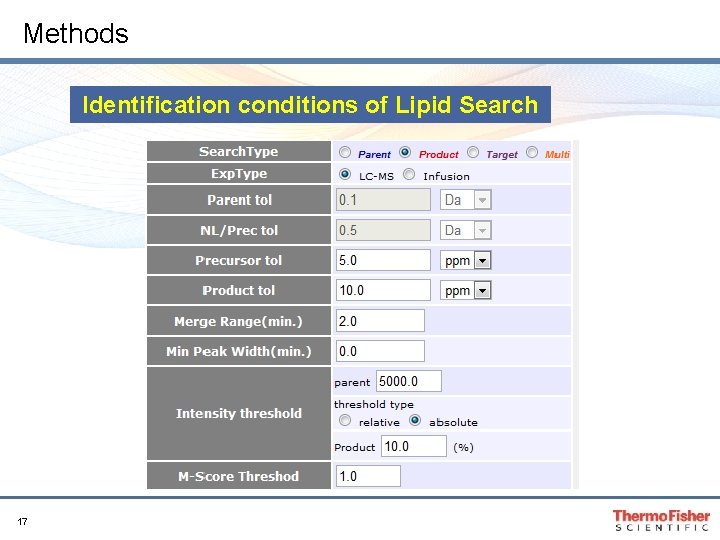
Methods Identification conditions of Lipid Search 17
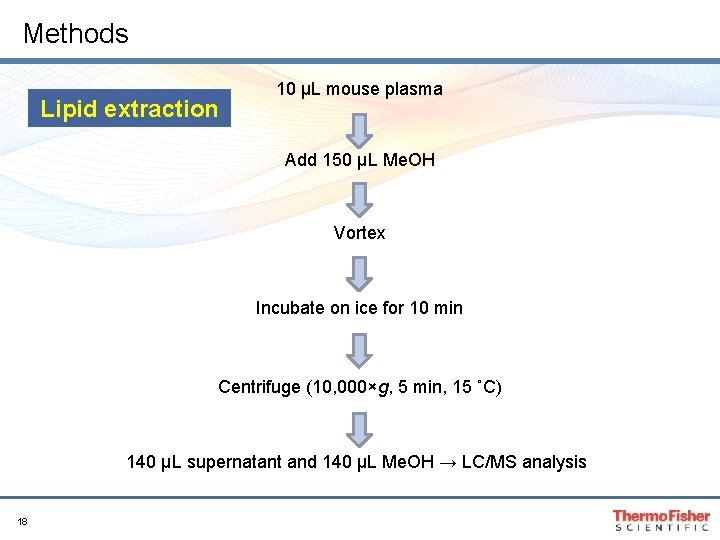
Methods Lipid extraction 10 µL mouse plasma Add 150 µL Me. OH Vortex Incubate on ice for 10 min Centrifuge (10, 000×g, 5 min, 15 ˚C) 140 µL supernatant and 140 µL Me. OH → LC/MS analysis 18
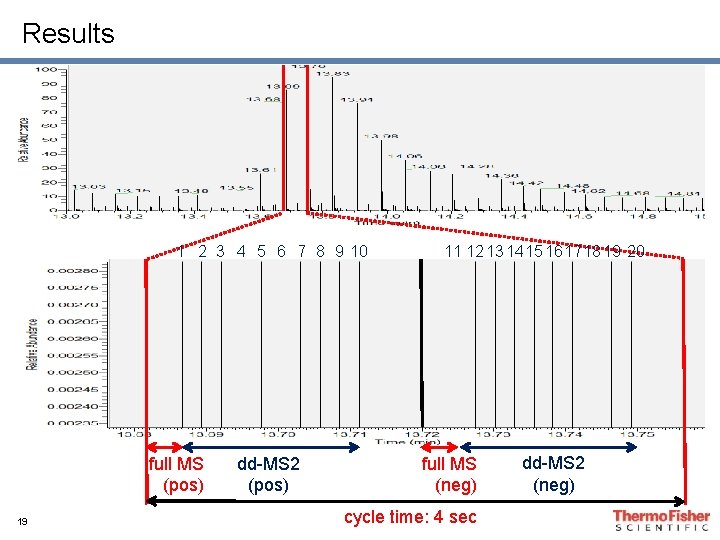
Results 1 2 3 4 5 6 7 8 9 10 full MS (pos) 19 dd-MS 2 (pos) 11 12 13 1415 161718 19 20 full MS (neg) cycle time: 4 sec dd-MS 2 (neg)
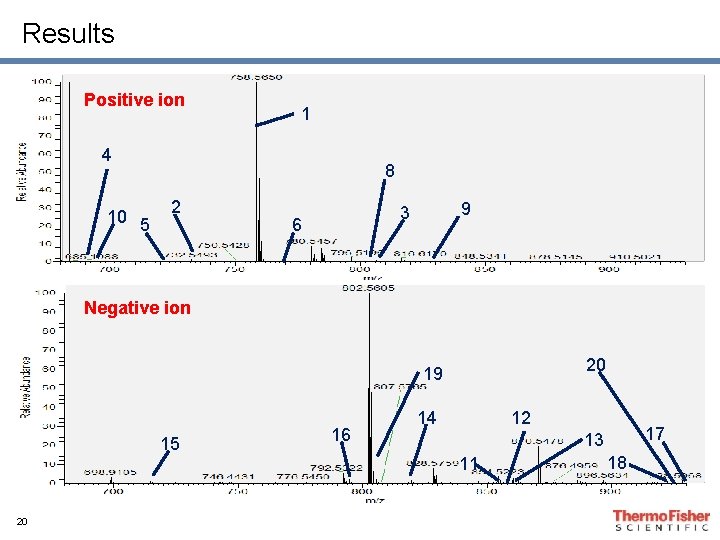
Results Positive ion 1 4 10 5 8 2 9 3 6 Negative ion 20 19 15 16 14 12 11 20 17 13 18
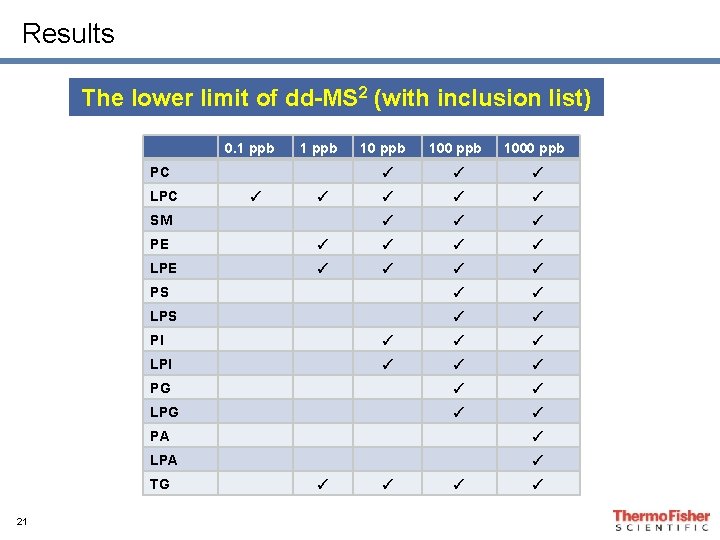
Results The lower limit of dd-MS 2 (with inclusion list) 0. 1 ppb PC LPC ✓ ✓ SM 100 ppb 1000 ppb ✓ ✓ ✓ ✓ ✓ PE ✓ ✓ LPE ✓ ✓ PS ✓ ✓ LPS ✓ ✓ PI ✓ ✓ ✓ LPI ✓ ✓ ✓ PG ✓ ✓ LPG ✓ ✓ PA ✓ LPA ✓ TG 21 10 ppb ✓ ✓
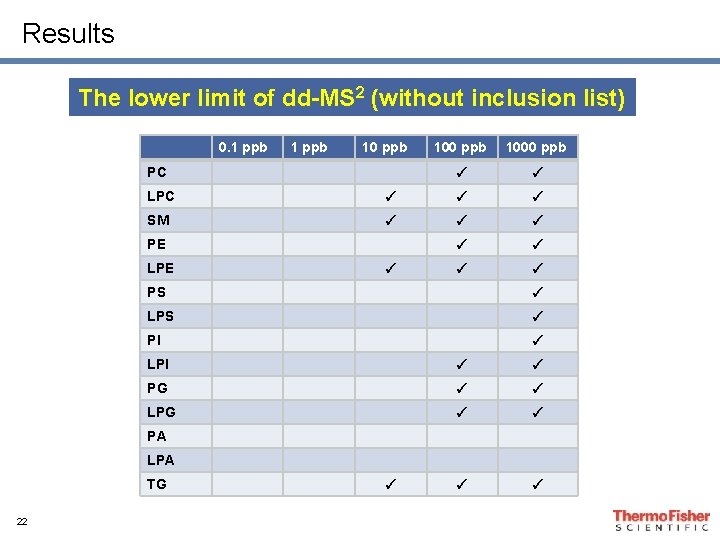
Results The lower limit of dd-MS 2 (without inclusion list) 0. 1 ppb 10 ppb PC 100 ppb 1000 ppb ✓ ✓ LPC ✓ ✓ ✓ SM ✓ ✓ ✓ ✓ PE LPE ✓ PS ✓ LPS ✓ PI ✓ LPI ✓ ✓ PG ✓ ✓ LPG ✓ ✓ PA LPA TG 22 ✓
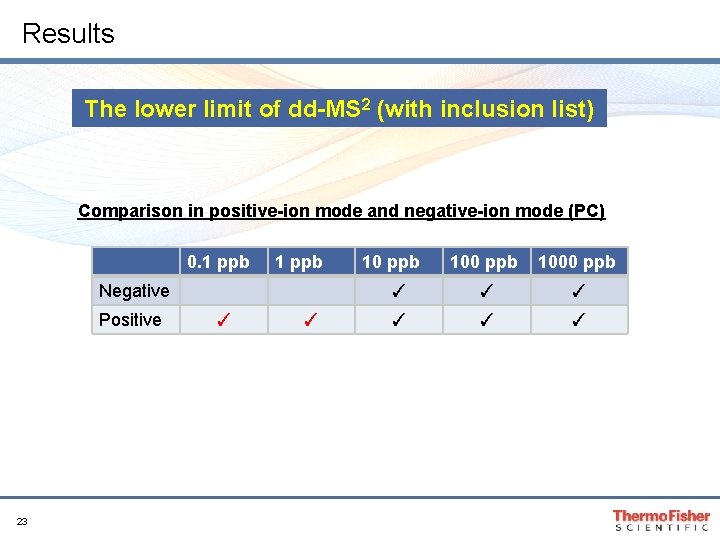
Results The lower limit of dd-MS 2 (with inclusion list) Comparison in positive-ion mode and negative-ion mode (PC) 0. 1 ppb Negative Positive 23 ✓ ✓ 10 ppb 1000 ppb ✓ ✓ ✓
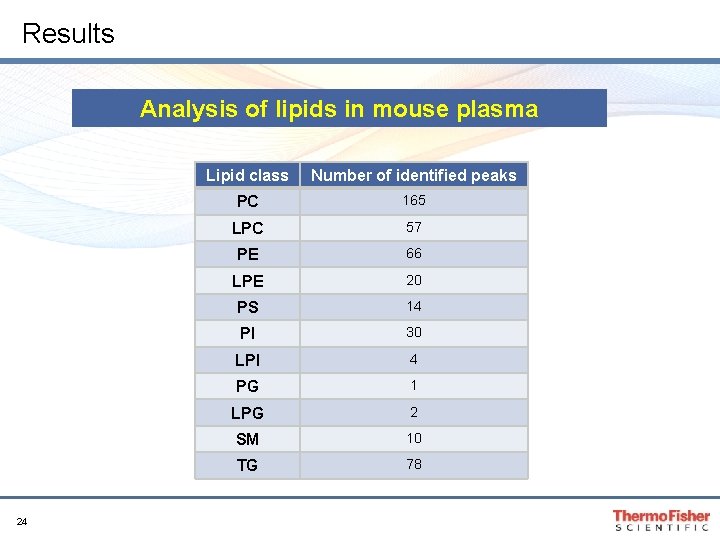
Results Analysis of lipids in mouse plasma 24 Lipid class Number of identified peaks PC 165 LPC 57 PE 66 LPE 20 PS 14 PI 30 LPI 4 PG 1 LPG 2 SM 10 TG 78
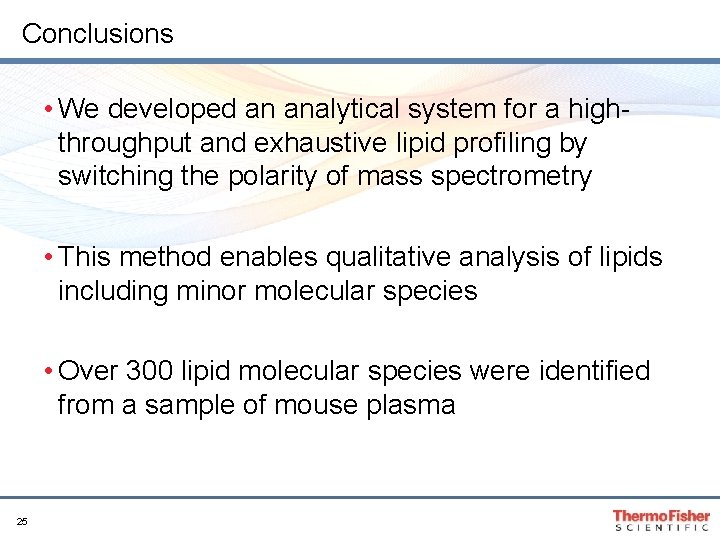
Conclusions • We developed an analytical system for a highthroughput and exhaustive lipid profiling by switching the polarity of mass spectrometry • This method enables qualitative analysis of lipids including minor molecular species • Over 300 lipid molecular species were identified from a sample of mouse plasma 25
Quantitative yeast lipidomics via LC-MS profiling using the Q Exactive Orbitrap mass spectrometer David A. Peake 1, Jessica Wang 1, Pengxiang Huang 1, Adam Jochem 2, Alan Higbee 2, David J. Pagliarini 2 1 Thermo Fisher Scientific, San Jose, CA 2 University of Wisconsin, Madison, WI
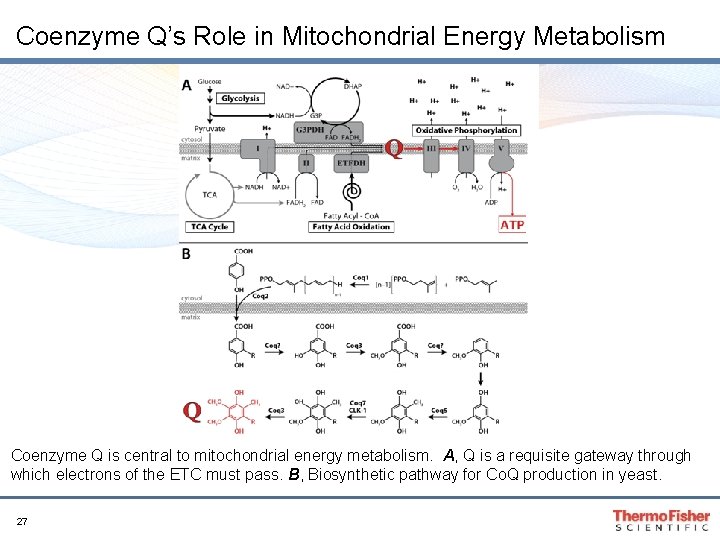
Coenzyme Q’s Role in Mitochondrial Energy Metabolism Coenzyme Q is central to mitochondrial energy metabolism. A, Q is a requisite gateway through which electrons of the ETC must pass. B, Biosynthetic pathway for Co. Q production in yeast. 27
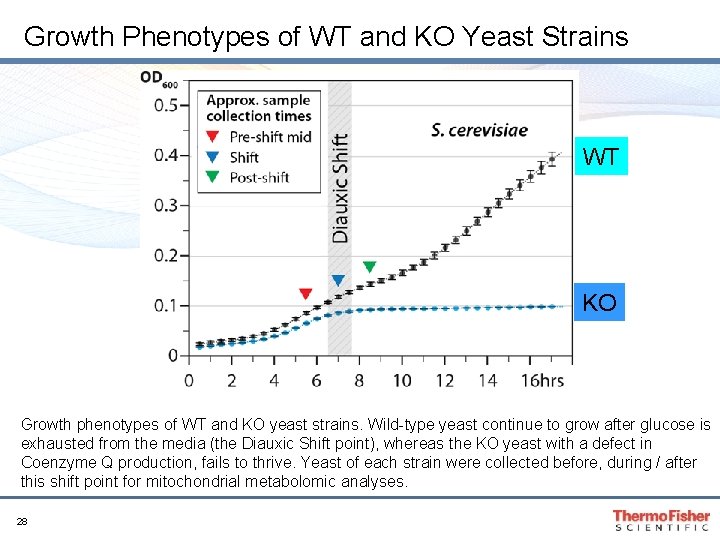
Growth Phenotypes of WT and KO Yeast Strains WT KO Growth phenotypes of WT and KO yeast strains. Wild-type yeast continue to grow after glucose is exhausted from the media (the Diauxic Shift point), whereas the KO yeast with a defect in Coenzyme Q production, fails to thrive. Yeast of each strain were collected before, during / after this shift point for mitochondrial metabolomic analyses. 28
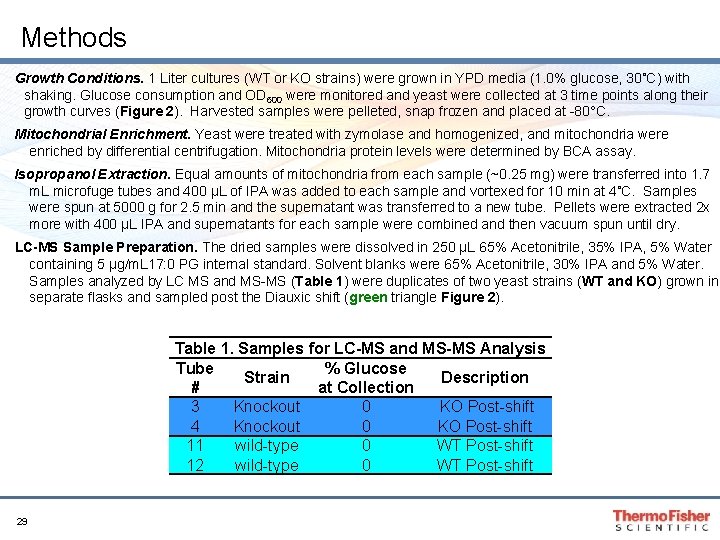
Methods Growth Conditions. 1 Liter cultures (WT or KO strains) were grown in YPD media (1. 0% glucose, 30˚C) with shaking. Glucose consumption and OD 600 were monitored and yeast were collected at 3 time points along their growth curves (Figure 2). Harvested samples were pelleted, snap frozen and placed at -80°C. Mitochondrial Enrichment. Yeast were treated with zymolase and homogenized, and mitochondria were enriched by differential centrifugation. Mitochondria protein levels were determined by BCA assay. Isopropanol Extraction. Equal amounts of mitochondria from each sample (~0. 25 mg) were transferred into 1. 7 m. L microfuge tubes and 400 µL of IPA was added to each sample and vortexed for 10 min at 4˚C. Samples were spun at 5000 g for 2. 5 min and the supernatant was transferred to a new tube. Pellets were extracted 2 x more with 400 µL IPA and supernatants for each sample were combined and then vacuum spun until dry. LC-MS Sample Preparation. The dried samples were dissolved in 250 µL 65% Acetonitrile, 35% IPA, 5% Water containing 5 µg/m. L 17: 0 PG internal standard. Solvent blanks were 65% Acetonitrile, 30% IPA and 5% Water. Samples analyzed by LC MS and MS-MS (Table 1) were duplicates of two yeast strains (WT and KO) grown in separate flasks and sampled post the Diauxic shift (green triangle Figure 2). Table 1. Samples for LC-MS and MS-MS Analysis Tube % Glucose Strain Description # at Collection 3 Knockout 0 KO Post-shift 4 Knockout 0 KO Post-shift 11 wild-type 0 WT Post-shift 12 wild-type 0 WT Post-shift 29
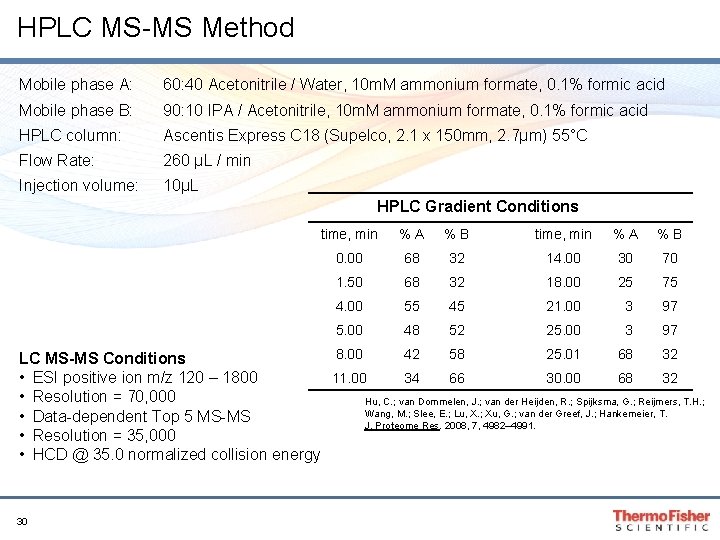
HPLC MS-MS Method Mobile phase A: 60: 40 Acetonitrile / Water, 10 m. M ammonium formate, 0. 1% formic acid Mobile phase B: 90: 10 IPA / Acetonitrile, 10 m. M ammonium formate, 0. 1% formic acid HPLC column: Ascentis Express C 18 (Supelco, 2. 1 x 150 mm, 2. 7µm) 55°C Flow Rate: 260 µL / min Injection volume: 10µL HPLC Gradient Conditions time, min %A %B 0. 00 68 32 14. 00 30 70 1. 50 68 32 18. 00 25 75 4. 00 55 45 21. 00 3 97 5. 00 48 52 25. 00 3 97 8. 00 42 58 25. 01 68 32 LC MS-MS Conditions 11. 00 34 66 30. 00 68 32 • ESI positive ion m/z 120 – 1800 • Resolution = 70, 000 Hu, C. ; van Dommelen, J. ; van der Heijden, R. ; Spijksma, G. ; Reijmers, T. H. ; Wang, M. ; Slee, E. ; Lu, X. ; Xu, G. ; van der Greef, J. ; Hankemeier, T. • Data-dependent Top 5 MS-MS J. Proteome Res. 2008, 7, 4982– 4991. • Resolution = 35, 000 • HCD @ 35. 0 normalized collision energy 30
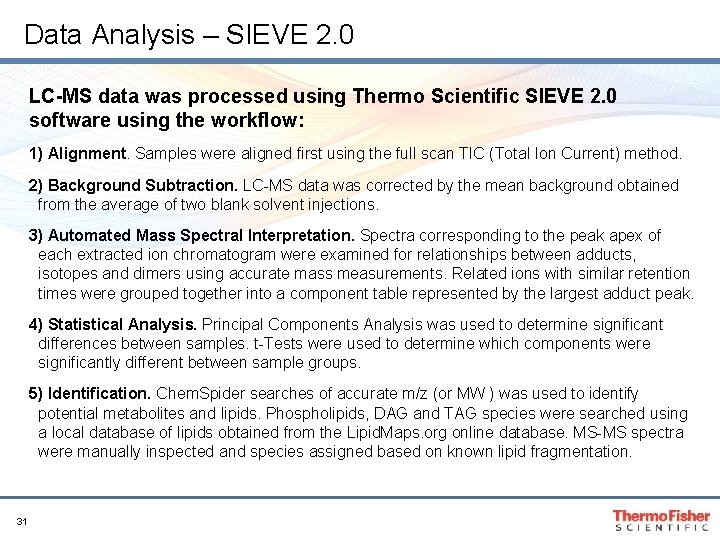
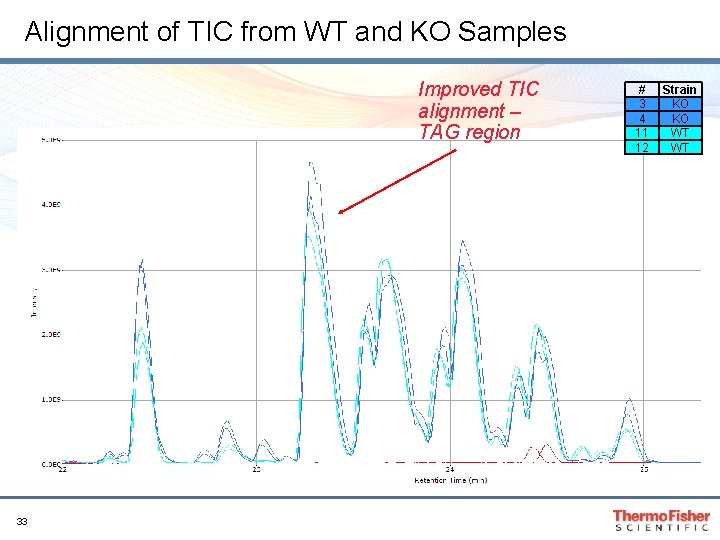
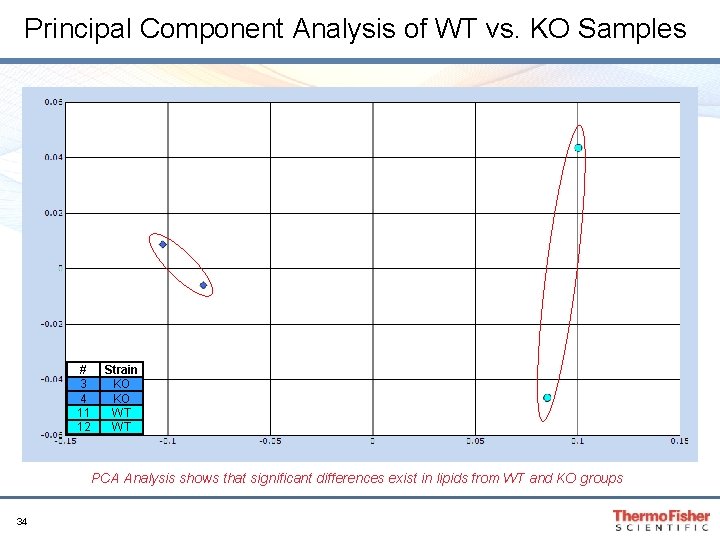
Data Analysis – SIEVE 2. 0 LC-MS data was processed using Thermo Scientific SIEVE 2. 0 software using the workflow: 1) Alignment. Samples were aligned first using the full scan TIC (Total Ion Current) method. 2) Background Subtraction. LC-MS data was corrected by the mean background obtained from the average of two blank solvent injections. 3) Automated Mass Spectral Interpretation. Spectra corresponding to the peak apex of each extracted ion chromatogram were examined for relationships between adducts, isotopes and dimers using accurate mass measurements. Related ions with similar retention times were grouped together into a component table represented by the largest adduct peak. 4) Statistical Analysis. Principal Components Analysis was used to determine significant differences between samples. t-Tests were used to determine which components were significantly different between sample groups. 5) Identification. Chem. Spider searches of accurate m/z (or MW ) was used to identify potential metabolites and lipids. Phospholipids, DAG and TAG species were searched using a local database of lipids obtained from the Lipid. Maps. org online database. MS-MS spectra were manually inspected and species assigned based on known lipid fragmentation. 31
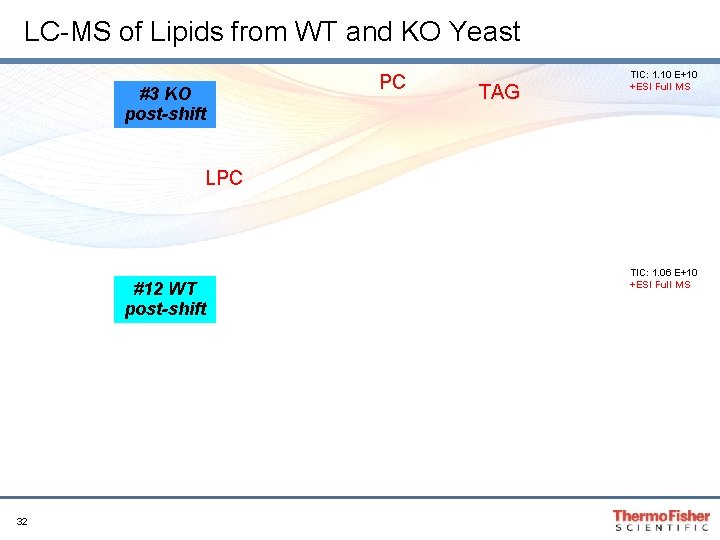
LC-MS of Lipids from WT and KO Yeast #3 KO post-shift PC TAG TIC: 1. 10 E+10 +ESI Full MS LPC #12 WT post-shift 32 TIC: 1. 06 E+10 +ESI Full MS
Alignment of TIC from WT and KO Samples Improved TIC alignment – TAG region 33 # 3 4 11 12 Strain KO KO WT WT
Principal Component Analysis of WT vs. KO Samples # 3 4 11 12 Strain KO KO WT WT PCA Analysis shows that significant differences exist in lipids from WT and KO groups 34
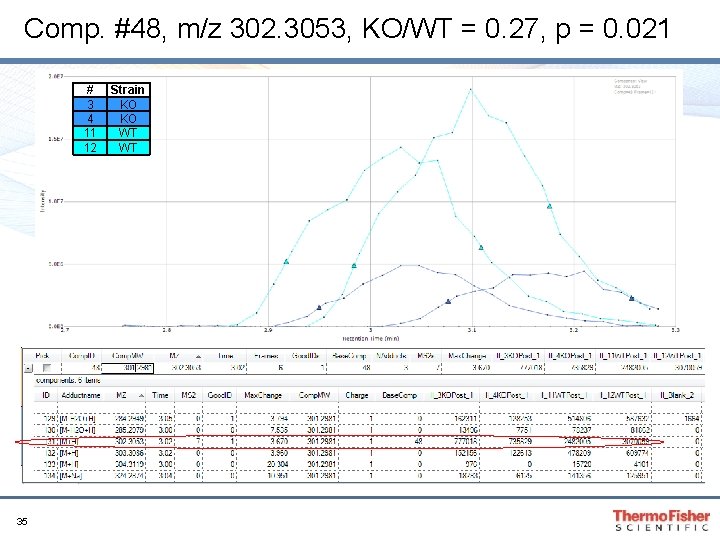
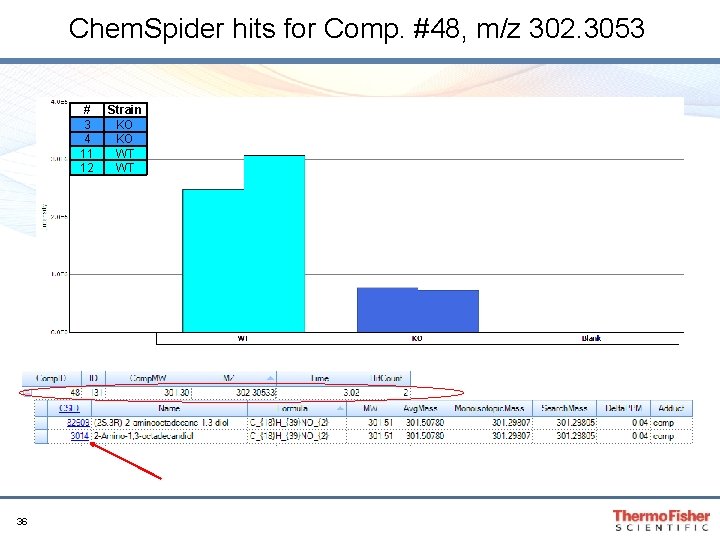
Comp. #48, m/z 302. 3053, KO/WT = 0. 27, p = 0. 021 # 3 4 11 12 35 Strain KO KO WT WT
Chem. Spider hits for Comp. #48, m/z 302. 3053 # 3 4 11 12 36 Strain KO KO WT WT
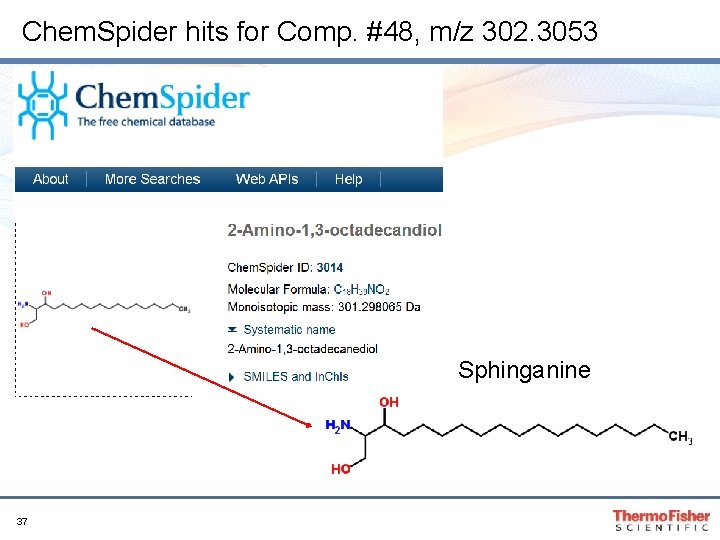
Chem. Spider hits for Comp. #48, m/z 302. 3053 Sphinganine 37
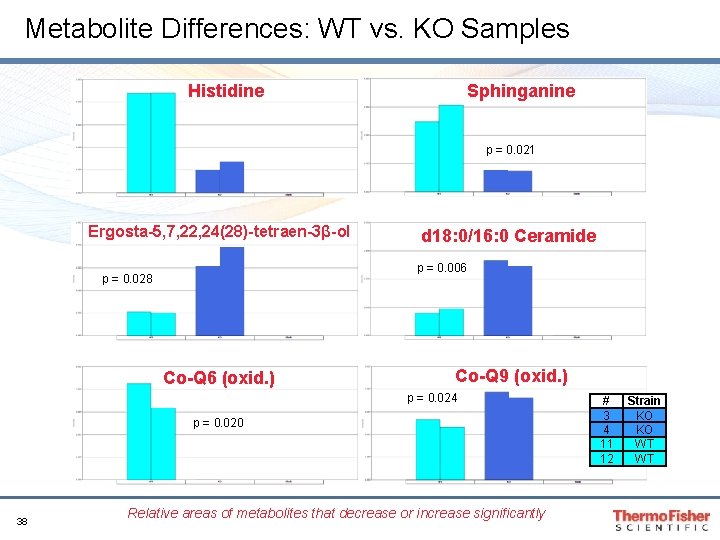
Metabolite Differences: WT vs. KO Samples Histidine Sphinganine p = 0. 003 p = 0. 021 Ergosta-5, 7, 22, 24(28)-tetraen-3β-ol d 18: 0/16: 0 Ceramide p = 0. 006 p = 0. 028 Co-Q 6 (oxid. ) Co-Q 9 (oxid. ) p = 0. 024 p = 0. 020 38 Relative areas of metabolites that decrease or increase significantly # 3 4 11 12 Strain KO KO WT WT
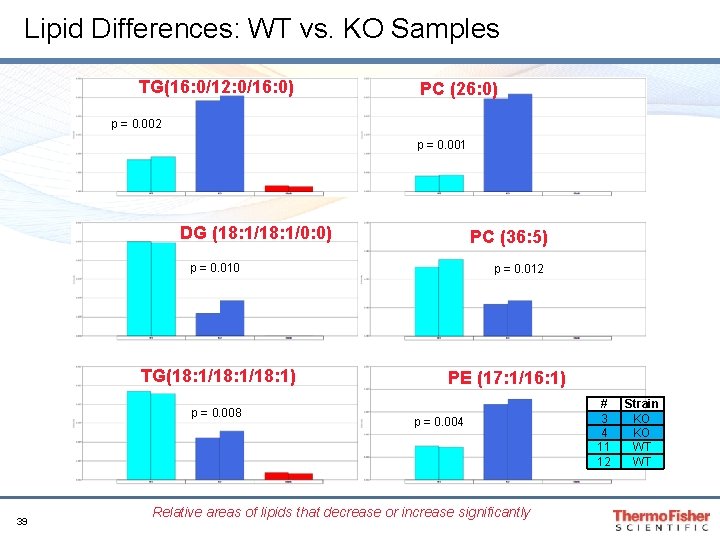
Lipid Differences: WT vs. KO Samples TG(16: 0/12: 0/16: 0) PC (26: 0) p = 0. 002 p = 0. 001 DG (18: 1/0: 0) PC (36: 5) p = 0. 010 TG(18: 1/18: 1) p = 0. 008 39 p = 0. 012 PE (17: 1/16: 1) p = 0. 004 Relative areas of lipids that decrease or increase significantly # 3 4 11 12 Strain KO KO WT WT
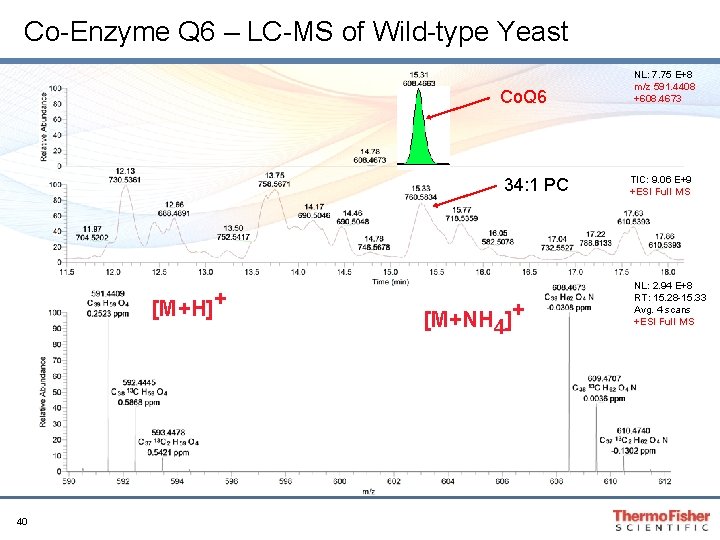
Co-Enzyme Q 6 – LC-MS of Wild-type Yeast Co. Q 6 34: 1 PC [M+H]+ 40 [M+NH 4]+ NL: 7. 75 E+8 m/z 591. 4408 +608. 4673 TIC: 9. 06 E+9 +ESI Full MS NL: 2. 94 E+8 RT: 15. 28 -15. 33 Avg. 4 scans +ESI Full MS
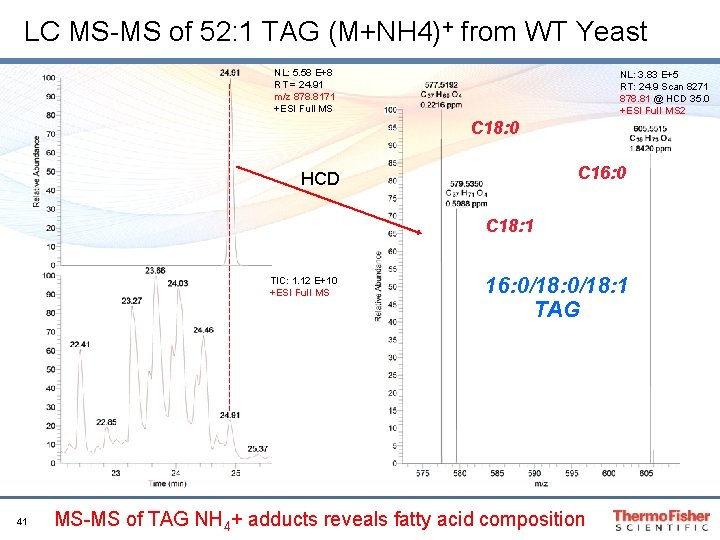
LC MS-MS of 52: 1 TAG (M+NH 4)+ from WT Yeast NL: 5. 58 E+8 RT = 24. 91 m/z 878. 8171 +ESI Full MS NL: 3. 83 E+5 RT: 24. 9 Scan 8271 878. 81 @ HCD 35. 0 +ESI Full MS 2 C 18: 0 C 16: 0 HCD C 18: 1 TIC: 1. 12 E+10 +ESI Full MS 41 16: 0/18: 1 TAG MS-MS of TAG NH 4+ adducts reveals fatty acid composition
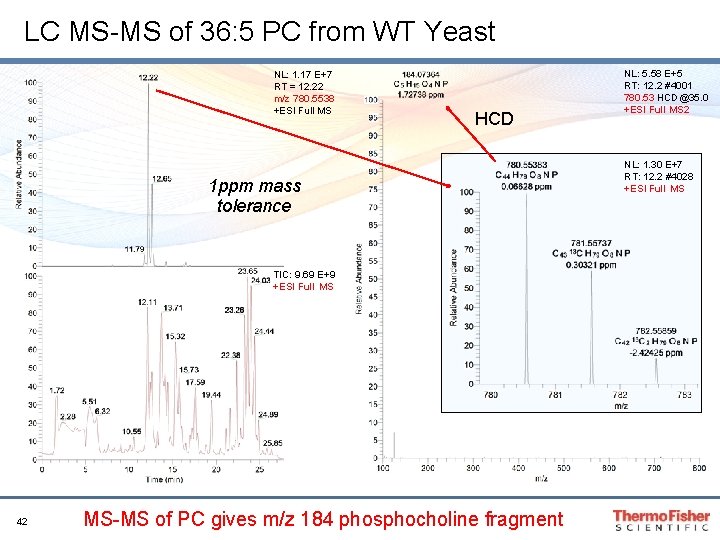
LC MS-MS of 36: 5 PC from WT Yeast NL: 1. 17 E+7 RT = 12. 22 m/z 780. 5538 +ESI Full MS HCD 1 ppm mass tolerance TIC: 9. 69 E+9 +ESI Full MS 42 MS-MS of PC gives m/z 184 phosphocholine fragment NL: 5. 58 E+5 RT: 12. 2 #4001 780. 53 HCD@35. 0 +ESI Full MS 2 NL: 1. 30 E+7 RT: 12. 2 #4028 +ESI Full MS
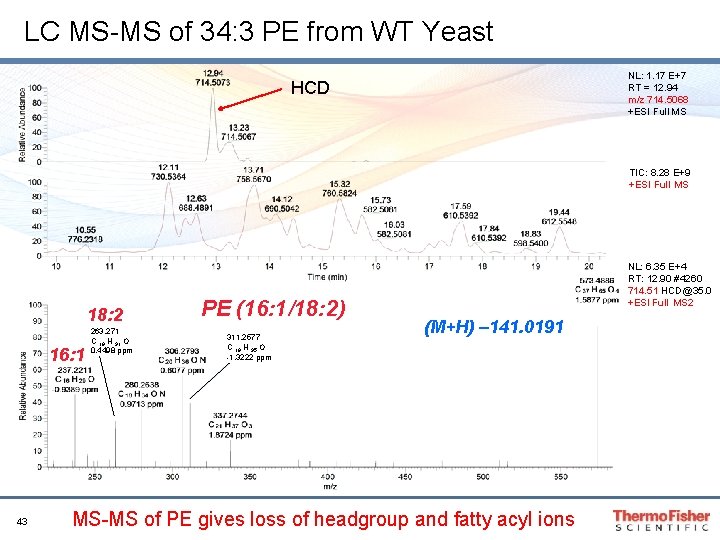
LC MS-MS of 34: 3 PE from WT Yeast NL: 1. 17 E+7 RT = 12. 94 m/z 714. 5068 +ESI Full MS HCD TIC: 8. 28 E+9 +ESI Full MS 18: 2 16: 1 43 263. 271 C 18 H 31 O 0. 4498 ppm PE (16: 1/18: 2) 311. 2577 C 19 H 35 O -1. 3222 ppm NL: 6. 35 E+4 RT: 12. 90 #4260 714. 51 HCD@35. 0 +ESI Full MS 2 (M+H) – 141. 0191 MS-MS of PE gives loss of headgroup and fatty acyl ions
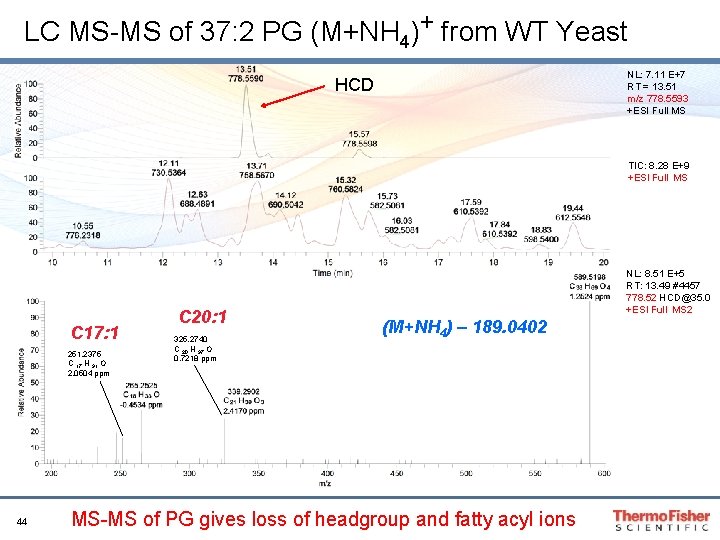
LC MS-MS of 37: 2 PG (M+NH 4)+ from WT Yeast NL: 7. 11 E+7 RT = 13. 51 m/z 778. 5593 +ESI Full MS HCD TIC: 8. 28 E+9 +ESI Full MS C 17: 1 251. 2375 C 17 H 31 O 2. 0504 ppm 44 C 20: 1 325. 2740 C 20 H 37 O 0. 7218 ppm NL: 8. 51 E+5 RT: 13. 49 #4457 778. 52 HCD@35. 0 +ESI Full MS 2 (M+NH 4) – 189. 0402 MS-MS of PG gives loss of headgroup and fatty acyl ions
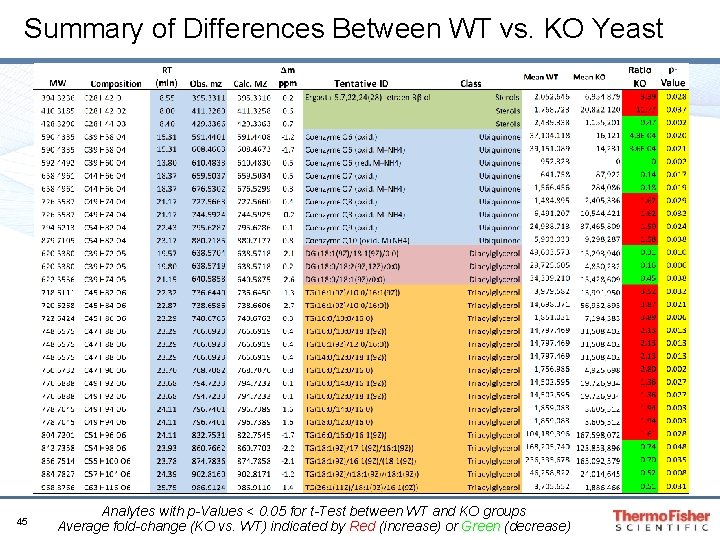
Summary of Differences Between WT vs. KO Yeast 45 Analytes with p-Values < 0. 05 for t-Test between WT and KO groups Average fold-change (KO vs. WT) indicated by Red (increase) or Green (decrease)
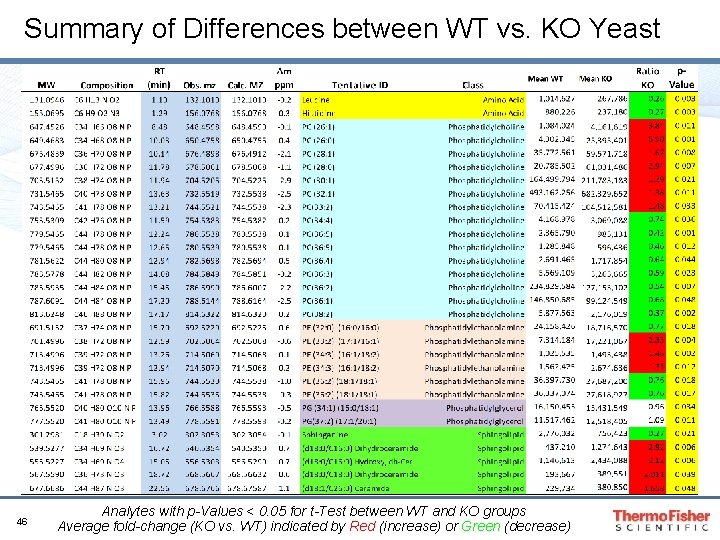
Summary of Differences between WT vs. KO Yeast 46 Analytes with p-Values < 0. 05 for t-Test between WT and KO groups Average fold-change (KO vs. WT) indicated by Red (increase) or Green (decrease)
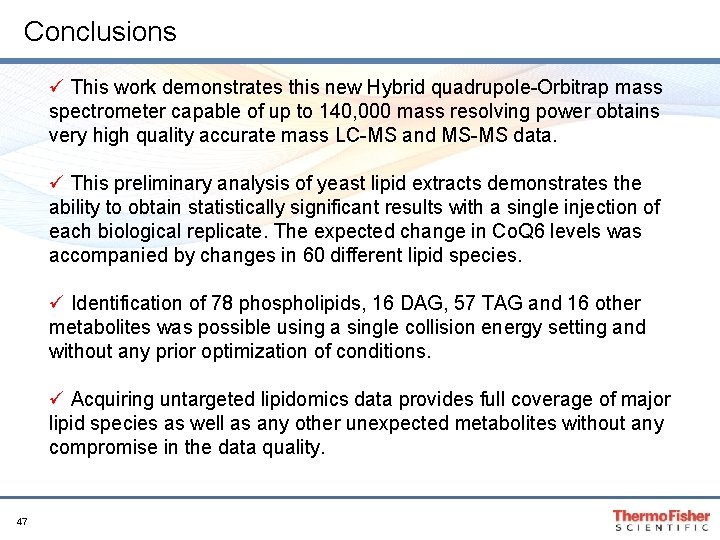
Conclusions ü This work demonstrates this new Hybrid quadrupole-Orbitrap mass spectrometer capable of up to 140, 000 mass resolving power obtains very high quality accurate mass LC-MS and MS-MS data. ü This preliminary analysis of yeast lipid extracts demonstrates the ability to obtain statistically significant results with a single injection of each biological replicate. The expected change in Co. Q 6 levels was accompanied by changes in 60 different lipid species. ü Identification of 78 phospholipids, 16 DAG, 57 TAG and 16 other metabolites was possible using a single collision energy setting and without any prior optimization of conditions. ü Acquiring untargeted lipidomics data provides full coverage of major lipid species as well as any other unexpected metabolites without any compromise in the data quality. 47
Acknowledgments Dave Pagliarini – Univ. of Wisconsin, Madison, WI, USA Takayuki Yamada Takeshi Bamba – Dept. of Biotechnology, Osaka Univ. , Suita, JP Yasuto Yokoi – Mitsui Knowledge Industry, Tokyo, JP 48 Michael Athanas – Thermo Alain Guiller Pengxiang Huang Yingying Huang Markus Kellmann Andre Makarov Madalina Oppermann Shigeru Sakamoto Mark Sanders Jennifer Sutton Jessica Wang Martin Zeller