Introduction The 3 rd Annual Demographia International Housing


- Slides: 46
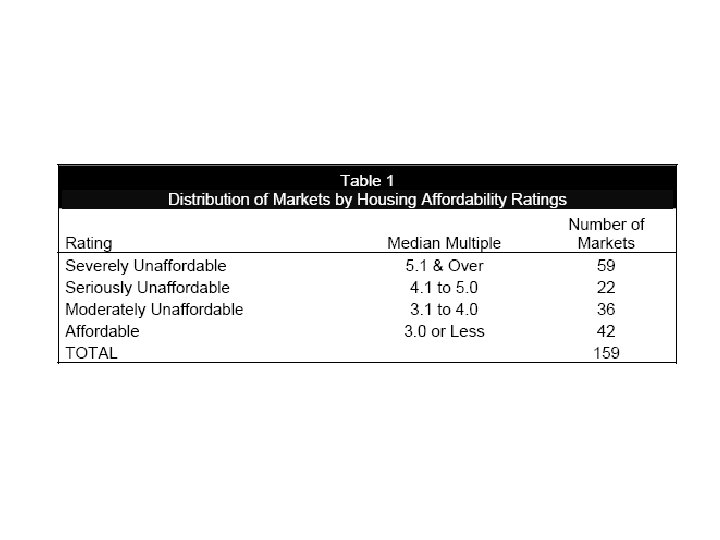
Introduction • The 3 rd Annual Demographia International Housing Affordability Survey expands coverage to 159 major markets in Australia, Canada, Ireland, New Zealand, the United Kingdom and the United States. • The Demographia International Housing Affordability Survey employs the “Median House Price to Median Household Income Multiple, ” (“Median Multiple”) to rate housing affordability (Table 1).
Introduction • In recent decades, the Median Multiple has been remarkably similar among the nations surveyed, with median house prices being generally 3. 0 or less times median household incomes. • This historic affordability relationship continues in many housing markets of the United States and Canada. However, the Median Multiple has escalated sharply in Australia, Ireland, New Zealand the United Kingdom and in some markets of Canada and the United States.
2006 Housing Affordability Ratings • The most pervasive housing affordability crisis is in Australia, with an overall Median Multiple of 6. 6. Affordability is only marginally better in New Zealand (6. 0) Ireland (5. 7), and the United Kingdom (5. 5). • On the other hand, the national Median Multiple in Canada is 3. 2, indicating that housing is onehalf as expensive relative to incomes as in Australia. The national Median Multiple in the United States is 3. 7.
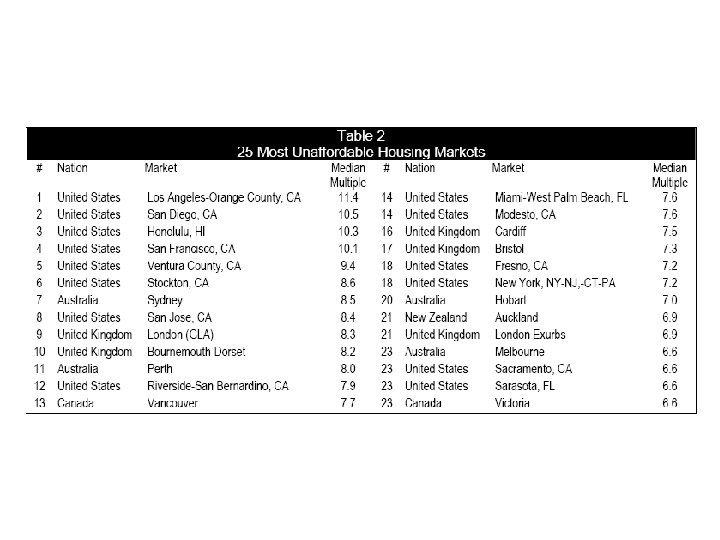
Least Affordable Markets • The least affordable markets are generally in California, Hawaii, the US East Coast, Australia, the United Kingdom, New Zealand Vancouver. • The least affordable market is Los Angeles & Orange County, with a Median Multiple of 11. 4, far above the “severely unaffordable” threshold of 5. 1 and approaching four times the 3. 0 “affordability” standard.
Least Affordable Markets • The Median Multiple is 8. 5 in Sydney, 8. 3 in London, 7. 7 in Vancouver, and 6. 9 in Auckland. • All of the 25 least affordable markets are rated “severely unaffordable” (Table 2). • Ireland’s only surveyed market, Dublin is also rated severely unaffordable, at 5. 7.
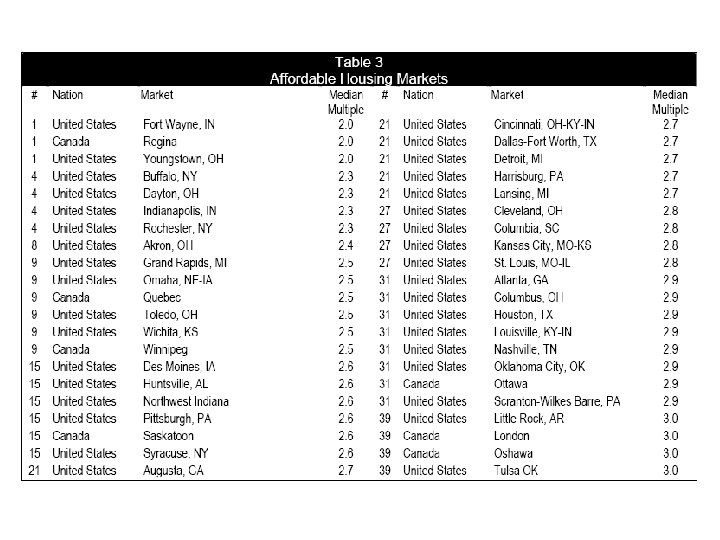
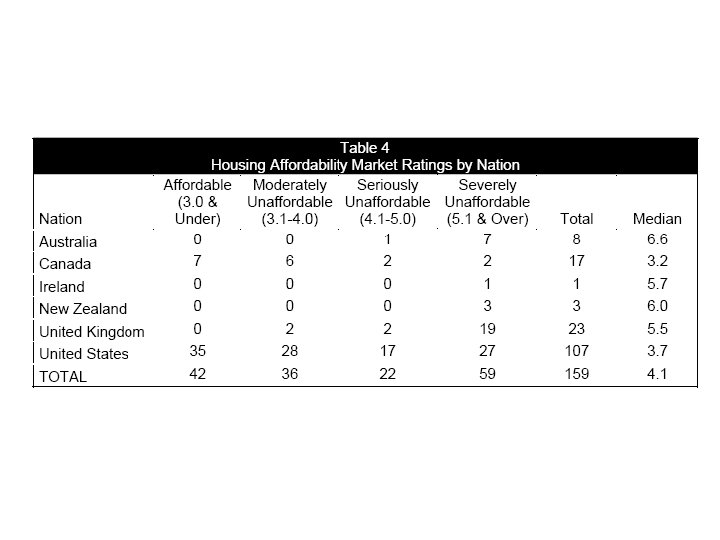
Affordable Markets Remain • At the same time, 42 markets remain “affordable. ” (Table 3) • Seven of the “affordable” markets are in Canada and 35 are in the United States. • The most affordable markets are Regina, Fort Wayne and Youngstown.
Affordable Markets Remain • Some of the fastest growing markets in the survey remain “affordable, ” such as Dallas -Fort Worth, Houston, Atlanta and Oshawa (Tables 3 and 4).
Home Ownership: The Social and Economic Imperatives • Home ownership has been a principal objective of public policy in all of the surveyed nations. • Each nation has increased its home ownership rates markedly since World War II. • There has been a strong association between expanded home ownership and improved affluence --- what can be called the democratization of prosperity.
Home Ownership: The Social and Economic Imperatives • This better quality of life appears to be threatened across the spectrum, from lower income households that will no longer be able to afford home ownership to middle income households, who will be able to afford only more modest houses. • The unprecedented decoupling of house prices from incomes could lead to significantly reduced home ownership rates in the decades to come.
Home Ownership: The Social and Economic Imperatives • For example, at Portland or Baltimore house prices, only 40 percent of households could afford a home, compared to the present national rate of nearly 70 percent. • At San Francisco prices, under 10 percent of households could afford to buy a home (Figure 1)
Figure 1
The High Cost of Decoupling House Prices from Incomes • The housing affordability crisis is of recent origin, principally over the past five to 10 years. Median Multiples of 4. 0 or more were rare before the 1990 s. • Median Multiples of double the affordability standard --- 6. 0 and above were virtually unheard of.
The High Cost of Decoupling House Prices from Incomes • Yet, today, the Median Multiple in exceeds 8. 0 in a number of markets and is more than 10 in some. • In Australia there has been a marked loss of affordability over the past 10 years (Figure 2).
Figure 2
The High Cost of Decoupling House Prices from Incomes • In the United States, two distinctively different classifications of housing inflation have developed over the past 10 years. • The most unaffordable markets have experienced a doubling of house costs relative to incomes. • Ten years ago these markets were nearly as affordable as today’s more affordable markets. (Figure 3).
Figure 3
The High Cost of Decoupling House Prices from Incomes • The inflation has been most pronounced in the last five years. • In better performing markets, such as Dallas-Fort Worth and Indianapolis, affordability has been maintained or improved. • In poorly performing markets, such as San Diego and Perth, housing affordability has been drastically reduced (Figure 4).
Figure 4
Depth of the Problem • In the most stressed markets, increased housing costs and mortgage interest can consume years of household gross income compared to just 10 years ago (Figure 5). • For example, in San Diego the median house price relative to incomes has risen by the equivalent of 14 years of median gross income. • In Perth, 11 more years of gross income will be required.
Figure 5
Depth of the Problem • For households in England, the toll is seven years of gross income, and six years in Dublin. • These huge additional expenditures for housing will considerably reduce purchasing power and are likely to lead to less economic growth and job creation.
Depth of the Problem • Further, there is likely to be less home ownership, especially among lower income households, which in some of the surveyed nations are disproportionately minority. • There could be even greater consequences, given the close connection between economic growth and social cohesion.
Unsatisfactory Explanations • Various explanations have been offered. • Perhaps the most recurring is that higher demand arising from low interest rates has driven up housing prices. • Another is that demand has changed radically, such that households now clamor for existing housing in better neighborhoods, with the heightened demand inflating housing prices. • Finally, it has been suggested that land owners on the periphery have colluded to inflate prices.
Unsatisfactory Explanations • Each of these explanations is rendered unsatisfactory, however, by the fact that the housing inflation has occured only in some markets. • Lower interest rates, a desire for better neighborhoods and the potential for collusion exist in virtually all markets, yet not all markets have experienced the housing cost inflation. • Australia shows that there has been a land supply problem not the inability of the home building industry to meet demand.
Unsatisfactory Explanations • Nearly 90 percent of the increase in house costs is attributable to land price inflation, which has risen at double the rate of most escalating component of the Consumer Price Index (Figures 6 and 7). • A satisfactory explanation must account for the price trends both in markets where there has been housing inflation and in markets where housing inflation has not occurred.
Figure 6
Figure 7
The Cause: Land Use Planning Excesses • Research in the surveyed nations identifies the cause --- the housing cost escalation is principally the result of supply factors. • Where there are significant constraints on the supply of land for residential development, housing inflation has occurred. • Where there are no such constraints, housing cost inflation has not occurred (Figure 8).
Figure 8
The Cause: Land Use Planning Excesses • Demand does not raise prices by itself. • Demand raises prices only where there is insufficient supply.
Land Use Policies that Produce Unaffordability • Various planning strategies have driven up the price of housing, such as land rationing (urban growth boundaries and infill requirements), extravagant amenity requirements, excessively high infrastructure fees and approval processes that are unnecessarily lengthy and complicated. • Indeed, planning permission (appropriate zoning) itself represents a significant add-on to the market value of land for residential development, represented by prices many times that of adjacent land without such permission.
Land Use Policies that Produce Unaffordability • The basic problem is that, in most of the least affordable markets, residential development is permitted only in accordance with inflexible government plans. • Where housing remains affordable, people’s preferences tend to drive development (consistent with environmental requirements). • This is illustrated by comparing the similar markets of Austin, Texas and Perth, Australia (Figure 9).
Figure 9
Land Use Policies that Produce Unaffordability • In Austin, a liberal regulatory regime has maintained affordability over the past decade. • In Perth, a restrictive regulatory regime has been associated with raising the total price, including interest, of the median house by the equivalent of 11 years of gross median household income relative to just 10 years ago (Figure 10).
Figure 10
Ignoring the Economic and Social Dimensions • Generally, government has imposed restrictive planning policies without fully considering, much less comprehending the ultimate impacts on the economy and quality of life. • Environmental and aesthetic issues, often real and sometimes exaggerated drove policy making, despite the fact that a clean environment can only be achieved by an affluent economy. • The longer term social implications, which are so tied to affluence and the economy, were also missed.
The Emerging Costly Reality of Land Use Planning • There is considerable evidence that restrictive land use policies compromise the competitiveness of urban areas and lead to less economic growth. • Home ownership among younger households is falling in the United Kingdom and Australia. • There is a rush of domestic migration away from the least affordable markets in the United States to the more affordable markets, reversing decades long demographic trends.
The Emerging Consensus: Land Use Planning Destroys Housing Affordability • At the policy level, there is an increased awareness of the nexus between restrictive land use planning and inflated housing prices. • Within the last year, Australia’s Prime Minister, Treasurer and Reserve Bank Governor have cited planning induced land shortages for the loss of housing affordability.
The Emerging Consensus: Land Use Planning Destroys Housing Affordability • Similar views have been expressed by New Zealand’s housing minister and mayors of major cities. • The United Kingdom’s Barker reports clearly blame land use planning for the runup of housing costs there.
Restoring Housing Affordability • Housing affordability can be restored by a program that re-establishes the balance between demand supply in unaffordable markets. • The most promising strategies are: – Housing affordability targets, – Liberalization of land use regulation and – Measures to ensure that price distortion does not occur on the fringe of urban areas.
Restoring Housing Affordability • There is also a need for focused research and improvements within planning education.