FINANCE FOR NON FINANCE EXECUTIVES FOR THE STAFF


 of")


 ASSETS LIABILITIES CAPITAL REVENUE EXPENSES")


 By Analysing Balance Sheet v We can evaluate company’s")


 NON CURRENT Support assets that")
 At Fair")


 Cost of Goods Sold Gross Profit 100, 000")


 Profit Margin Gross Profit/Revenue *100 Operating Profit Margin Operating Profit/Revenue *100 Net")
 Return on Equity PAT/Equity*100 Return of Capital Employed PAT/Capital Employed *100 Net")
 – borrowings divided by capital")


 A. operating expenses budget(made as a")

 ü This is the breakdown of the detailed")


-How quick we can realize our investment v")
 v the discount rate where")
- Slides: 50
FINANCE FOR NON - FINANCE EXECUTIVES FOR THE STAFF OF ICDA-STADA SEEDC&VEDC ZONE BY FRANK AGBOGWU(FCA, FCMA, MBA) PRESIDENT/CEO CTK LEADS ASSOCIATES LIMITED , LAGOS
Course Objectives By the end of this Finance for Non-Financial Managers training course your participants will be able to: Explain their impact on organisational finances and interpret key facts Understand financial terms and confidently discuss issues that affect company finance Interpret the three key financial statements – Profit & Loss, Balance Sheets and Cash Flow Plan, Implement and Monitor a Budget
FINANCING BASICS Finance is a field that is concerned with the allocation (investment) of assets and liabilities over space and time, often under conditions of risk or uncertainty. Finance can also be defined as the art of money management. Financial Management The planning, directing, monitoring, organizing, and controlling of the monetary resources of an organization. Financial management refers to the strategic planning, organising, directing, and controlling of financial undertakings in an organisation or an institute. It also includes applying management principles to the financial assets of an organisation, while also playing an important part in fiscal management. Take a look at the objectives involved:
Objectives Of Financial Management Maintaining enough supply of funds for the organisation; Ensuring shareholders of the organisation to get good returns on their investment; Optimum and efficient utilization of funds; Creating real and safe investment opportunities to invest in.
Why Finance for Non Finance Managers ü Financial literacy among all managers ü Ability to make informed decisions ü Know the financial implication of decisions at departmental levels ü Improved efficiency ü Improve the business bottom line
Three Basic Principles v Investment Principle: Every business invest in assets and incur debt v Financing Principle : Business can finance their operations with a mixture of tools that includes investments in assets or borrowing money such as loans v Dividend Principle : Successful business should return some money to its investor
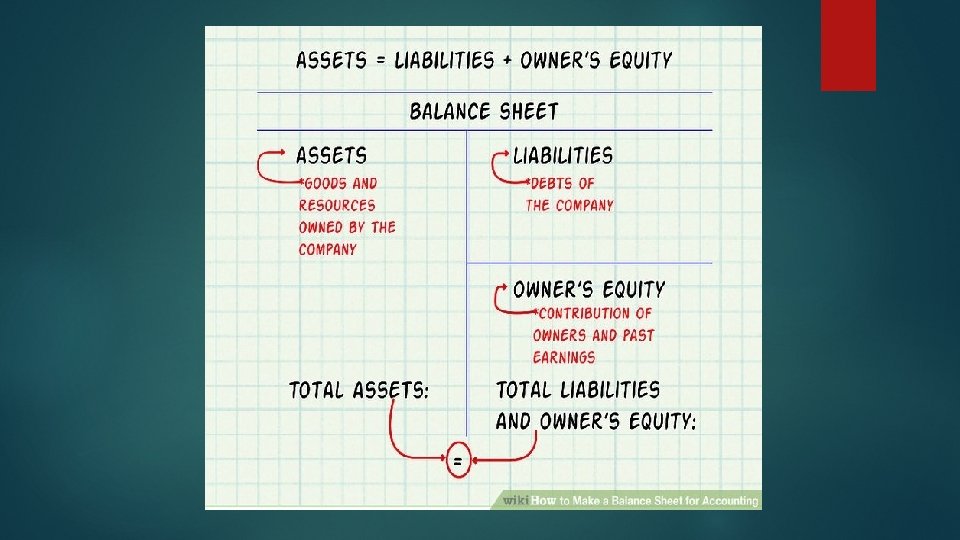
Groups Of Accounts(elements Of Financial Reports) ASSETS LIABILITIES CAPITAL REVENUE EXPENSES
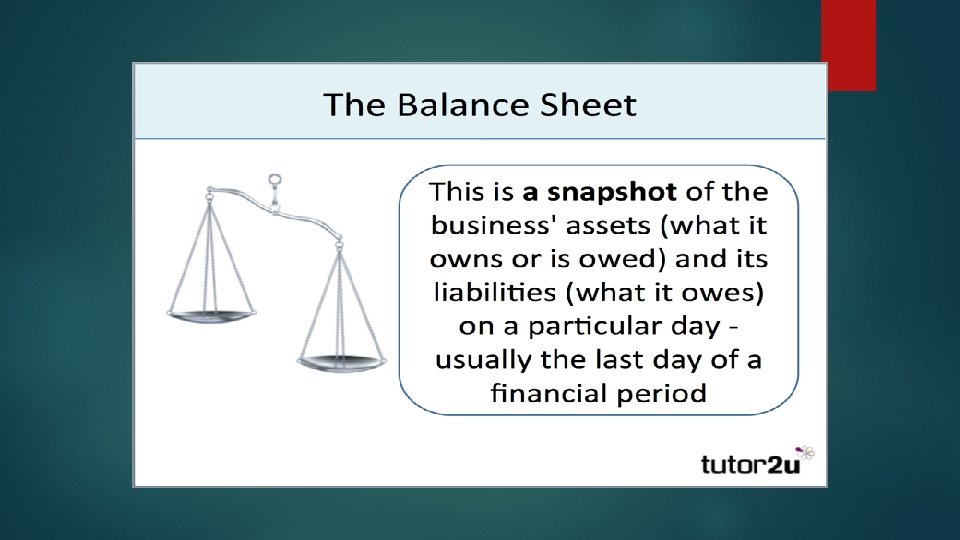
The Principal Financial Statements POSITION PERFORMANC E CASH FLOwe • Statement of Financial Position- a snapshot of the business financial position as ae a particular date; Summarises the Assets (what we own as a result of business activities) what we owe (business obligations that need to be settled • And Capital contribution (what we are bringing in as business owners to support investment in assets • Profit or Loss and Other Comprehensive Income Statement(matching income against expenses to determine the bottom line • Statement of Financial Performance • Cash flow statement showing the changes in beginning cash and ending cash position of the busness • Always reported to reflect cash from operating, investing and financing
Balance Sheet Financial Health refers to company’s ability to. . v Secure adequate resources to finance its future. v Maintain and Expand efficient operations. v Properly support its marketing efforts v Use technology to profitable advantages v Successfully compete A Snap shot of the business financial position at a point in time
Statement Of Financial Position(balance Sheet) By Analysing Balance Sheet v We can evaluate company’s asset management efficiency v The financial health of the bus v Effect of our various investment decisions
SAMPLE STATEMENT OF FINANCIAL POSITION- PROSPERITY LIMITED STATEMENT OF FINANCIAL POSITION AS AT DECEMBER 31, 2018 ASSETS LIABILITIES Non Current Assets ₦ CURRENT LIABILITIES ₦ Plant, Property &Equipment 50, 000 Accounts Payable 26, 000 Long term Investment 2500 Accrued Expense 750 TOTAL NON- CURRENT ASSETS 52, 500 Taxes Payable 250 Current Assets TOTAL CURRENT LIABILITIES 27, 000 Cash &Bank Balances 1500 Inventories 50, 000 Account Receivables 22, 000 Long Term Loan 30, 000 OWNERS EQUITY TOTAL LIABILITIES 57, 000 TOTAL CURRENT ASSETS 73, 500 Paid Up Share Capital 45, 000 Retained Earnings 24, 000 TOTAL OWNERS EQUITY 69, 000 TOTAL ASSETS LIABILITIES+ EQUITY 126, 000
COMPONENTS OF THE STATEMENT OF FINANCIAL POSITION ASSETS What are assets? Characteristics of assets Reporting Assets in the Books LIABILITIES What are Liabilities Characteristics of Liabilities Reporting of Liabilities EQUITY (CAPITAL)
Balance Sheet Three Sections Assets : The item of value owned by the company Liabilities : The Company’s obligation, whether to pay for or provide goods or services at a future date. Equity : Amount of Net
ASSETS CURRENT (used within 12 months to generate revenue) NON CURRENT Support assets that are used more than one year eg land, building, m/v, furniture)
Reporting of Asset reporting, measurement and recognition ASSETS At Cost (Initial Recognition) At Fair Value (subsequent Reporting)
LIABILITIES Current Liabilities Long Term Liabilities
What Balance Sheet Tells You Summary of the organization’s assets and the claim against those assets as of a specific date. Information about the organization’s current ability to pay its current debt. How organization is positioned to keep going with the day to day business operations. The level of solvency The state of the business financial health
What Balance Sheet does not Tell How any profits were made. Which assets creditors have claimed against. What kind of capital investment (Land, Building etc) was made. What value the business would have on the market place
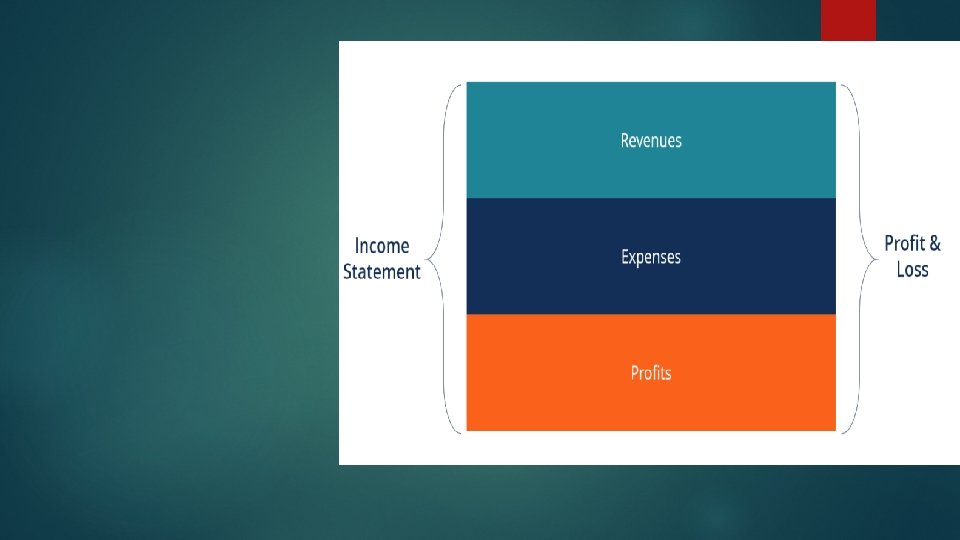
Profit or Loss Account – Income Statement It describes performance of the company over a period of time. It talks about company’s achievements (Revenue) and also the resources (Expenses) Elements Revenue : Incoming assets in return of sold goods or services Expenses : Outgoing assets or liabilities incurred Net Income : Difference between Revenue and Expense
PROFIT V INCOME Profit in simple terms is the surplus amount left after deducting all the expenses from the revenue. Income in simple terms is the actual amount of money earned by a company Profit in company accounting can be divided into two – gross profit and net profit. Gross profit is the revenue minus cost of goods sold. Also, please note that Income is also divided into two – earned income and unearned income. Earned income is the income from the sales of goods or services. Unearned income is the passive income made through investments made in other places.
SAMPLE INCOME STATEMENT ₦, 000 Revenue(Sales) Cost of Goods Sold Gross Profit 100, 000 (65, 000) 35, 000 OPERATING EXPENSES Selling &Distribution 5, 000 Admin & General Expenses 7, 500 Total Operating Expenses OPERATING PROFIT Finance Cost (net) PROFIT BEFOR TAX Tax Profit After Tax 12, 500 22, 500 3, 500 19, 000 2, 500 16, 500
Income & Expenses Income is increases in economic benefits during the accounting period in the form of inflows or enhancements of assets or decreases of liabilities that result in increases in equity, other than those relating to contributions from equity participants. It comes from sale of goods or services rendered Expenses are decreases in economic benefits during the accounting period in the form of outflows or depletions of assets or incurrences of liabilities that result in decreases in equity, other than those relating to distributions to equity participants.
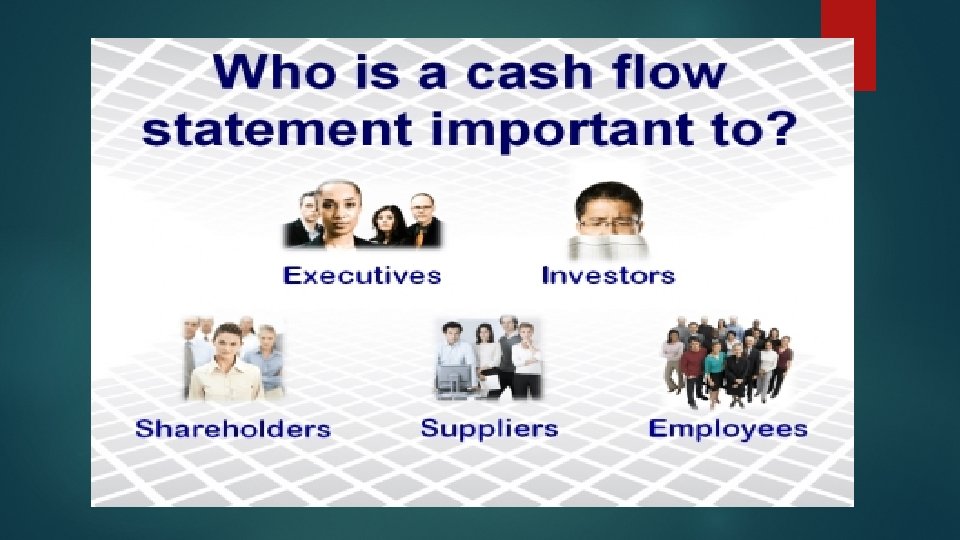
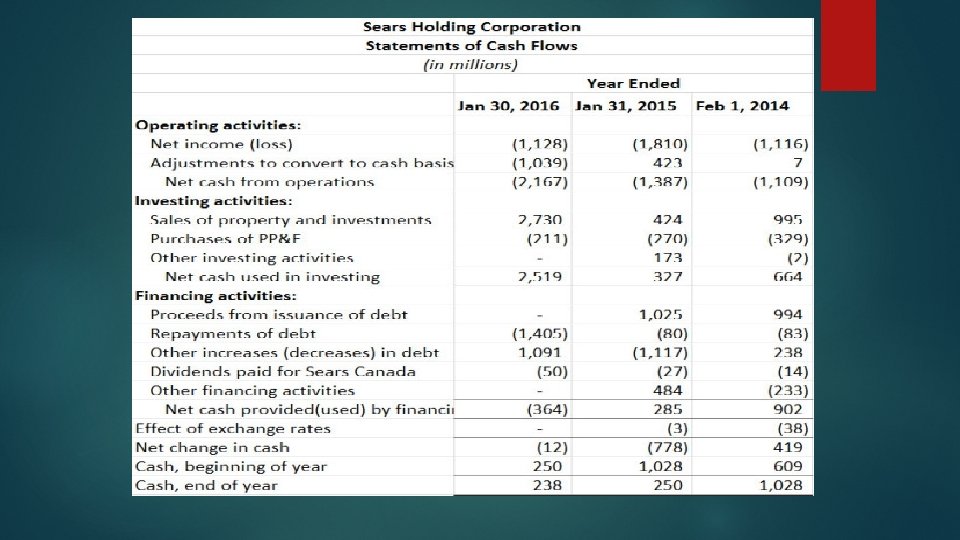
Cash Flow Statement Cash Flow Cash Coming in Revenue, Other Income Cash Going out Expenses, Tax, Interest etc Cash Flow = Cash Coming in – Cash Going out
SEGMENTS OF A CASH FLOW STATEMENT
ANALYSING FINANCIAL STATEMENTS
FINANCIAL RATIOS When evaluating the financial health of a company, there are ratios used to assess the health of the company These are: Liquidity Solvency Profitability Efficiency Investment
PROFITABILITY ANALYSIS : SOME COMMON ITEMS EBITDA – earnings before interest, tax, depreciation and amortisation of goodwill, sometimes known as gross cash profits EBIT (or PBIT) – earnings (or profit) before interest and tax EBT (or PBT) – earnings (or profit) before tax Earnings – profit after tax
PROFITABILITY RATIOS(MARGINS) Profit Margin Gross Profit/Revenue *100 Operating Profit Margin Operating Profit/Revenue *100 Net Profit Margin(Return on Sale) Net Profit after Tax/Revenue *100
PROFITABILITY RATIOS(RETURNS) Return on Equity PAT/Equity*100 Return of Capital Employed PAT/Capital Employed *100 Net Profit Margin(Return on Sale) Profit After Tax/Total Assets *100
ANALYSING FINANCIAL STATEMENTS Long Term Solvency Gearing (or leverage) – borrowings divided by capital employed TOTAL DEBT/TOTAL EQUITY Interest cover – profit before interest and tax divided by interest paid EBIT/INTERST
ANALYSING FINANCIAL STATEMENTS LIQUIDITY RATIOS Current Ratios- current assets/current Liabilities Acid Test Ratio: CA-Inventory/Current Liabilities CA-inventory/CL CA/CL Ratio 2: 1 Acceptable (current assets should cover current liabilities twice The near liquid assets should cover the libilities 100% Working Capital = Current Assets less Current Liabilities
ANALYSING FINANCIAL STATEMENTS EFFICIENCY RATIOS Inventory days on hand Av Inventory/cogs*365 Account Receivable Days on Hand Account Recivable/Sale *365 Accounts Payable Days On Hand Accounts Payable/COGS*365 Operating Cycle = INDOH+ARDOH- APDOH An increase in the number of days is a warning sign that cash is being tied down within the cycle
Budgets And Business Plans Budget is the expression of your business plan in monetary terms
MASTER BUDGET INCOME BUDGET = Project your Income first. This is the key driver of the entire budget. ISSUES CONSIDERED External Environment(macro economic factors, GDP Inflation, interest rates) Production capacity Market size Competition Management Capability
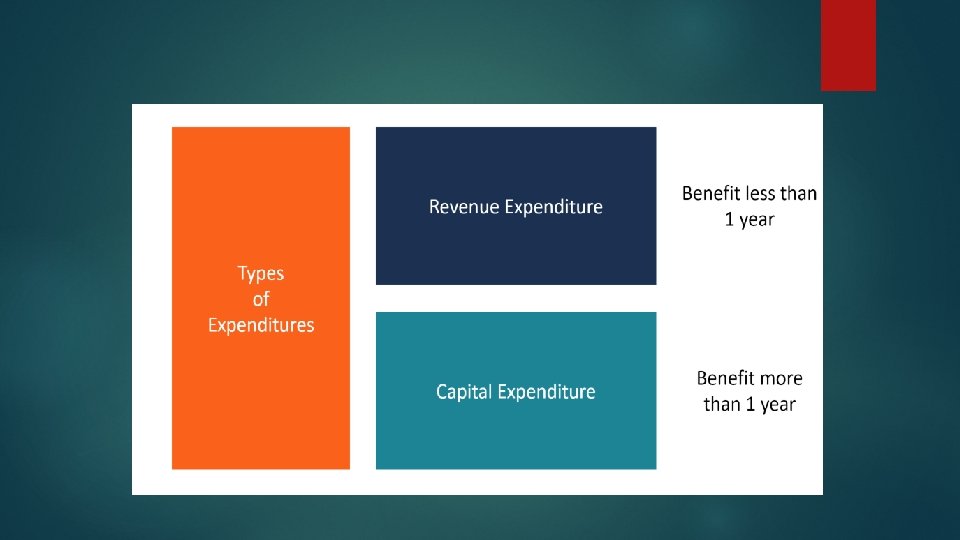
OTHER COMPONENTS Majorly derived from the income(revenue budget) A. operating expenses budget(made as a ratio of income or estimated on the bases of inflationary trend This can be budgeted on individual expense head or by function B. Finance Cost/Expense – estimated on the bases of level of borrowing and the going lending rates offered by the banks
CAPITAL EXPENDITURE BUDGET Budgets for long term assets eg Motor vehicle, plants and Machinery, furniture &fittings Always based on planed expansion in business capacity orupgrade of existing ones to meet market demand
CASH BUDGET(month –on – month ) ü This is the breakdown of the detailed budget into monthly components ü Very important for financial and liquidity management ü An indicator of the future cash position, when to borrow or when to expect excess cash and safe
PROSPERITY LIMITED SIX MONTHS CASH BUDGET March April May June July August INLOWS ₦, 000 ₦, 000 Cash Sale x x x Collection on Account x x x Others X X X TOTAL INFLOWS XX XX XX Salaries X X X Other Admin Expenses X X X Interst Payment X X X Selling and Distribution X X X TOTAL OUTFLOWS XX XX XX INFLOW- OUTFLOWS XXX XXX XXX OUTFLOWS
INVESTMENT ANALYSIS Time Value of Money A one naira invested today is not of the same value in five years time Compounding interest Discounting interest
CAPITAL EXPENDITURE EVALUATION METHODS Pay back Periods(PB)-How quick we can realize our investment v The fast the better considering the time value of money v the return period must not exceed the life span of the asset financed Net Present Value(NPV) v Discounting future cash flow to todays value v Accept/ Reject Rule (accept when the NPV is positive v Discount factor Internal Rate of Return (IRR) Accounting Rate of Return (ARR)
CAPITAL EXPENDITURE EVALUATION METHODS Internal Rate of Return (IRR) v the discount rate where the NPV will be zero v Accounting Rate of Return (ARR) v using accounting profit to assess returns