Effects of the My Teaching Partner Intervention in



- Slides: 43
Effects of the My Teaching Partner Intervention in Secondary School Classrooms Joseph P. Allen Robert C. Pianta University of Virginia Co-Collaborators: Amori Mikami Anne Gregory Project Team: Chris Hafen Sharon Deal Judith Wasserman Rachel Boren Janetta Lun
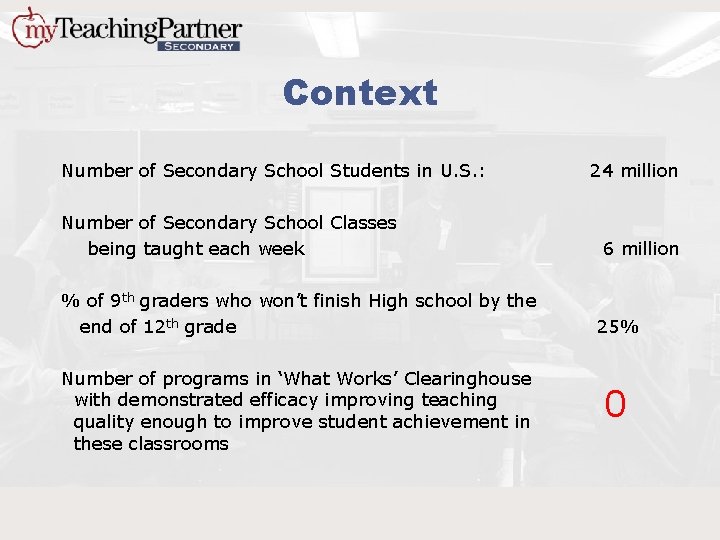
Context Number of Secondary School Students in U. S. : Number of Secondary School Classes being taught each week % of 9 th graders who won’t finish High school by the end of 12 th grade Number of programs in ‘What Works’ Clearinghouse with demonstrated efficacy improving teaching quality enough to improve student achievement in these classrooms 24 million 6 million 25% 0
Key Questions • Can we identify teacher-student interaction qualities that predict student engagement and achievement? • Can we change these qualities? • Will changes lead to sustainable student achievement gains? • What are the mechanisms of change?
Key Questions • Can we identify teacher-student interaction qualities that predict student engagement and achievement? • Can we change these qualities? • Will changes lead to sustainable student achievement gains? • What are the mechanisms of change?
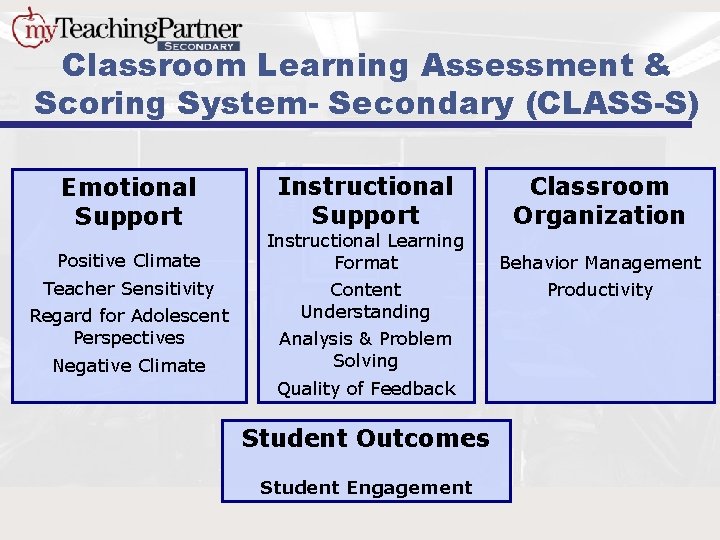
Classroom Learning Assessment & Scoring System- Secondary (CLASS-S) Emotional Support Positive Climate Teacher Sensitivity Regard for Adolescent Perspectives Negative Climate Instructional Support Instructional Learning Format Content Understanding Analysis & Problem Solving Quality of Feedback Student Outcomes Student Engagement Classroom Organization Behavior Management Productivity
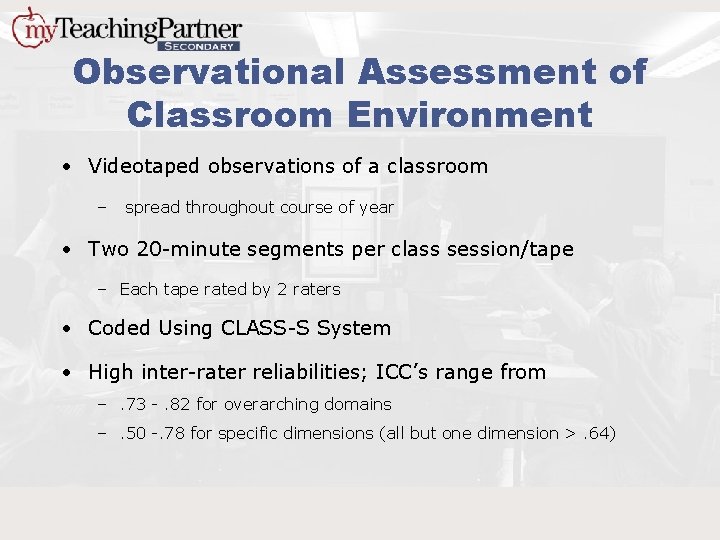
Observational Assessment of Classroom Environment • Videotaped observations of a classroom – spread throughout course of year • Two 20 -minute segments per class session/tape – Each tape rated by 2 raters • Coded Using CLASS-S System • High inter-rater reliabilities; ICC’s range from –. 73 -. 82 for overarching domains –. 50 -. 78 for specific dimensions (all but one dimension >. 64)
Student Academic Success • Score on State “Standards of Learning” End of Year Subject Test • The measure by which schools/students are judged for accreditation/graduation. • Extensive seven-year validation/standardization process.
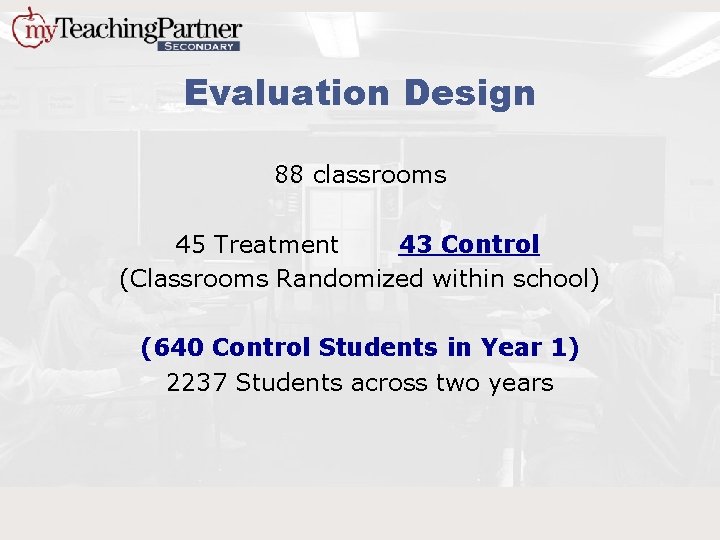
Evaluation Design 88 classrooms 45 Treatment 43 Control (Classrooms Randomized within school) (640 Control Students in Year 1) 2237 Students across two years
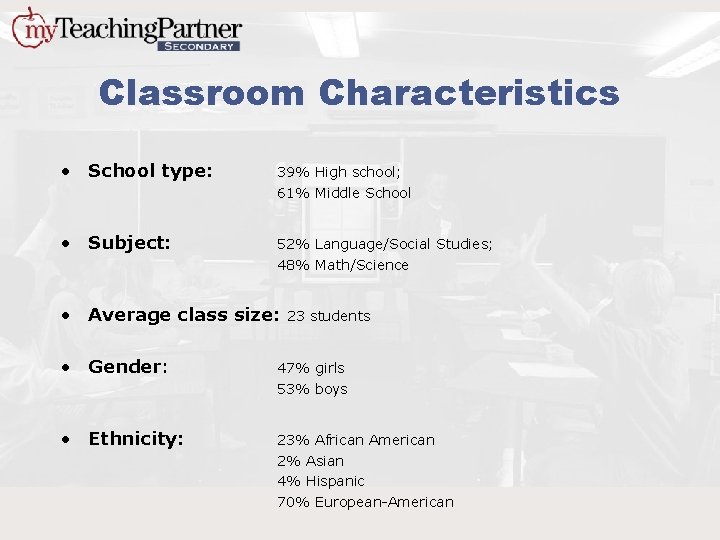
Classroom Characteristics • School type: 39% High school; 61% Middle School • Subject: 52% Language/Social Studies; 48% Math/Science • Average class size: 23 students • Gender: 47% girls 53% boys • Ethnicity: 23% African American 2% Asian 4% Hispanic 70% European-American
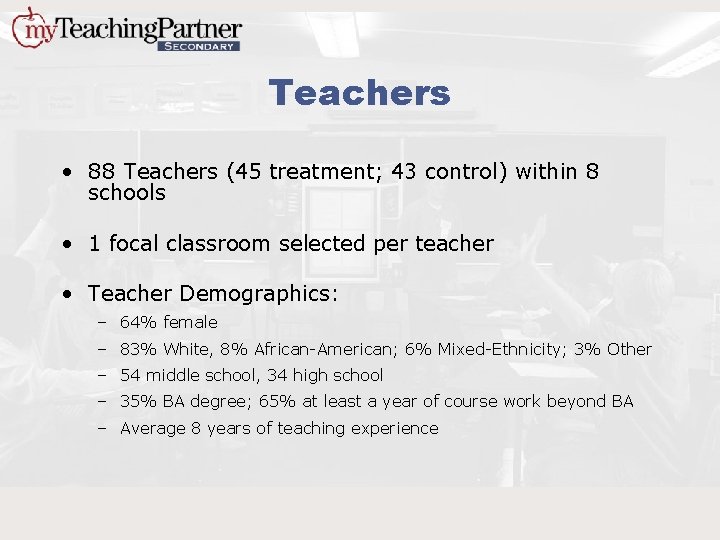
Teachers • 88 Teachers (45 treatment; 43 control) within 8 schools • 1 focal classroom selected per teacher • Teacher Demographics: – 64% female – 83% White, 8% African-American; 6% Mixed-Ethnicity; 3% Other – 54 middle school, 34 high school – 35% BA degree; 65% at least a year of course work beyond BA – Average 8 years of teaching experience
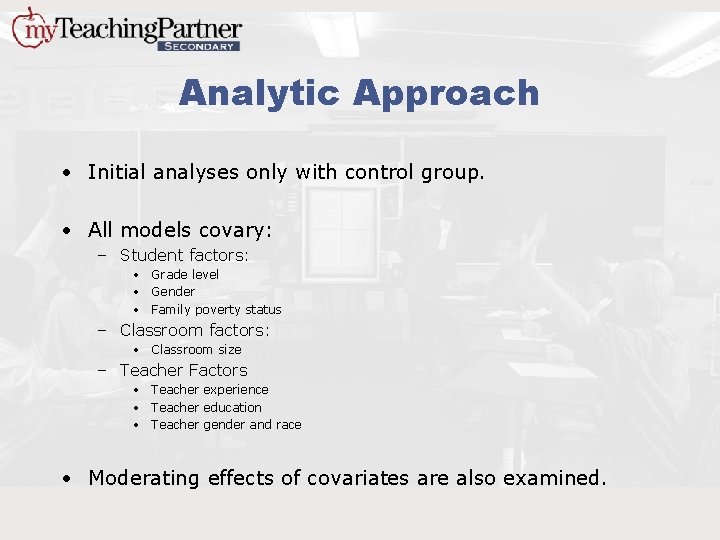
Analytic Approach • Initial analyses only with control group. • All models covary: – Student factors: • Grade level • Gender • Family poverty status – Classroom factors: • Classroom size – Teacher Factors • Teacher experience • Teacher education • Teacher gender and race • Moderating effects of covariates are also examined.
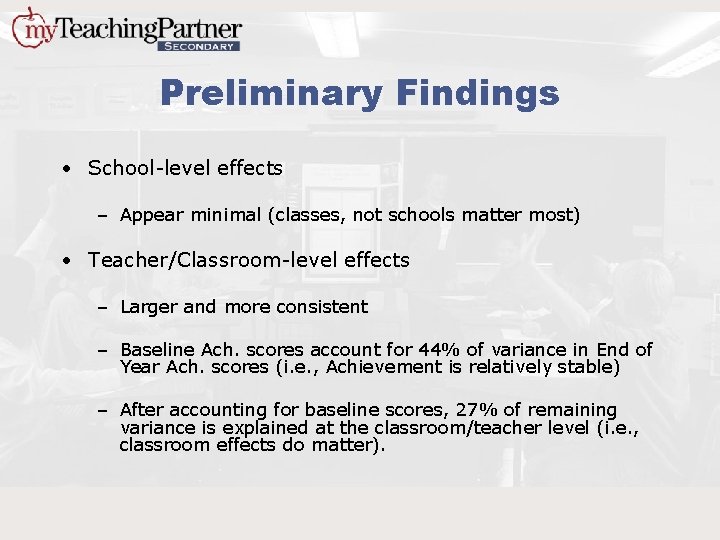
Preliminary Findings • School-level effects – Appear minimal (classes, not schools matter most) • Teacher/Classroom-level effects – Larger and more consistent – Baseline Ach. scores account for 44% of variance in End of Year Ach. scores (i. e. , Achievement is relatively stable) – After accounting for baseline scores, 27% of remaining variance is explained at the classroom/teacher level (i. e. , classroom effects do matter).
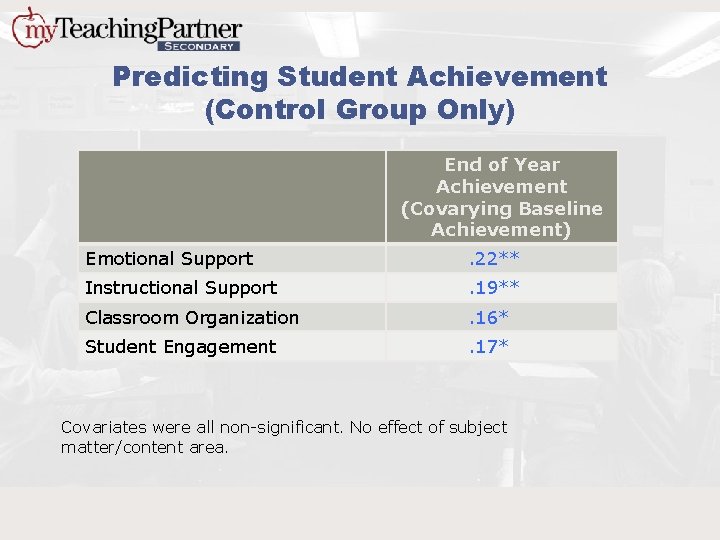
Predicting Student Achievement (Control Group Only) End of Year Achievement (Covarying Baseline Achievement) Emotional Support . 22** Instructional Support . 19** Classroom Organization . 16* Student Engagement . 17* Covariates were all non-significant. No effect of subject matter/content area.
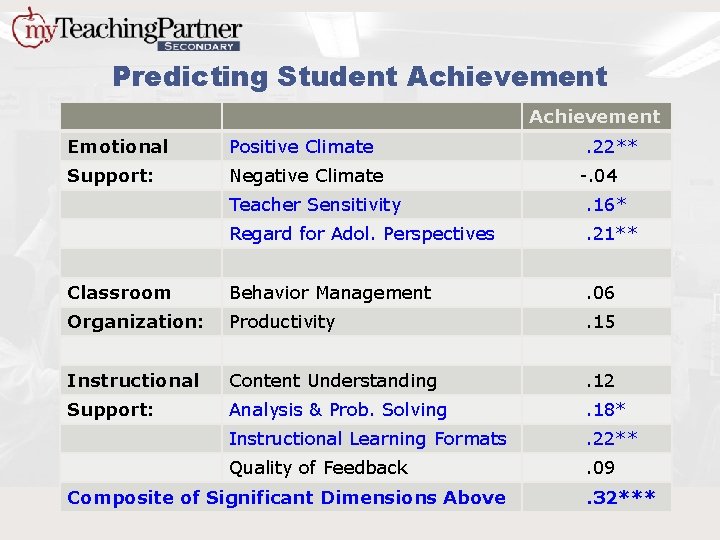
Predicting Student Achievement Emotional Positive Climate Support: Negative Climate . 22** -. 04 Teacher Sensitivity . 16* Regard for Adol. Perspectives . 21** Classroom Behavior Management . 06 Organization: Productivity . 15 Instructional Content Understanding . 12 Support: Analysis & Prob. Solving . 18* Instructional Learning Formats . 22** Quality of Feedback . 09 Composite of Significant Dimensions Above . 32***
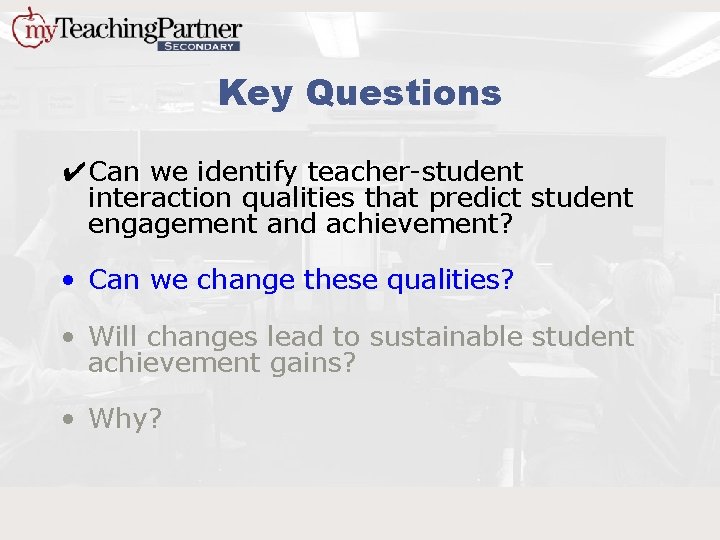
Key Questions ✔Can we identify teacher-student interaction qualities that predict student engagement and achievement? • Can we change these qualities? • Will changes lead to sustainable student achievement gains? • Why?
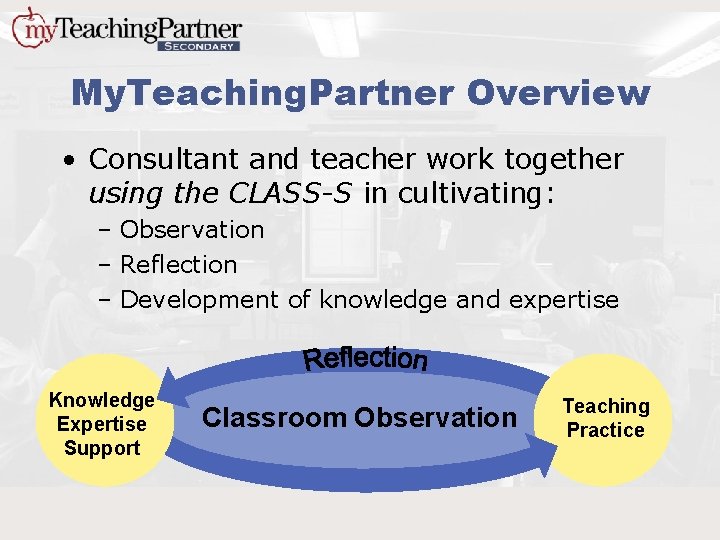
My. Teaching. Partner Overview • Consultant and teacher work together using the CLASS-S in cultivating: – Observation – Reflection – Development of knowledge and expertise Knowledge Expertise Support Classroom Observation Teaching Practice
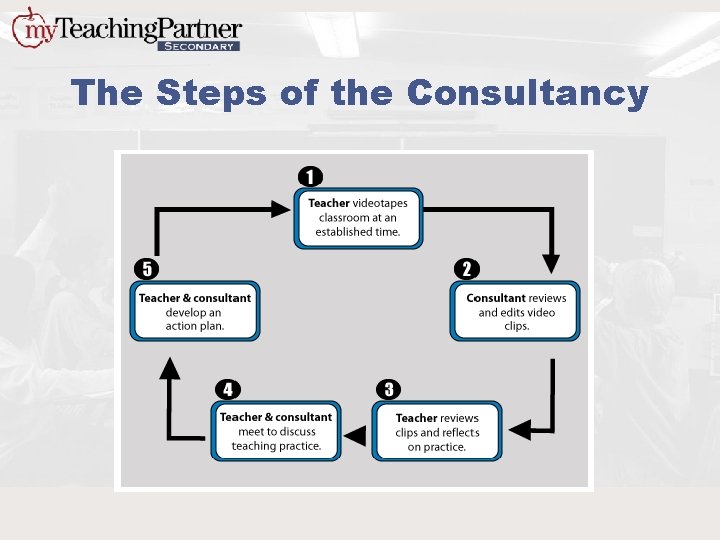
The Steps of the Consultancy
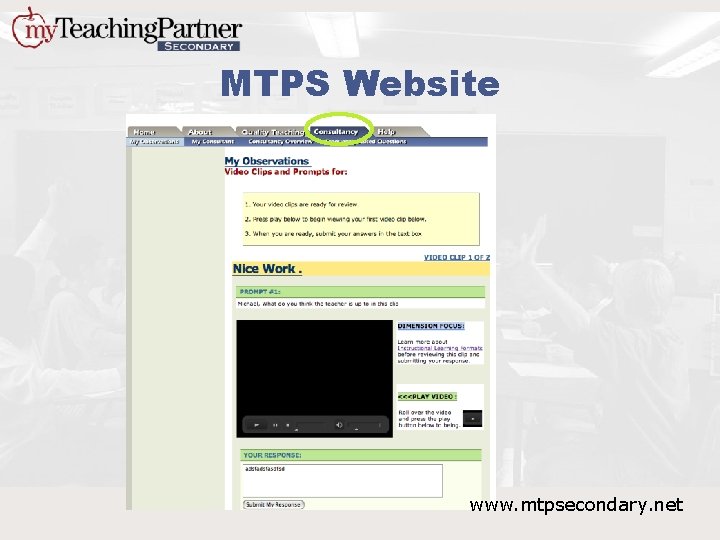
MTPS Website www. mtpsecondary. net
Video Library www. mtpsecondary. net
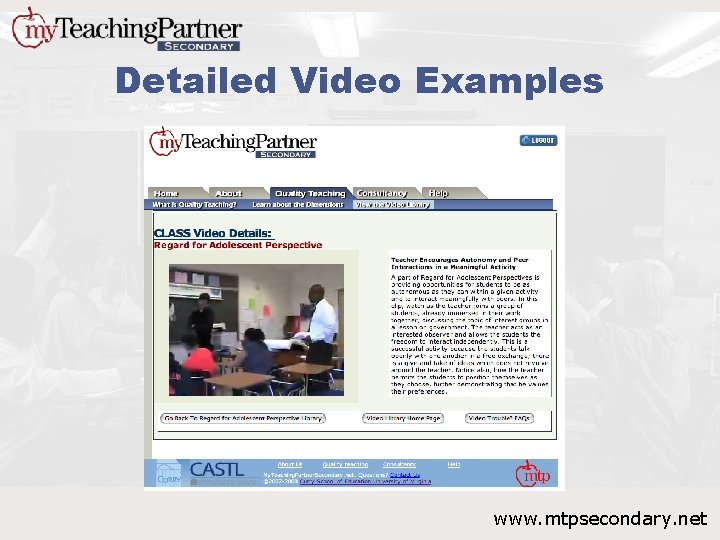
Detailed Video Examples www. mtpsecondary. net
Key Questions ✔Can we identify teacher-student interaction qualities that predict student engagement and achievement? • Can we change these qualities? • Will changes lead to sustainable student achievement gains? • What are the mechanisms of change?
Evaluation Design Treatment group: Year 1: – Introductory Workshop (late summer) – Ongoing consultancy – ~ 2 days total in-service time Year 2: – Booster Workshop (late summer) only + Web site access • Control group: Usual in-service practice.
Evaluation Design 88 classrooms 45 Tx. 43 Control (Classrooms Randomized within school) 2237 Students
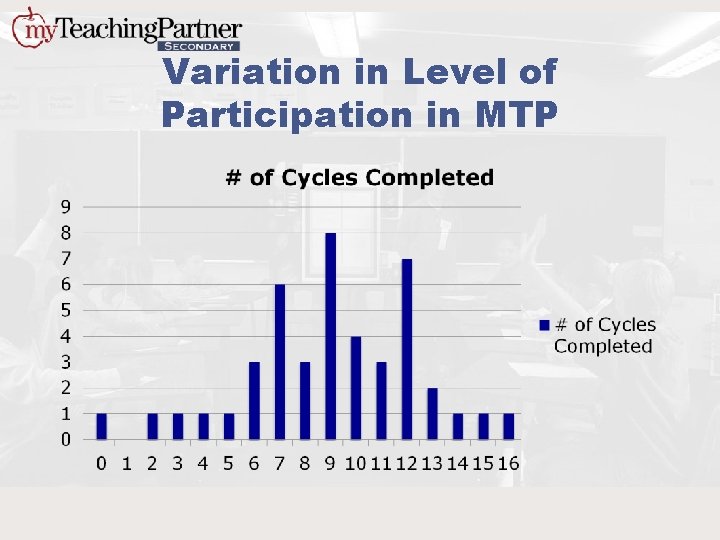
Variation in Level of Participation in MTP
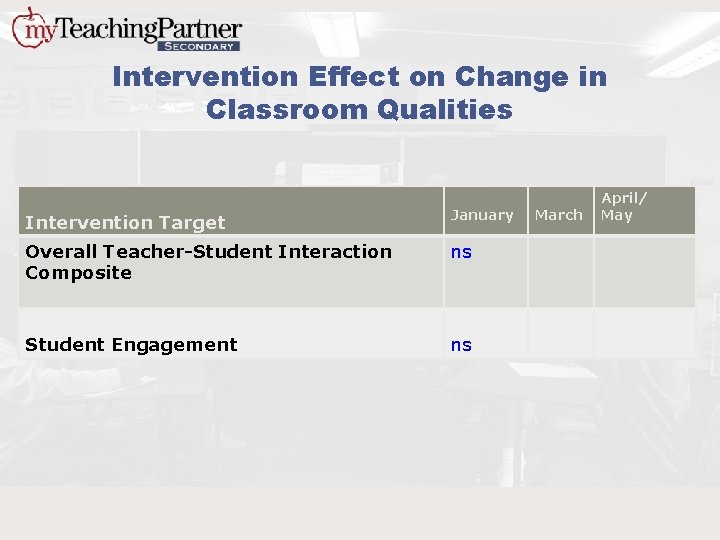
Intervention Effect on Change in Classroom Qualities Intervention Target January Overall Teacher-Student Interaction Composite ns Student Engagement ns March April/ May
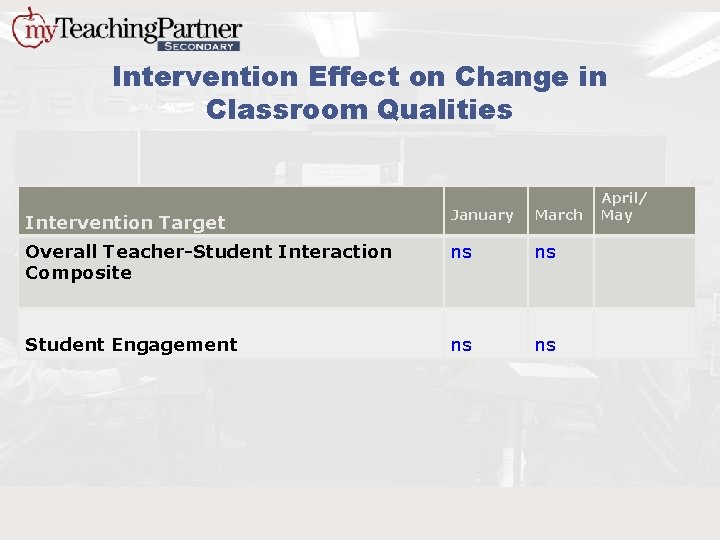
Intervention Effect on Change in Classroom Qualities Intervention Target January March Overall Teacher-Student Interaction Composite ns ns Student Engagement ns ns April/ May
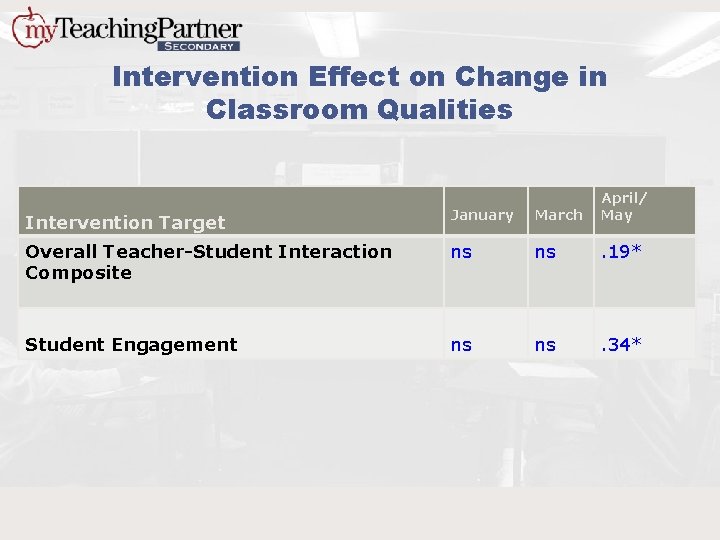
Intervention Effect on Change in Classroom Qualities Intervention Target January March April/ May Overall Teacher-Student Interaction Composite ns ns . 19* Student Engagement ns ns . 34*
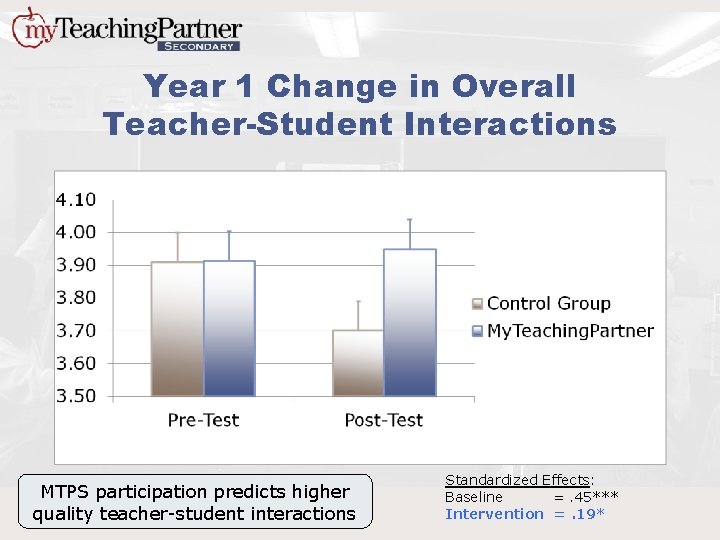
Year 1 Change in Overall Teacher-Student Interactions MTPS participation predicts higher quality teacher-student interactions Standardized Effects: Baseline =. 45*** Intervention =. 19*
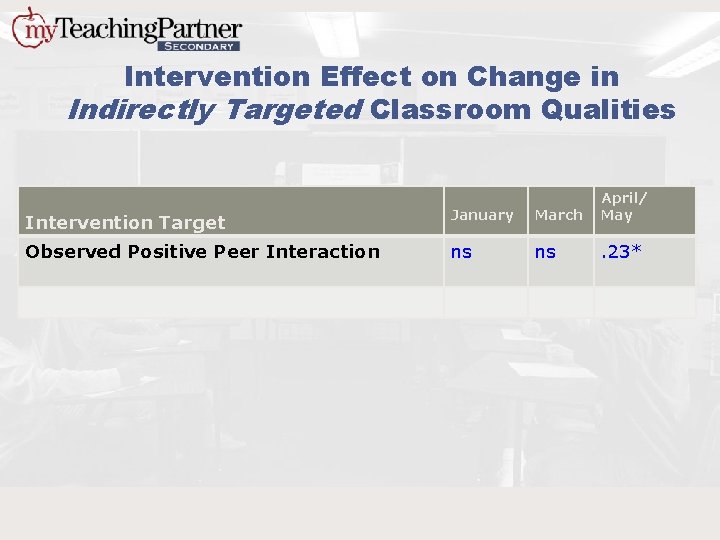
Intervention Effect on Change in Indirectly Targeted Classroom Qualities Intervention Target January March April/ May Observed Positive Peer Interaction ns ns . 23*
Key Questions ✔Can we identify teacher-student interaction qualities that predict student engagement and achievement? ✔Can we change these qualities? • Will changes lead to sustainable student achievement gains? • What are the mechanisms of change?
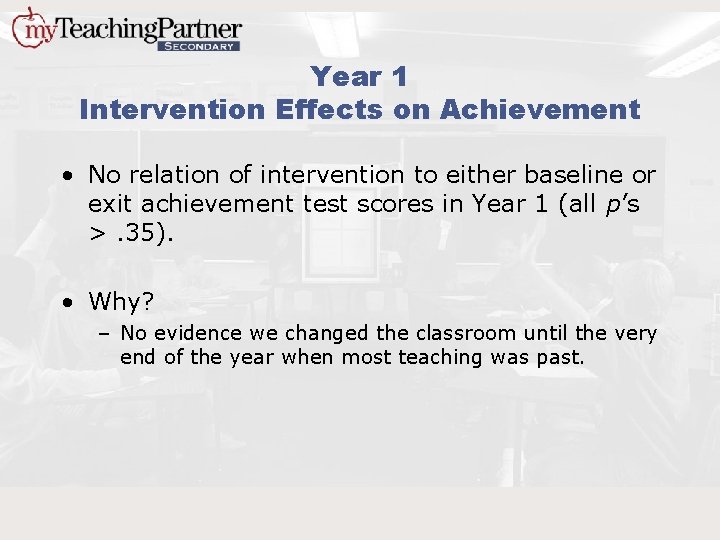
Year 1 Intervention Effects on Achievement • No relation of intervention to either baseline or exit achievement test scores in Year 1 (all p’s >. 35). • Why? – No evidence we changed the classroom until the very end of the year when most teaching was past.
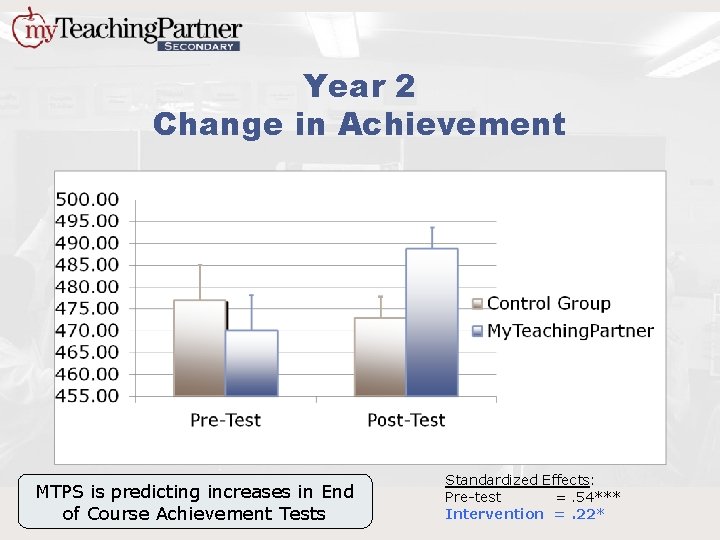
Year 2 Change in Achievement MTPS is predicting increases in End of Course Achievement Tests Standardized Effects: Pre-test =. 54*** Intervention =. 22*
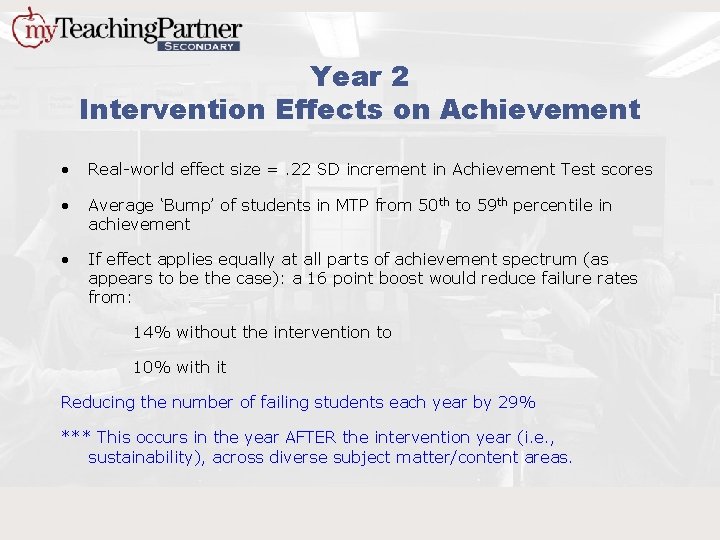
Year 2 Intervention Effects on Achievement • Real-world effect size =. 22 SD increment in Achievement Test scores • Average ‘Bump’ of students in MTP from 50 th to 59 th percentile in achievement • If effect applies equally at all parts of achievement spectrum (as appears to be the case): a 16 point boost would reduce failure rates from: 14% without the intervention to 10% with it Reducing the number of failing students each year by 29% *** This occurs in the year AFTER the intervention year (i. e. , sustainability), across diverse subject matter/content areas.
Key Questions ✔Can we identify teacher-student interaction qualities that predict student engagement and achievement? ✔Can we change these qualities? ✔Will changes lead to sustainable student achievement gains? • What are the mechanisms of change?
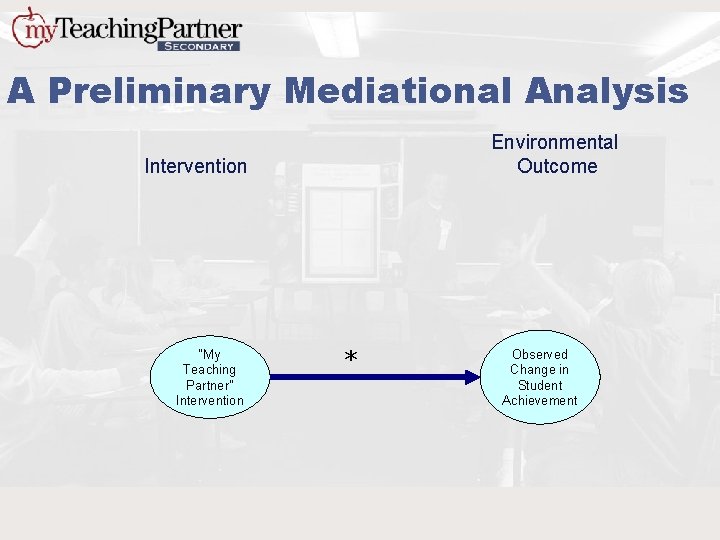
A Preliminary Mediational Analysis Environmental Outcome Intervention “My Teaching Partner” Intervention * Observed Change in Student Achievement
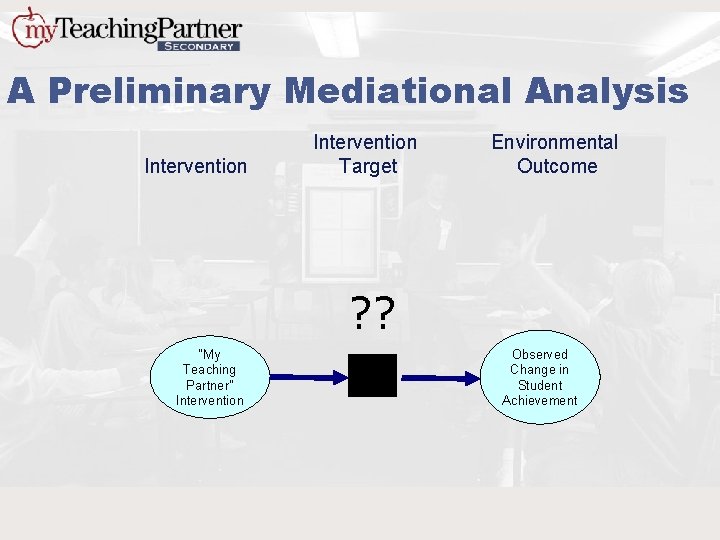
A Preliminary Mediational Analysis Intervention Target Environmental Outcome ? ? “My Teaching Partner” Intervention Observed Change in Student Achievement
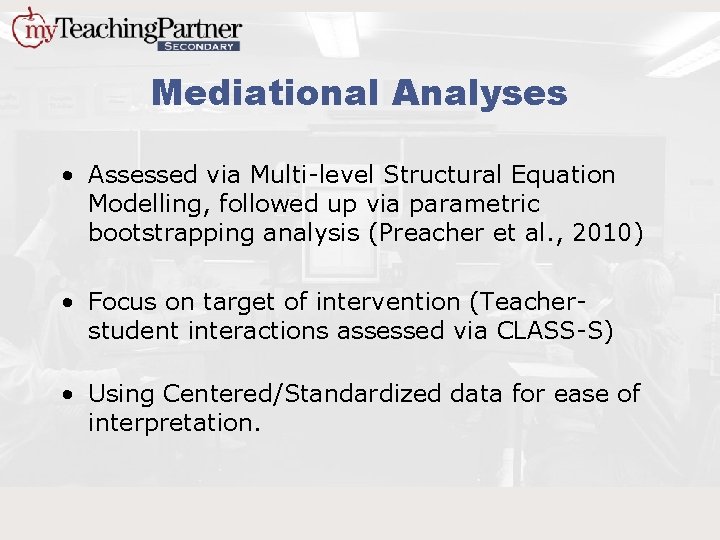
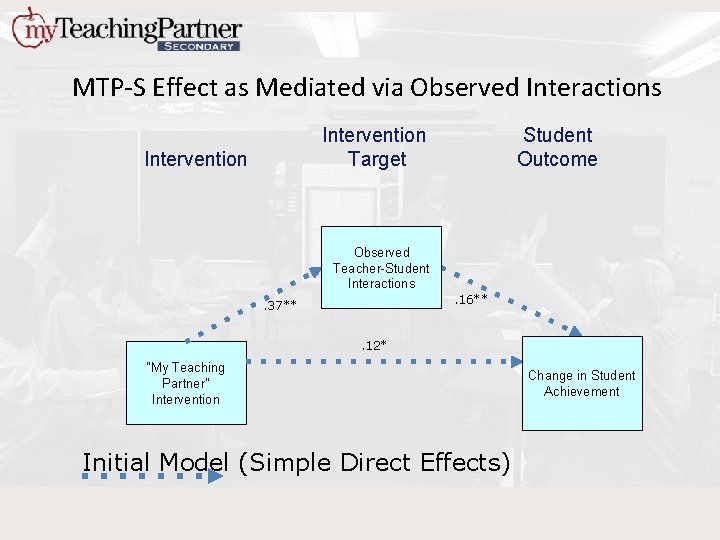
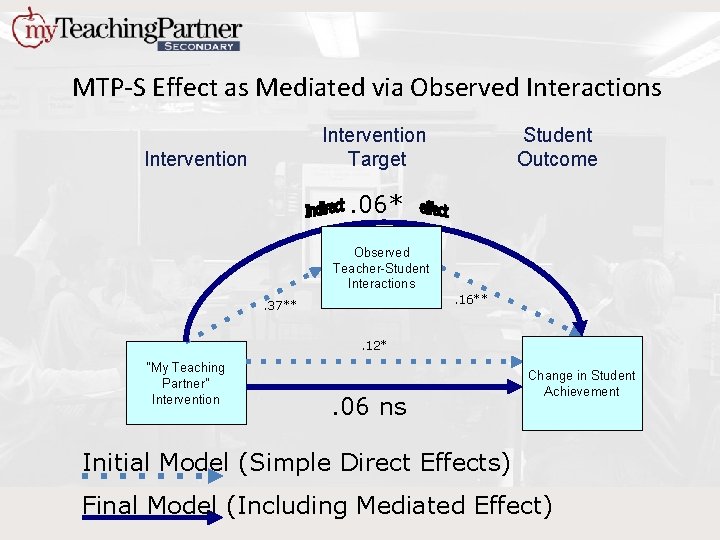
Mediational Analyses • Assessed via Multi-level Structural Equation Modelling, followed up via parametric bootstrapping analysis (Preacher et al. , 2010) • Focus on target of intervention (Teacherstudent interactions assessed via CLASS-S) • Using Centered/Standardized data for ease of interpretation.
MTP-S Effect as Mediated via Observed Interactions Intervention Target Intervention Student Outcome Observed Teacher-Student Interactions. 16** . 37**. 12* “My Teaching Partner” Intervention Initial Model (Simple Direct Effects) Change in Student Achievement
MTP-S Effect as Mediated via Observed Interactions Intervention Target Intervention Student Outcome . 06* * Observed Teacher-Student Interactions. 16** . 37**. 12* “My Teaching Partner” Intervention . 06 ns Change in Student Achievement Initial Model (Simple Direct Effects) Final Model (Including Mediated Effect)
Limitations • Design only supports causal interpretations for outcomes, not for mediating processes with analyses thus far. • Attrition Concerns (though positing attrition ‘sleeper’ effects in year 2 achievement data seems like a stretch). • Modest statistical significance
Conclusions • We CAN identify elements of the classroom environment that predict student achievement. • We CAN change these environmental factors. • If we do, student achievement will change as well, eventually. • Changes can be sustained over time and in new classrooms, postintervention. • We can identify potential mechanisms of change linked to the intervention.
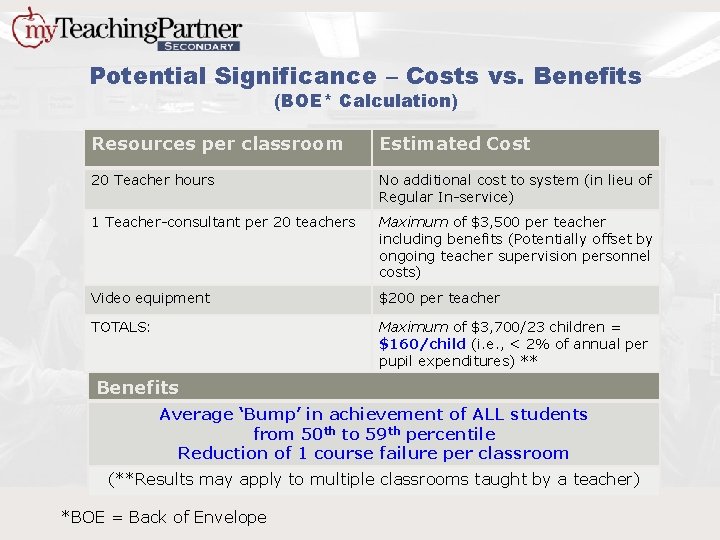
Potential Significance – Costs vs. Benefits (BOE* Calculation) Resources per classroom Estimated Cost 20 Teacher hours No additional cost to system (in lieu of Regular In-service) 1 Teacher-consultant per 20 teachers Maximum of $3, 500 per teacher including benefits (Potentially offset by ongoing teacher supervision personnel costs) Video equipment $200 per teacher TOTALS: Maximum of $3, 700/23 children = $160/child (i. e. , < 2% of annual per pupil expenditures) ** Benefits Average ‘Bump’ in achievement of ALL students from 50 th to 59 th percentile Reduction of 1 course failure per classroom (**Results may apply to multiple classrooms taught by a teacher) *BOE = Back of Envelope
My. Teaching. Partner Secondary