Analisi di Correlazioni Alessandro Giuliani Del Rigore della


 tra l’accorciamento delle gonne e congiuntura economica positiva è")

 A) 0. 96. tanh(6. 99")


 on and indpendent one (X) generates a model")
)2 = minimum La soluzione")


 tal quale")


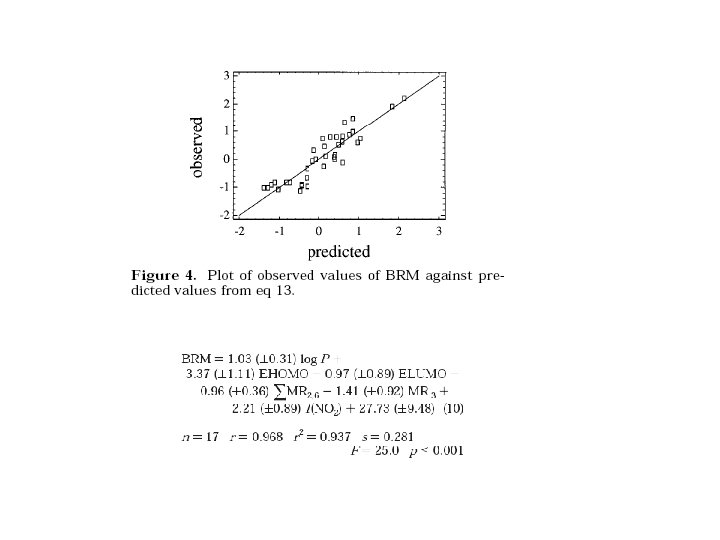
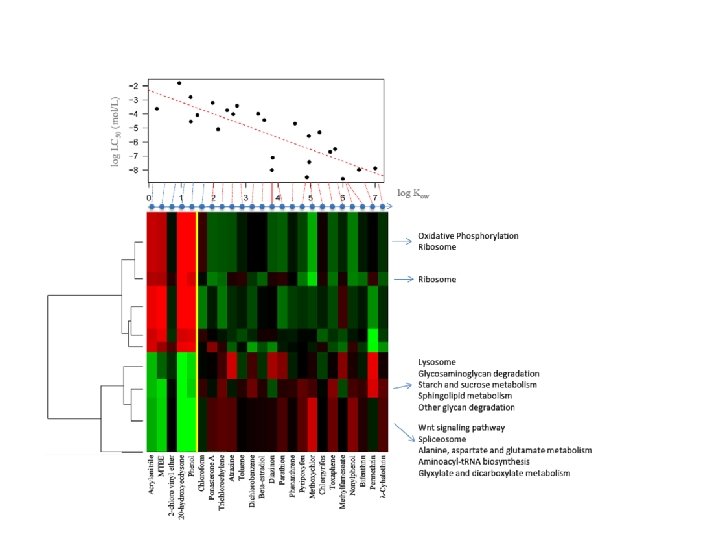
 = -0. 8438 log(Kow) – 2. 3078. (validated on hundreds of")


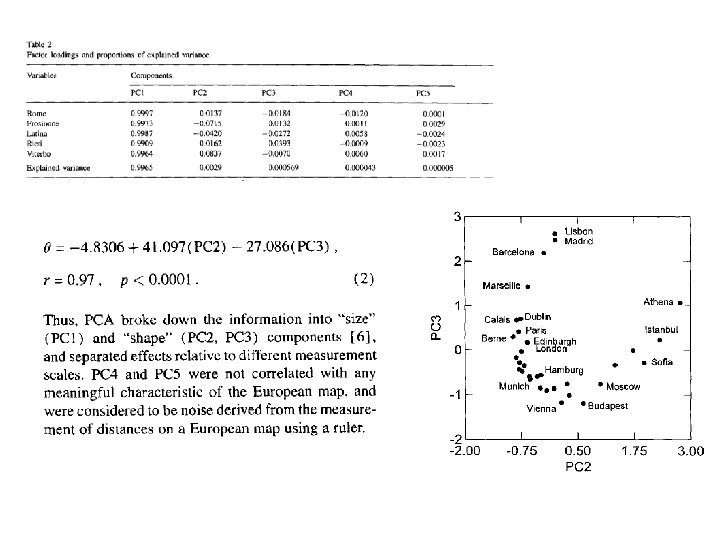
 is reconstructed by the polar plot on PC 2,")
- Slides: 73
Analisi di Correlazioni Alessandro Giuliani
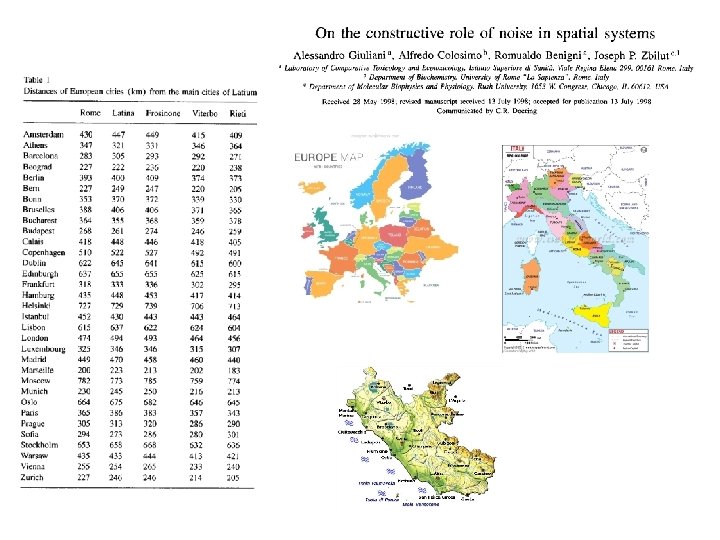
Del Rigore della Scienza. . . In quell'impero, l'Arte della Cartografia raggiunse una tale Perfezione che la mappa di una sola provincia occupava tutta una Città e la mappa dell'Impero tutta una Provincia. Col tempo codeste Mappe Smisurate non soddisfecero e i Collegi dei Cartografi eressero una mappa dell'Impero che uguagliava in grandezza l'Impero e coincideva puntualmente con esso. Meno Dedite allo studio della cartografia, le Generazioni Successive compresero che quella vasta Mappa era inutile e non senza Empietà la abbandonarono all'Inclemenze del Sole e degl'Inverni. Nei deserti dell'Ovest rimangono lacere rovine della mappa, abitate da Animali e Mendichi; in tutto il paese non è altra reliquia delle Discipline Geografiche. (Suarez Miranda, Viaggi di uomini prudenti, libro quarto, cap. XLV, Lérida, 1658) Da Jorge Luis Borges, L'artefice Ed. Mondadori i Meridiani vol. 1, pg. 1253
Going from univariate to bivariate a quantum-leap in our view of the data happens: order (in both space and time) matters. A 10 20 30 40 B 40 30 20 10 C 30 20 10 40 All the three vectors have identical statistical descriptors, but while A and B are negatively correlated A –C and B-C are each other independent
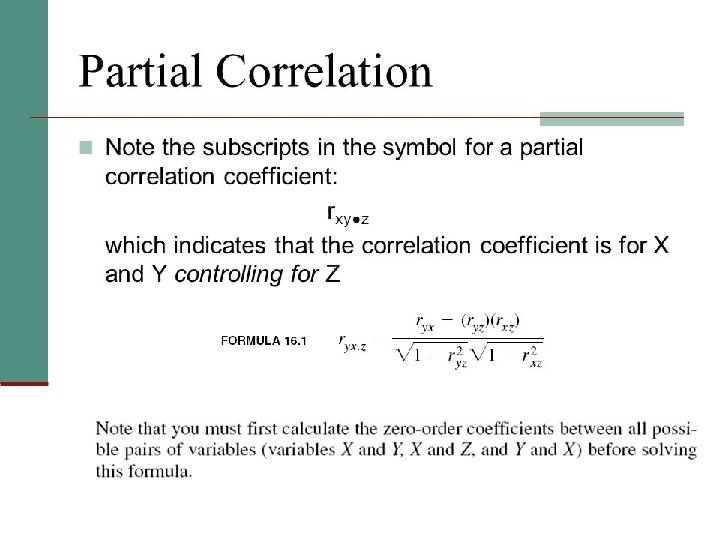
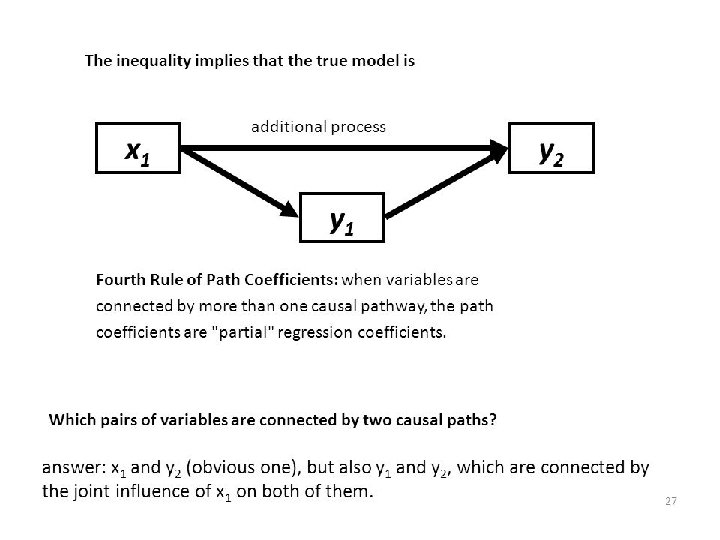
Detecting a correlation between two X and Y variables means that the knowledge of the value of X decreases the uncertainty about the corresponding value of Y. This is a necessary (but not sufficient) condition for a causal link between X and Y.
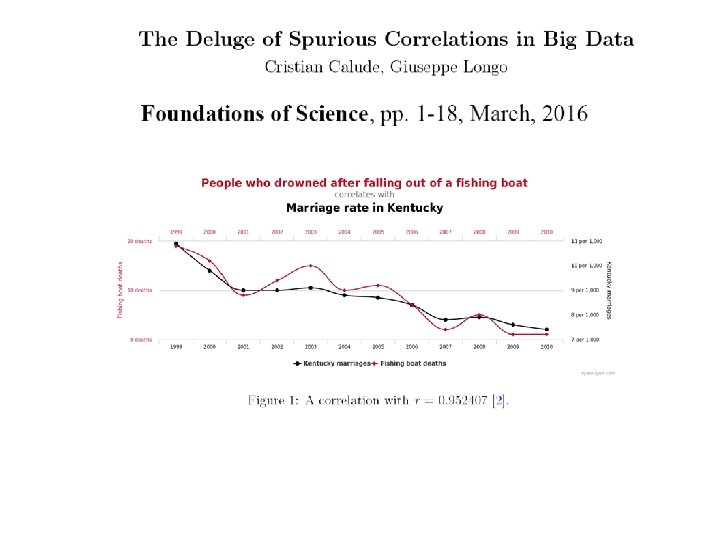
http: //www. tylervigen. com/spurious-correlations
Correlazioni spurie La correlazione (spuria) tra l’accorciamento delle gonne e congiuntura economica positiva è stata presa sul serio da molti sociologi Barber, N. (1999). Women's dress fashions as a function of reproductive strategy. Sex Roles, 40(5), 459 -471. Docherty, C. A. , & Hann, M. A. (1994). Stylistic Change in Womenswear Products Part II: The Relationship Between Hem Length and Various Economic Indicators. Journal of the Textile Institute, 85(2), 283 -287.
Detecting the optimal scale for the analysis is the most crucial problem in science.
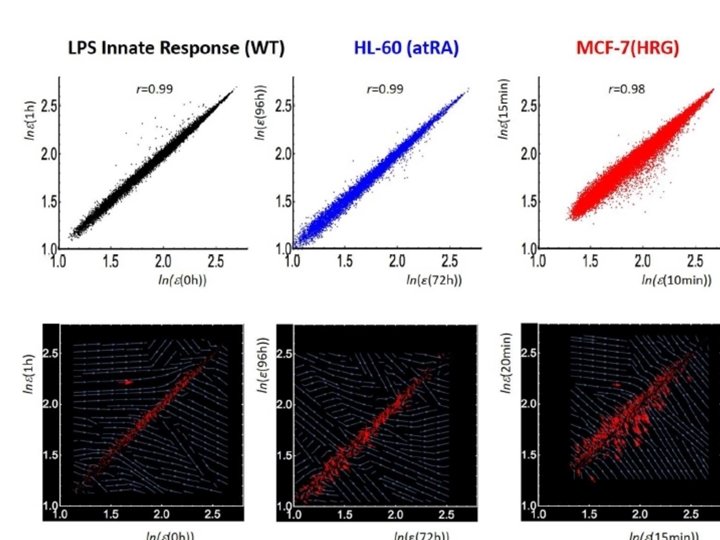
r. W = 0. 98 rd ln (15 min) A) 0. 96. tanh(6. 99 x-0. 053) P < 10 -5 (CM(10 min), CM(15 min)) d = Box size r 0. 2 = 0. 84 rd=0. 05 = 0. 29 r 0. 1 = 0. 57 Figure 1 ln( (10 min))
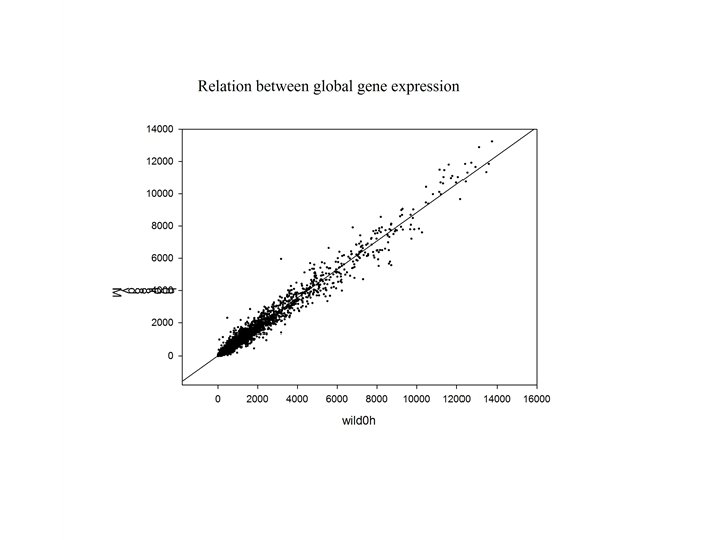
Ecology Cell Biology d = Box size The two graphs have corresponding axes. X axes: range of gene expression values (cell biology) range of sampled territory in a sample. (ecology) Y axes: mutual correlation between gene expression profiles (cell biology) mutual correlation between species distribution (ecology)
Il modello:
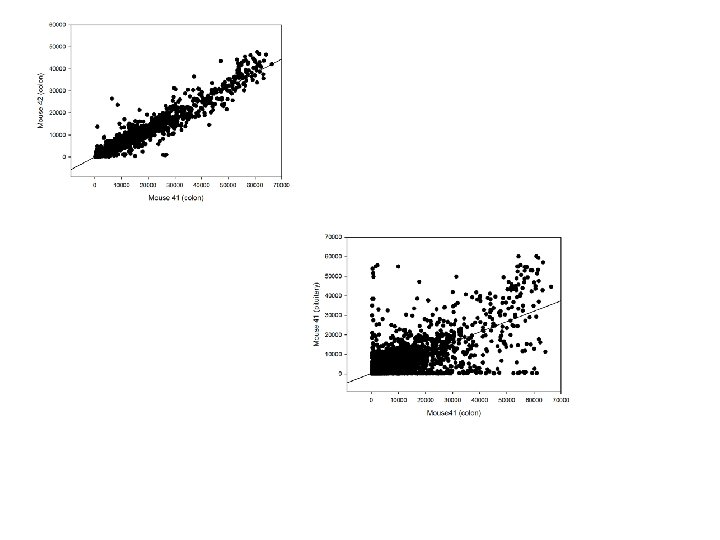
A single outlier can create a spurious correlation (and consequently a spurious linear model, by constraining the model to be a ‘two-points’ regression (for each two points a straight line can be exactly drawn)
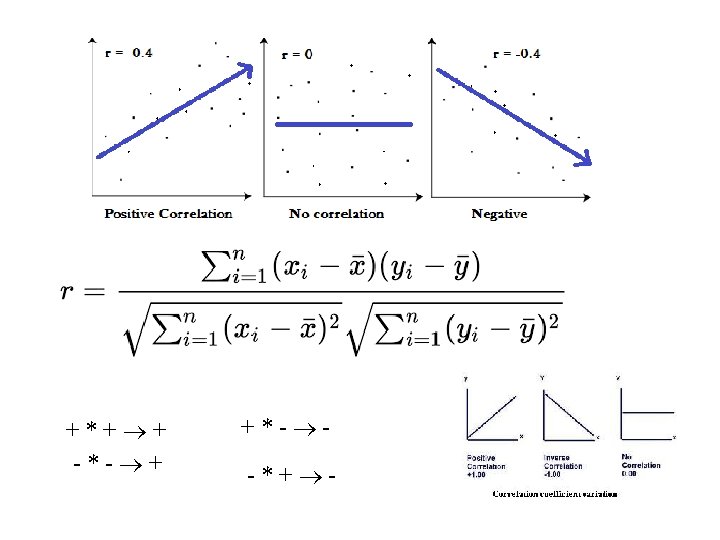
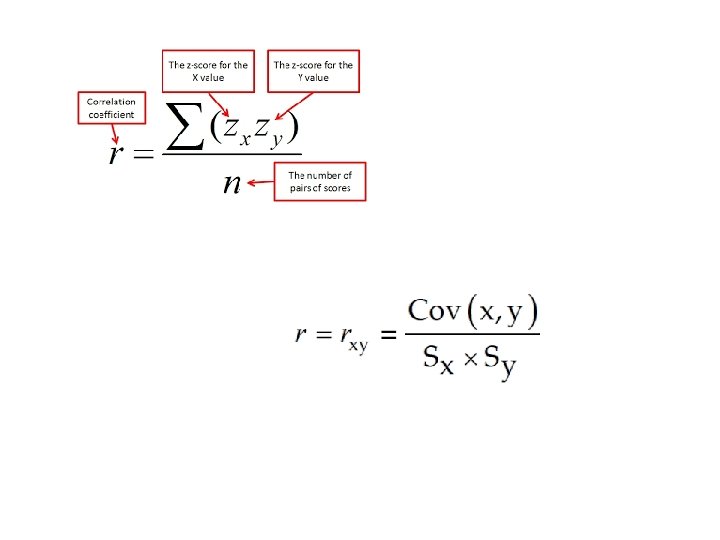
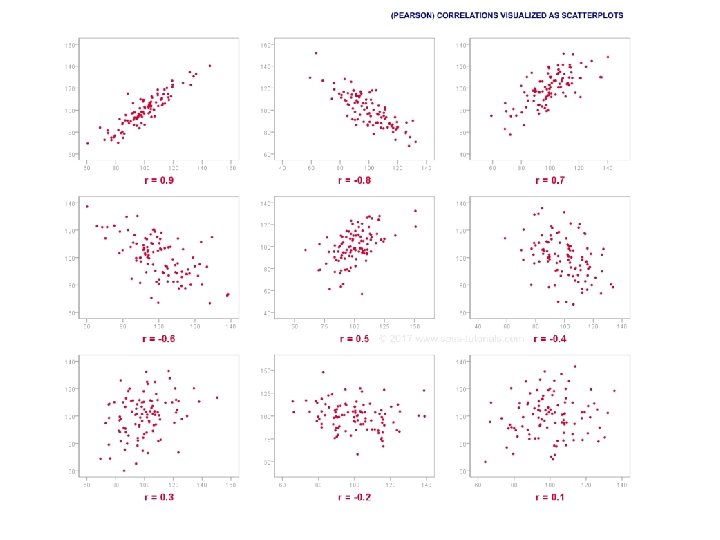
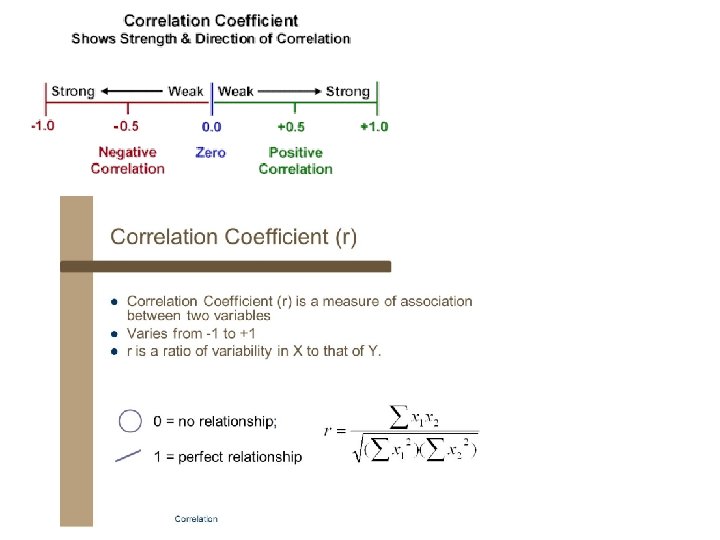
Pearson correlation coefficient is the basic metrics for approaching complexity
The passage Pearson – Spearman – Kendall – Chi-Square can be interpreted as a progrsssive relaxation of the linearity constraints of the correlation
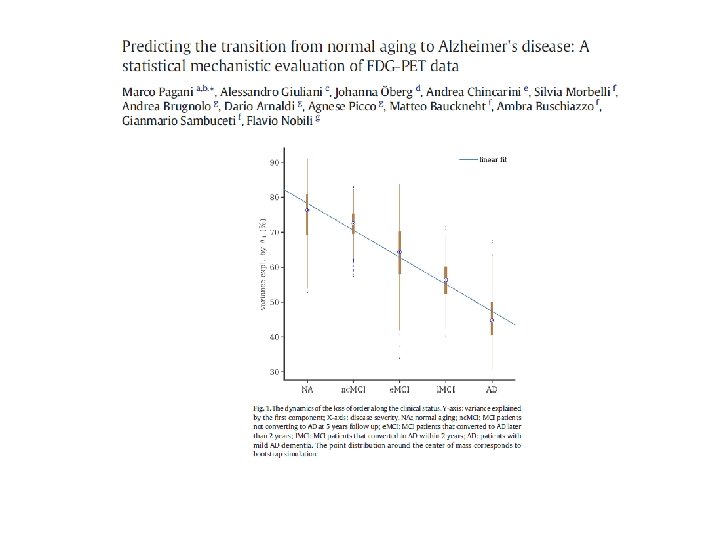
Brain has an incredibly complex connectivity structure that can be appreciated by many view points. One of this is metabolism: the metabolic rate (glucose consumption) is measured by PET at different brain areas (ROI = Regions Of Interest) and their average degree of correlation is estimated.
Correlation beyond Pearson…. . 1. Spearman rank correlation coefficient n= number of paired ranks d= difference between the paired ranks (when two or more observations of one variable are the same, ranks are assigned by averaging positions occupied in their rank order)
Correlation beyond Pearson… 2. Kendall’s Tau •
Correlation beyond Pearson… 3. Chi-Square A B ********** * ****************** * * * Non B Non A ******************
To regress one dependent variable (Y) on and indpendent one (X) generates a model Y = a + b. X where a and b parameters derive by the minimization of the squared distance (r (i) or residuals) of the observed points by the model (least squares optimization)
Solutions for a and b parameters when imposing: S (r(i))2 = minimum La soluzione ai minimi quadrati, quella cioè che rende minima la distanza quadratica dei valori osservati dalla loro stima è riportata di seguito (n = numero di casi), notare la ‘somiglianza’ della formula di b (slope) con quella del coefficiente di correlazione
. . riscrivendo la formula: http: //it. wikipedia. org/wiki/Regressione_lineare
Quando invece di una sola variabile indipendente ne ho molte, ognuna che apporta un suo contributo alla spiegazione della varianza di Y (variabile dipendente), il modello visto in precedenza rimane sostanzialmente immutato:
Supervised Learning
La regressione logistica è un caso particolare di modello lineare avente una particolare trasformata come variabile dipendente detta logit. Si tratta di un modello di regressione applicato nei casi in cui la variabile dipendente sia di tipo dicotomico. Il modello si indica come: logit (p) = a 0 + a 1 x 1 + a 2 x 2 + a 3 x 3… Essendo logit(p) =ln (p/(1 -p)) e, conseguentemente p = exp(a 0 + a 1 x 1 + a 2 x 2 + a 3 x 3. . )/1 + exp(a 0 + a 1 x 1 + a 2 x 2 +a 3 x 3. . )
Non c’è alcun motivo per non usare direttamente, la variabile dicotomica (y) tal quale (Y prende due valori 1, 0 per presente e assente), in tal caso avremmo l’usuale regressione lineare: y = a 0 + a 1 x 1 + a 2 x 2 + a 3 x 3… Solo che così avremmo delle stime di y nello spazio dei reali e non in quello di probabilità (che va da 0 a 1) che in molti casi è ciò che ci occorre ……
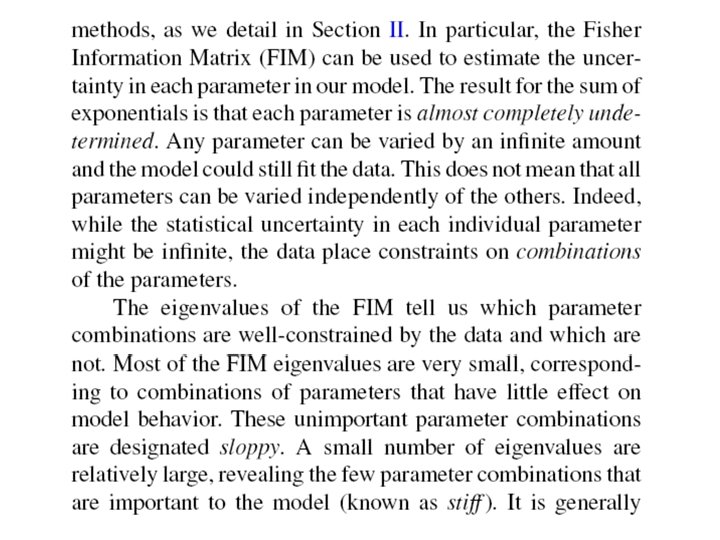
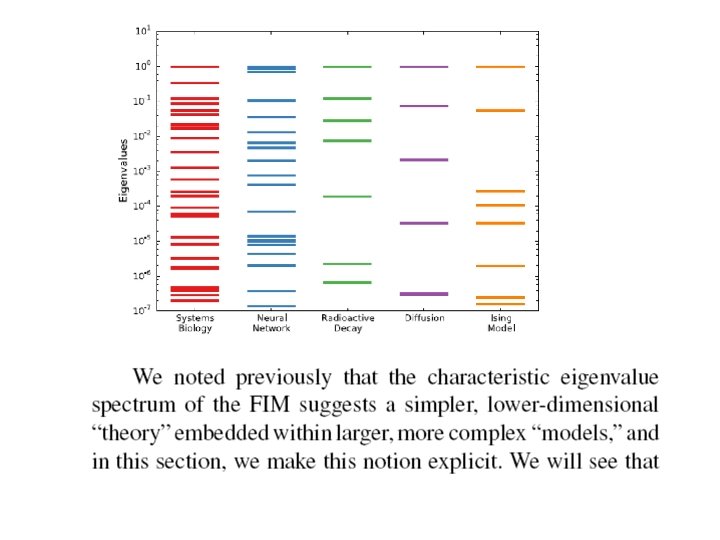
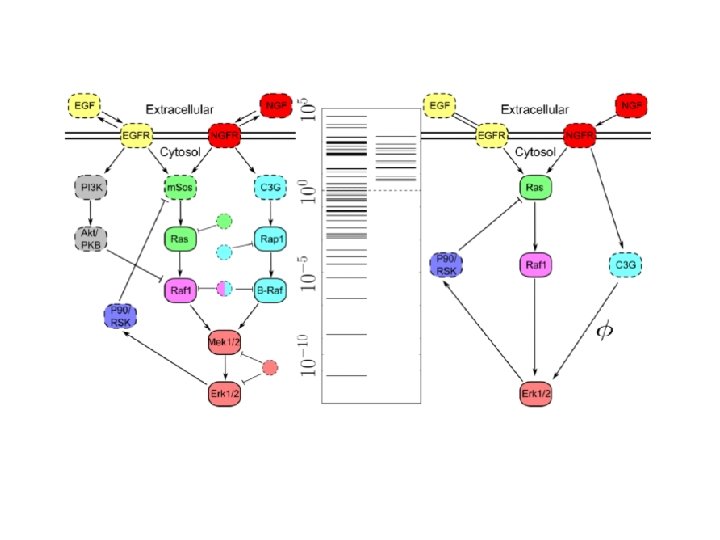
FIM: Fisher Information Matrix To what extent the knowledge of variable X decrease the uncertainty about Y
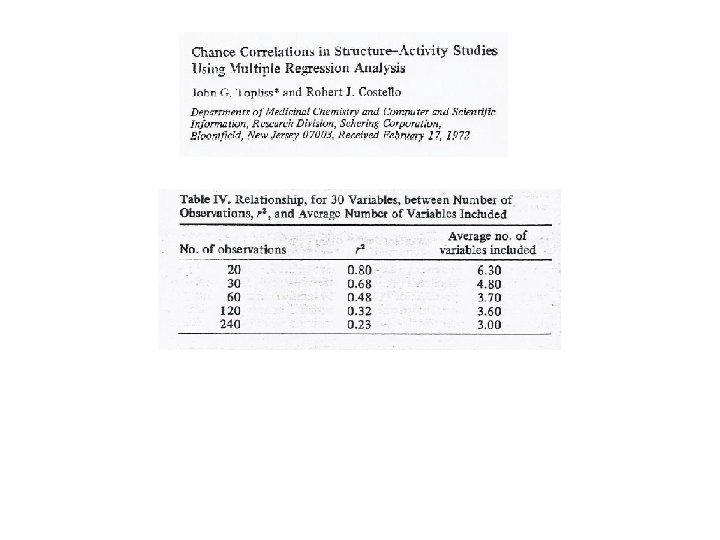
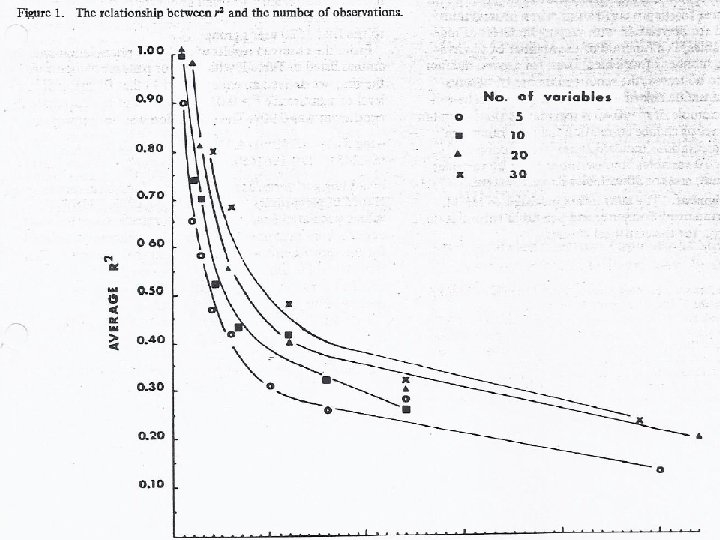
Overfitting refers to a model that fits the training data too well. Overfitting happens when a model learns the detail and noise in the training data to the extent that it negatively impacts the performance of the model on new data.
log(LC 50) = -0. 8438 log(Kow) – 2. 3078. (validated on hundreds of molecules) can be applied to 24 molecules
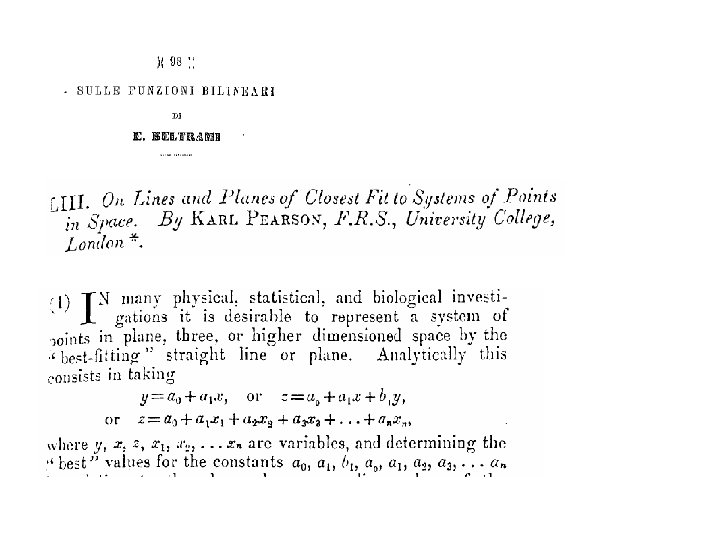
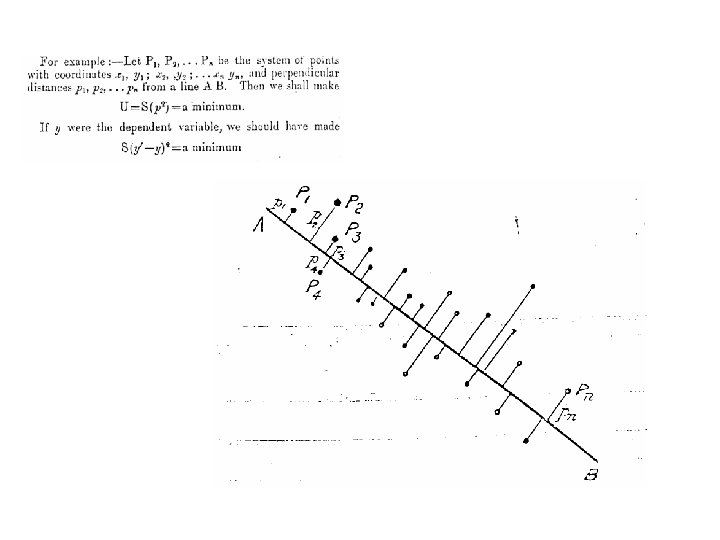
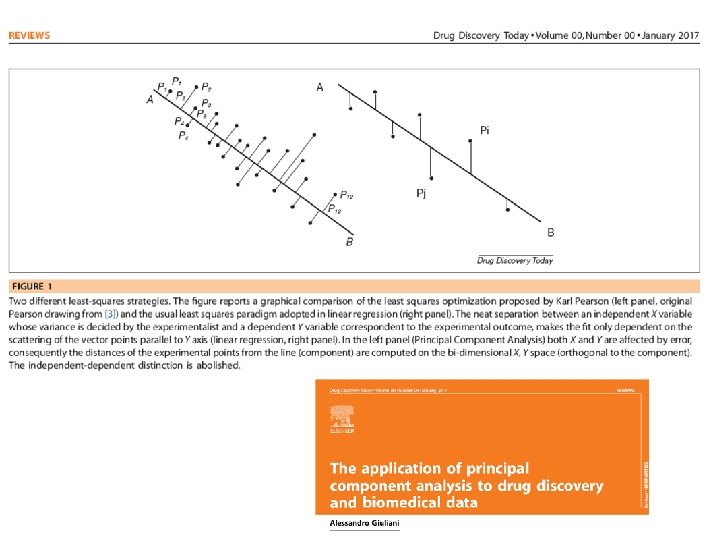
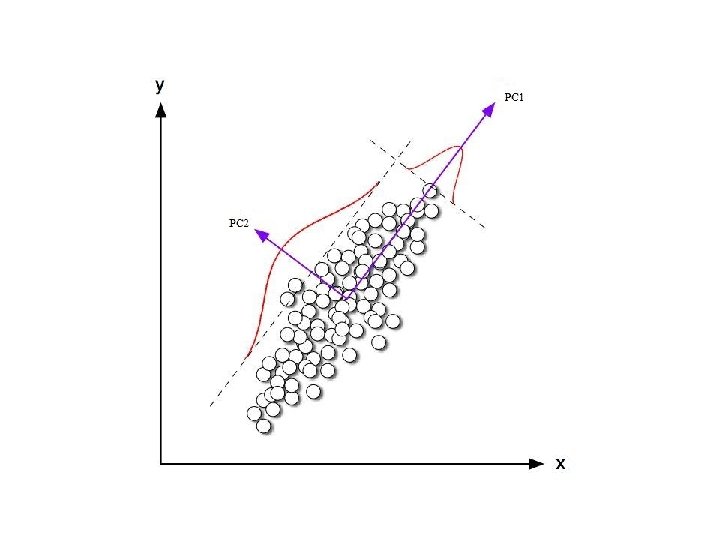
Algebraic Interpretation • Formally, minimizing the sum of squares of distances to the line…
Algebraic Interpretation • … is the same as maximizing the sum of squares of the projections on that line, thanks to Pythagoras.
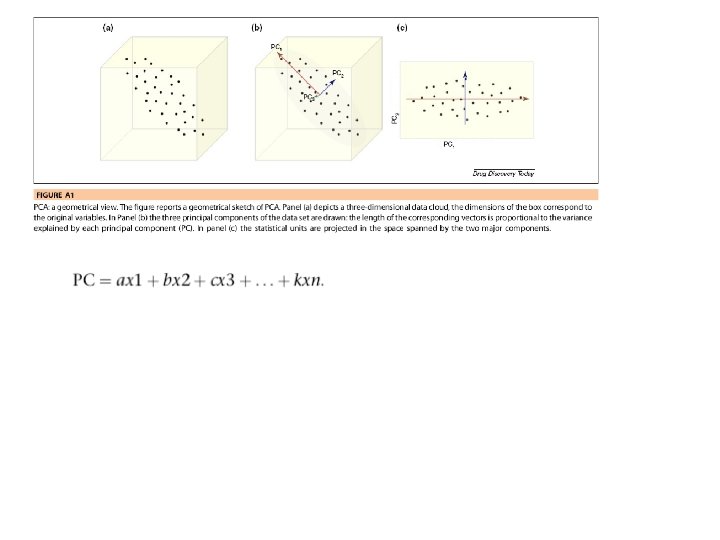
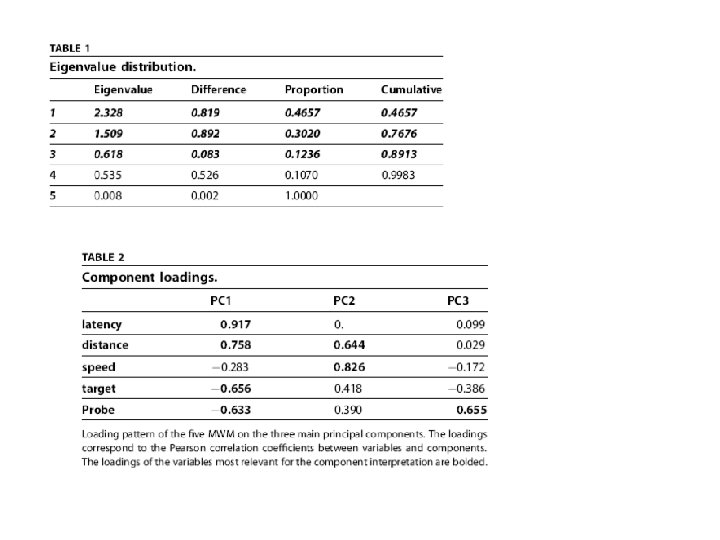
PCA Eigenvalues λ 1 λ 2
Morris Water Maze
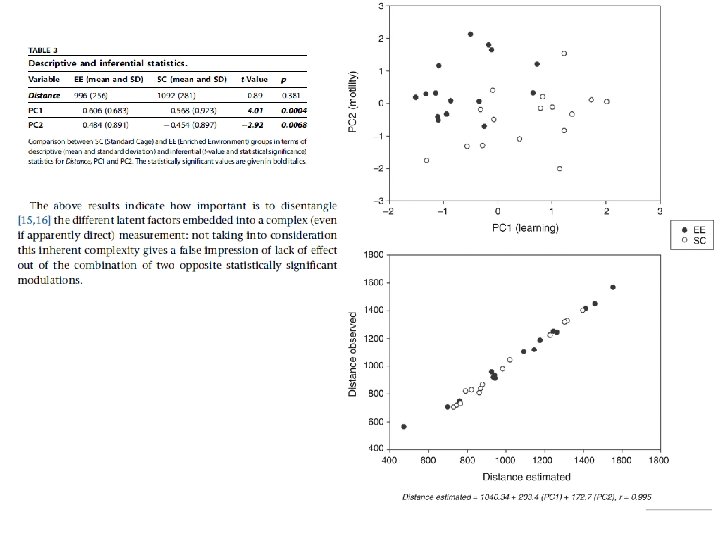
Europe (as seen from Latium) is reconstructed by the polar plot on PC 2, PC 3 (minor) components