Statistics for Experimenters Tom Horgan No part of


![Assumptions, Data Integrity and Experimental Design ] When analysis is confusing or experiments are Assumptions, Data Integrity and Experimental Design ] When analysis is confusing or experiments are](https://slidetodoc.com/presentation_image_h/b084286a8a1b007bfb04585412a804bc/image-9.jpg)


- Slides: 43

Statistics for Experimenters Tom Horgan No part of this publication may be reproduced, stored in a retrieval system, or transmitted in any form or by any means – electronic, mechanical, photocopying, recording or otherwise – without the permission of Plug Power Inc. COMPANY CONFIDENTIAL Copyright 2003 by Plug Power Inc.

Statistics for Experimenters Goals: At the end of the course you should be able to. . . v Understand the real purpose of statistical analysis v Appreciate the importance of data & experiment integrity in an analysis v Recognize what types of analyses are appropriate for a particular situation v Recognize and interpret basic statistical parameters v Recognize and avoid common decision traps v Use statistics to support data-based decisions

Statistics for Experimenters Outline v The Statistical Analysis Paradigm v Assumptions, Data Integrity and Experimental Design v Data Types and Effects v Gage R&R v Errors, replication and sample size v Decision Traps v Hypothesis Testing & probability distributions v Statistical Situations with Examples

The Statistical Analysis Paradigm Why do we experiment?

The Statistical Analysis Paradigm Probability and Statistics are used to draw inferences about populations

The Statistical Analysis Paradigm v Probability and Statistics are used to draw inferences about populations Ø These inferences are made by creating hypotheses, sampling the population(s) and calculating the necessary statistics Ø The inferences may be about a single population, comparisons between two populations, or relationships between multiple populations Ø A statistical inference is always qualified with a probability that expresses the degree of confidence we have in it Ø The probabilities are based on theoretical behavior of the error inherent in the population variable (probability distribution) Ø Increasing the sample size improves the quality of the inference by decreasing the error of the estimates

The Statistical Analysis Paradigm v Population: A collection, real or theoretical, of all individual objects of a particular type. • The collection of all stacks run at 5 degrees subsaturatation • The collection of all plates made from a prototype mold, which was subsequently destroyed • The collection of all SU 1 systems manufactured by Plug Power v When reviewing data or analyses, try to define the population that is being evaluated

Assumptions, Data Integrity and Experimental Design: The Fundamental Statistical Assumption We have drawn unbiased, random samples.
![Assumptions Data Integrity and Experimental Design When analysis is confusing or experiments are Assumptions, Data Integrity and Experimental Design ] When analysis is confusing or experiments are](https://slidetodoc.com/presentation_image_h/b084286a8a1b007bfb04585412a804bc/image-9.jpg)
Assumptions, Data Integrity and Experimental Design ] When analysis is confusing or experiments are inconclusive, most often it is because this assumption is violated ] How is it violated? Many ways. . . ]‘Untreated’ Noises, Gage Issues, Confounded Variables, Uncalibrated gages, Poorly tagged data, etc. ] Examples of Bias (Sampling and Measurement): ]“That gage can’t read past to 250 so I just wrote down the max” ]“I don’t think the gage is accurate at low readings” ]“Some time during the run Joe turned up the gas temp” ]“MEA 1 was tested on station 3 and MEA 2 was tested on station 6” ]“Most were made with lot 1 but a few were made with lot 2, I think”

Assumptions, Data Integrity and Experimental Design v Experiment Design Integrity: • Have we unwittingly confounded variables? • Have we randomized the runs and blocked out any nuisance factors? • Have we spaced the levels sufficiently to detect the effects we’re interested in? • Do we suspect that some factors interact and will I be able to detect it with my experiment? • If we are model building, have I chosen an experiment that will minimize error and will allow me to predict with equal accuracy in all directions (orthogonal/rotatable)?

Assumptions, Data Integrity and Experimental Design v Experiment Design Integrity: Orthogonality • Orthogonal Array for a Screening Experiment (2 k) 45. 8 60. 0 28. 4 74. 2 -4. 9 55. 1 51. 1 8. 0 59. 1 Factorial and Fractioned Factorial Screening Experiments Are Orthogonal up to Two-way Interactions or Specified Combinations of Them

Assumptions, Data Integrity and Experimental Design • Orthogonality in Taguchi Orthogonal Arrays Design Number 4: L 8, 7 factors (2 -7) Effect of B when A = 1: Is it B or is it C? Taguchi Orthogonal Arrays in General are not Orthogonal for Two-Way Interactions

Assumptions, Data Integrity and Experimental Design Interactions • If interactions exist between the factors of an orthogonal array interpretation of the results can be misleading and the results may not confirm. • The factors should be examined before the RD experiment and judgments should be made as to which pairs are likely to interact (this often requires extra testing). • The interactions should be characterized so that appropriate level combinations can be selected Acid Uptake 75 1 2 Time 50 3 hr 25 C

Data Types and Effects v Variables Data: • Normal Random Variables: Variables whose population is normally, or approximately normally distributed. – Most variables can safely be assumed to be normally distributed (population) – Cell Voltage, Temperature, Pressure, Thickness, Tensile Strength, etc. • Time-To-Failure: These data are not normally distributed and require different analysis methods. v Attributes Data: • Binomial Random Variables: This is Pass/Fail data. Frequently expressed in terms of ‘percent acceptable‘. • Categorical Data: Data which has a discreet number of responses. For example survey data.

Error, Replication and Sample Size v Replication: • No matter how expensive or difficult, we need replicates to determine confidence levels in the inferences we want to make • Time-series points are not replicates • Better none than one • With some historical estimate, in a pinch replicates can be simulated • Good news: increasing replicates tends to mitigate the effects of violating the assumptions (Central Limit Theorem).

Error, Replication and Sample Size v Sample Size Determination: • In analyzing an experiment, there are two possibilities: – The effects are small but statistically significant (too many samples) – The effects are large but statistically not significant (not enough samples) • With a rough estimate of the population standard deviation and some idea of size of the effect you are interested in, you can estimate the sample size required to detect that effect with some probability • Moral: Spend some time thinking about how large of an effect you are interested in detecting before running the experiment, and estimate an appropriate sample size

Error, Replication and Sample Size v Sample Size Determination: • Variables data requires far less samples for significance than attributes data. Example: – I’m testing a new membrane and I will start life testing if there is an increase of at least 15 mv at 0. 6 A/cm 2 over the specification. Historically, standard deviation is around 0. 08 mv. How many samples at (95% ‘Confidence’)? 6 Samples – My my meter isn't working and all I have is a light that goes on if the reading is more than 15 mv over the spec. How many stacks would I have to test to be 95% sure that I’ll exceed the specification 90% of the time (no defects)? 58 Samples

Error, Replication and Sample Size v Going forward we are talking about the random error. We cannot quantify error associated with violation of the assumption. v Type I Error: • • The probability you are wrong if you claim the effect is real. Aka: P-Value, P, Significance level, consumers risk, alpha 1 - P-Value = Confidence You find this somewhere in most statistical analyses. First thing to look for. ðTwo ways to present Type I Error: – Calculate the effect and present the probability – Fix the probability and calculate the range within which the population value will fall with that probability (confidence interval)

Error, Replication and Sample Size v Type II Error: • • The probability you are wrong if you claim the effect is not real Aka: Beta, producers risk 1 - Beta = Power Used as the basis for sample size determination. Not usually listed unless specifically requested. v Alpha error is considered the more serious of the two because it is more likely to lead to a bad decision. Beta errors generally lead to no decision. v Increasing sample sizes reduces both errors (or increases confidence and power)

Gage Repeatibility and Reproducibility v Why? • How else can you know if the effects you observe are real? v What? • It’s the error of the estimate. All observed effects must be larger than that error to be considered significant • Repeatability: The error associated with repeat measurements of the same object(s), with the same device and operator. • Reproducibility: The error associated with measurements taken across multiple devices and operators. v What do I get out of it? • The ability to estimate the sample size required to detect effects of the desired size

Decision Traps v Interpreting inferential statistical analyses is often not intuitive and there are several ‘traps’ that lead to poor decisions. A few are listed here* - Probabilistic Certainty: Are you certain that you are 95% confident? - "Bush leads Gore in Ohio, 57% to 43%. The margin of error in this poll is +/- 3%. ” - Statistical Significance is not causal significance. Storks and Sun spots - Small Sample Bias: People assume that small samples should exhibit average behavior and assume something is wrong when they don’t. - Linear Thinking: People do not conceptualize non-linearities and interactions well and tend to ignore them. *Study by Miller, Tversky, Kahnmen - From Decision Sciences, Kliendorfer, Kunreuther, Schoemaker, Cambridge University Press, 1993

Decision Traps v More traps. . . - Cue Learning: People have difficulty learning new relationships when previous knowledge exists. - Perceptual Limitations: People can manage on average 7 +/- 2 discreet bits of information simultaneously. - Noise: Peoples ability to evaluate data deteriorates as noise is introduced. - Ignoring base rates: Try to answer this quickly. . . About 1% of the population of a small city (100, 000) has AIDS. There is a new test that detects AIDS with about 5% false negatives and 10% false positives. Suppose a randomly selected person tests positive for AIDS. What is the probability that he actually has it? *Study by Miller, Tversky, Kahnmen - From Decision Sciences, Kliendorfer, Kunreuther, Schoemaker, Cambridge University Press, 1993

Decision Traps v Just a few more. . . • Overweighing Concrete Data: People give more weight to speculative concrete data and less weight to accurate statistical data • Familiarity Availability: Recency tendency • Misconceptions of Chance: – Statistical Runs - “Had four heads in a row, a tail is due. ” – Sample Size Insensitivity - small sample bias; large samples which deviate, hold more weight than small ones – Regression Towards the Mean - An unusual result is more likely to be followed by a result closer to the mean; Sophomore Jinx – Combinatorial Bias: In a group of 50 people, what is the probability that at least two will have the same birthday? *Study by Miller, Tversky, Kahnmen - From Decision Sciences, Kliendorfer, Kunreuther, Schoemaker, Cambridge University Press, 1993

Statistics for Experimenters v Day 1 Summary äConsider the Statistical Analysis Paradigm when evaluating data ä Drawing Inferences about populations äDon’t violate the assumptions - Bad data is worse than no data äData/Experiment Integrity (orthogonality) is by far the most important factor in assuring successful experiments äReplicate: Larger Samples = Higher Confidence, ä 1 Sample = No Confidence äCalculate the sample size ahead of time äType I Error: Probability I’m wrong if I say it’s real - Look for it ä P-Value, P, Significance, alpha, consumers risk: 1 - P-Value = Confidence äDecision Traps: Easy to get it wrong

Hypothesis Testing: v Nomenclature: • Averages: – Population: Sample: • Standard Deviations: – Population: Sample: S 2 Sample: S 2 Sample: b • Variances: – Population: • Regression Coefficients: – Population:

Hypothesis Testing: v We set up hypotheses to answer the question, “Is the effect statistically significant? ” …or… “Is the effect I observe real or is it just noise? ” v Though it may not be obvious, all statistics can be described in terms of a test of some hypothesis. v By convention the hypothesis is always “The effect is not statistically significant. ” This is called the ‘null’ hypothesis and the statistical test is set up to reject it. v The alternative hypothesis may be different depending on the purpose of the test. v What effect have we made the hypothesis about?

Setting Up and Testing a Hypothesis v Example 1: Comparing Two Population Means - “Is there a significant difference between the two means? ” • The MEA manufacturing process has been changed and five stacks were tested both before and after the change. Is the mean-cell-voltage affected? • Null Hypothesis: • Alternative Hypotheses:

Setting Up and Testing a Hypothesis v Example 2: Evaluating an Experiment - “Are there significant effects? ” • A gage repeatability and reproducibility study was conducted where three operators tested three identical stacks on each of three different test stations (27 total tests). Were there any significant effects? • Null Hypotheses: • Alternative Hypotheses:

Setting Up and Testing a Hypothesis v Example 3: Evaluating a Regression Analysis - “Is there a significant degradation rate? ” • A module was tested on a test station for two months? Is there a significant degradation rate? • Null Hypotheses: • Alternative Hypotheses:

Setting Up and Testing a Hypothesis v Example 3: Evaluating a Multiple Regression Analysis - “Is there a significant relationship between the factors and the response? ” • A response surface experiment was conducted to model the relationship between O 2 Ch 4 ratio, H 2 Stoichs and ATO Temp and Reformer Efficiency resulting in the following model. Is there a significant relationship? • Null Hypotheses: • Alternative Hypotheses:

Probability Distributions v Probability distributions are functions that describe the random behavior of variables. v Both random variables (raw data) and resultant statistics (means, variances, etc) have probability distributions. v Most variables behave according to the normal distribution but not all. v The expected value (mean) of all probability distributions are normally distributed - The central limit theorem.

Probability Distributions v Probability Distributions have key parameters that define them. If we know what distribution we are dealing with, we can get estimates of the key parameters, define the distribution and use it to draw inferences about population behavior. v We do this by setting the total area under the distribution curve equal to 1 and calculating the portion of the area associated with whatever inference we are trying to make. v The portion of the area is the probability associated with the inference.

Probability Distributions v Normal Distribution estimates. Same data, different sample sizes:

Probability Distributions v Normal Distribution estimates. ‘Normalized’ Curves:

Probability Distributions v Comparing two populations (Means and 95% Confidence Intervals):

Probability Distributions v Probability Distribution Functions Normal: F: T: Weibull:

Excel Examples v Example 1, Situation 1: Comparing Two Population Means • Example: You have tested stacks from two different manufacturing processes and you want to know if the process differences effect performance. • Method: Calculate the two sample means and take the difference. Test the hypothesis that the difference is zero. • Analyses Techniques: – (1) Use a t-test for sample sizes less than 30. Use a z-test (normal distribution) for sample sizes greater than 30. – (2) Calculate the 95% confidence interval of each mean and plot to compare the differences.

Excel Examples v Example 1, Situation 2: Comparing Two Population Standard Deviations • Example: For the same process change you want to know if stack-tostack variability is effected. • Method: Calculate the variance of each group and take the ratio of the two. Test the hypothesis that the ratio is equal to 1. – Memory Jogger: Variance = (Standard Deviation)2 • Analyses Techniques: – Use the F-test, (confidence intervals)

Statistical Situations v Example 3: Comparing Multiple Population Means - “Is there a significant difference between the means? ” • Does kilowatt level affect the amount of CH 4 (%) remaining in the gas stream after the ATR catalyst? • Method: We compare the variability between the experimental group means to the variability within the groups (the error). We are testing the hypothesis that all of the effects are zero. • Analyses: Analysis of variance (ANOVA), f-test, confidence intervals, (residuals) • Conclusions/Comments:

Statistical Situations v Example 4: Evaluating a Regression Analysis - “Is there a significant linear relationship between the variables? ” • Does kilowatt level affect the amount of CH 4 (%) remaining in the gas stream after the ATR catalyst? • Method: We evaluate the slope of the line. We are testing the hypothesis that the slope is zero. • Analyses: Analysis of variance (ANOVA), f-test, confidence intervals, (residuals) • Conclusions/Comments:

Statistical Situations v Example 5: Evaluating a Screening Experiment - “Are the effects significant? ” • What are the effects of changes in Anode Stoichs, Cathode Stoichs and Anode Tin on Mean Cell Voltage in this experiment? • Method: We use ANOVA to evaluate the significance of the effects and test the hypothesis that all of the factor effects are zero. • Analyses: Analysis of variance (ANOVA), f-test, effect plots, (residuals) • Conclusions/Comments:

Statistical Situations v Example 6: Evaluating a Multiple Regression Analysis - “What is the relationship between these factors and that response? ” • What is the relationship between O 2/CH 4 , H 2 Stoichs and ATO Temp on reformer hydrogen utilization? • Method: We do a least-squares fit of the factors to the response data to come up with coefficients to use in a function. We use t-tests to test the hypotheses that individual coefficients are equal to zero. We use ANOVA to test the hypothesis that all of the coefficients are equal to zero. • Analyses: ANOVA, f-test, t-tests, response plots, (residuals analysis) • Conclusions/Comments:

Statistical Decision Support v Summary äConsider the Statistical Analysis Paradigm when evaluating data ä Drawing Inferences about populations äDon’t violate the assumptions - Bad data is worse than no data äData/Experiment Integrity is by far the most important factor in assuring successful experiments äReplicate: Larger Samples = Higher Confidence, ä 1 Sample = No Confidence äCalculate the sample size ahead of time äType I Error: Probability I’m wrong if I say it’s real - Look for it ä P-Value, P, Significance, alpha, consumers risk: 1 - P-Value = Confidence äDecision Traps: Easy to get it wrong
 Ron horgan
 Engineers as responsible experimenters
 Tomtom go 910 update
 What does tom symbolize in the devil and tom walker
 Introduction to statistics what is statistics
 Business statistics i com part 2 chapter 3
 Rita perspektiv
 Orubbliga rättigheter
 Ministerstyre för och nackdelar
 Tillitsbaserad ledning
 Plats för toran ark
 Tack för att ni lyssnade bild
 Bästa kameran för astrofoto
 Dikt med fri form
 Nyckelkompetenser för livslångt lärande
 Ro i rom pax
 Datumr
 Stål för stötfångarsystem
 Jätte råtta
 Personalliggare bygg undantag
 Verktyg för automatisering av utbetalningar
 Texter för hinduer tantra
 Lyckans minut erik lindorm analys
 Skivepiteldysplasi
 Boverket ka
 Strategi för svensk viltförvaltning
 Informationskartläggning
 Tack för att ni har lyssnat
 Cks
Cks Läkarutlåtande för livränta
 Treserva lathund
 Returpilarna
 Inköpsprocessen steg för steg
 Påbyggnader för flakfordon
 Tack för att ni lyssnade
 Egg för emanuel
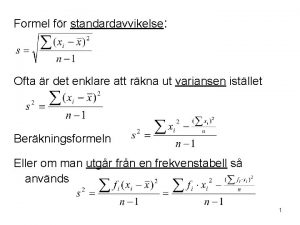
 Standardavvikelse
 Tack för att ni har lyssnat
 Vilotidsbok
 Rutin för avvikelsehantering
 Var finns arvsanlagen
 Presentera för publik crossboss
 Iso 22301 utbildning
 Myndigheten för delaktighet


