Satish Pradhan Dnyanasadhana College Thane Department of Chemistry




- Slides: 135
Satish Pradhan Dnyanasadhana College, Thane. Department of Chemistry M. Sc. Analytical Chemistry Sem-I Language of Analytical Chemistry by Dr. G. R. Bhagure 1
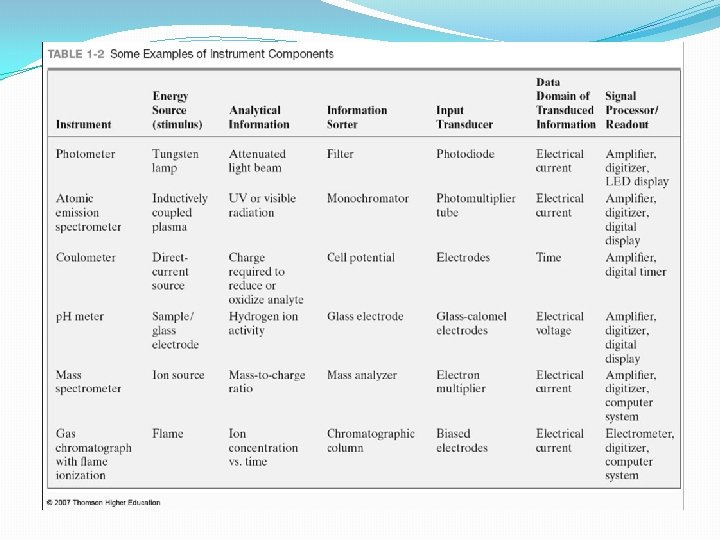
Language of Analytical Chemistry (8 L) • 1. 1. 1 Analytical Perspective, Common analytical Problems, terms involved in Analytical Chemistry(analysis, determination, measurement, techniques, methods, procedures and protocol) • 1. 1. 2 An overview of analytical methods, types of instrumental methods, instruments for analysis, data domains, electrical and non electrical domains, detectors, transducers and sensors, selection of an analytical method, accuracy, precision, selectivity, sensitivity, detection limit and dynamic range
• 1. 1. 3 Errors, determinate errors, and Indeterminate errors, types of determinte errors, takaling of errors. • 1. 1. 4 Quntitive methods of analysis: calibration curve, standard addition and internal standard methods
• 1. 2 Quality in Analytical Chemistry (7 L) • 1. 2. 1 Quality Management Systems (QMS) • Evolution and significance of Quality Management Systems , • Types of quality standards for Laboratories, • Total quality management(TQM) • Philosophy implementation of TQM(Reference of Kaizen, six sigma approch & 5 S) • Quality Audits &reviews, • Responsibility of Laboratory staff for quality and problems
1. 2. 2 • Safety in Laboratories • Basic concepts of safety in Laboratories, Personal Protection equipment (PPE) OSHA , • Toxic Hazard(TH) classifications, Hazardous Chemical Processes including (processs calorimetry/thermal build up concepts)
1. 2. 3 Accreditations • Accreditation of Laboratories, Introduction to ISO series, Indian Government Standard • (ISI, Hallmark, Agmark) • 1. 2. 4 Good Laboratory Practices (GLP) • Principle, Objective, OECD Guidelines, • The USFDA 21 CFR 58, Klimisch score
Definition of Analytical Chemistry is branch of chemistry which deals with the study of theory and practice of methods used to determine composition of matter.
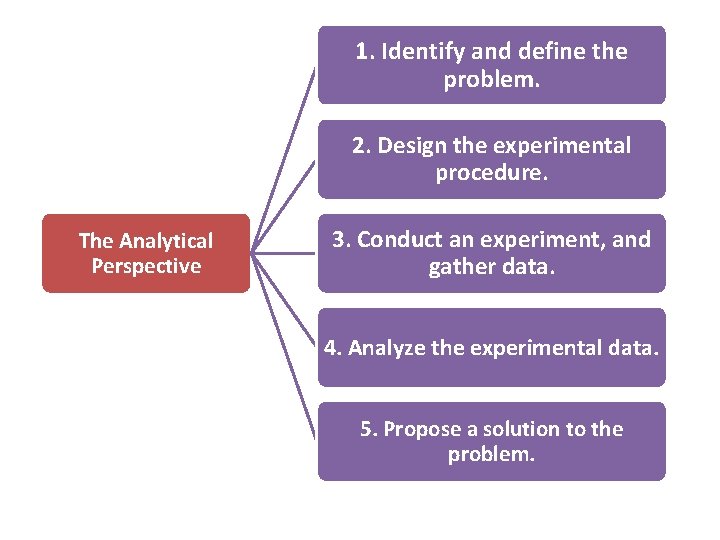
The Analytical Perspective What is the “analytical perspective”? Many analytical chemists describe this perspective as an analytical approach to solving problems. Although there are probably as many descriptions of the analytical approach as there analytical chemists, it is convenient for our purposes to treat it as a five-step process:
1. Identify and define the problem. 2. Design the experimental procedure. The Analytical Perspective 3. Conduct an experiment, and gather data. 4. Analyze the experimental data. 5. Propose a solution to the problem.
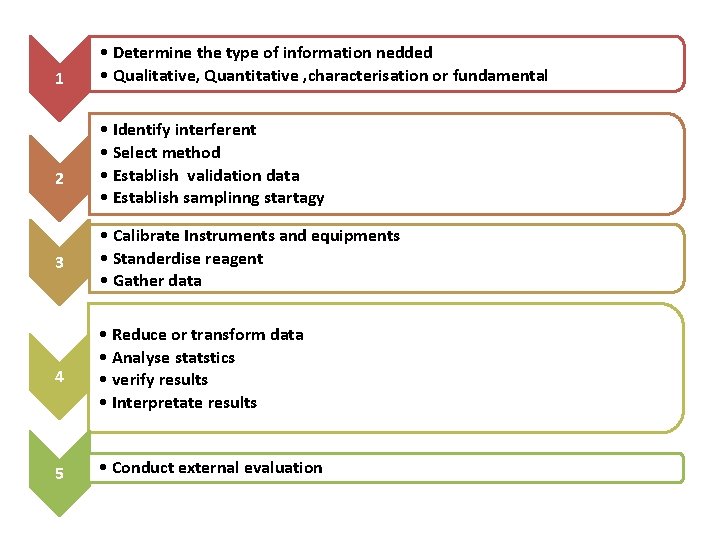
1 2 • Determine the type of information nedded • Qualitative, Quantitative , characterisation or fundamental • Identify interferent • Select method • Establish validation data • Establish samplinng startagy 3 • Calibrate Instruments and equipments • Standerdise reagent • Gather data 4 • Reduce or transform data • Analyse statstics • verify results • Interpretate results 5 • Conduct external evaluation
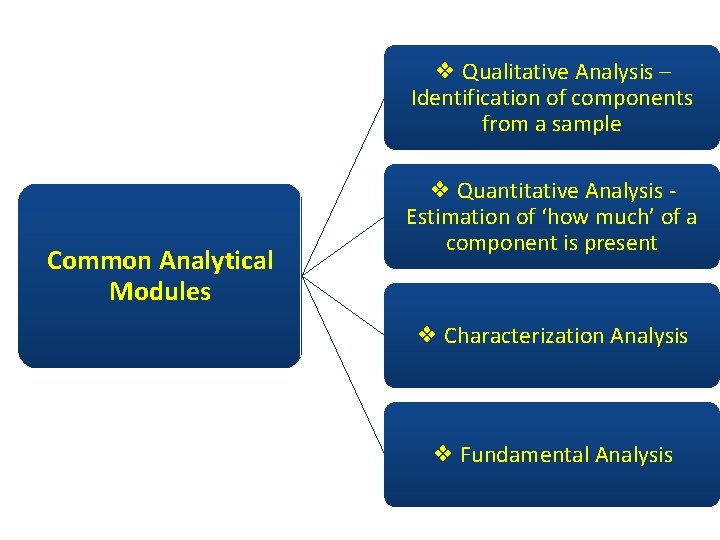
❖ Qualitative Analysis – Identification of components from a sample Common Analytical Modules ❖ Quantitative Analysis - Estimation of ‘how much’ of a component is present ❖ Characterization Analysis ❖ Fundamental Analysis
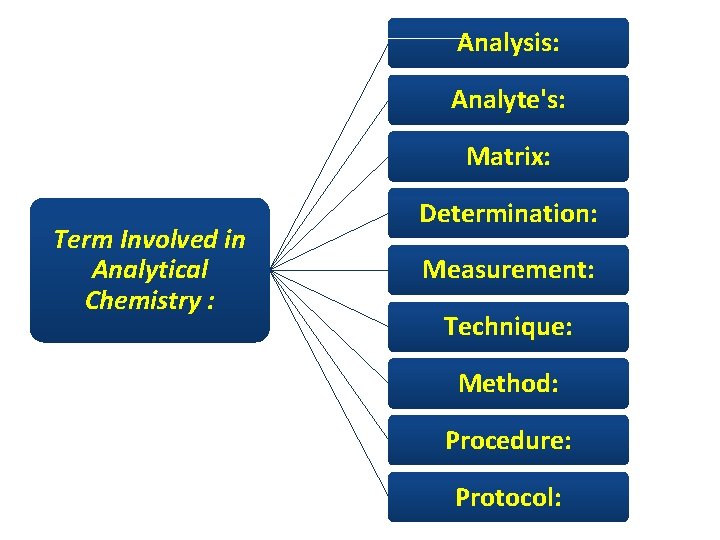
Analysis: Analyte's: Matrix: Term Involved in Analytical Chemistry : Determination: Measurement: Technique: Method: Procedure: Protocol:
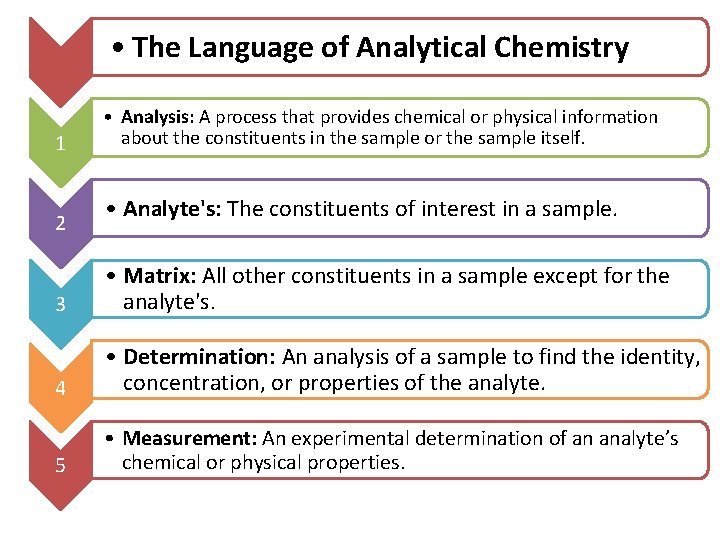
• The Language of Analytical Chemistry 1 2 • Analysis: A process that provides chemical or physical information about the constituents in the sample or the sample itself. • Analyte's: The constituents of interest in a sample. 3 • Matrix: All other constituents in a sample except for the analyte's. 4 • Determination: An analysis of a sample to find the identity, concentration, or properties of the analyte. 5 • Measurement: An experimental determination of an analyte’s chemical or physical properties.
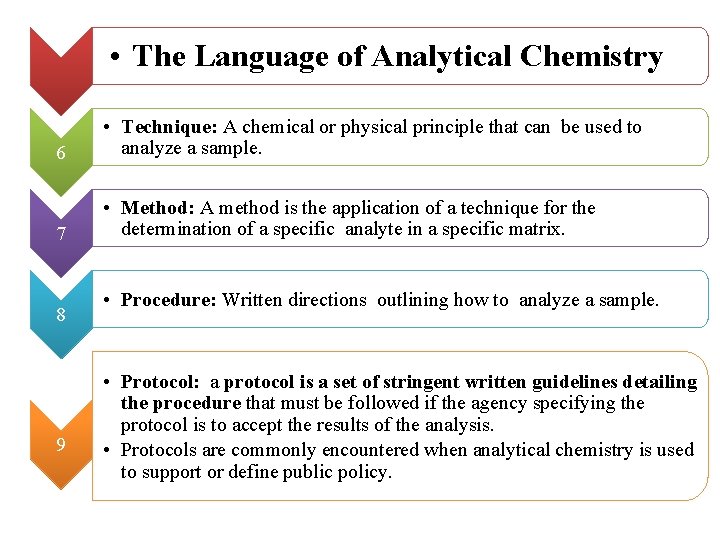
• The Language of Analytical Chemistry 6 • Technique: A chemical or physical principle that can be used to analyze a sample. 7 • Method: A method is the application of a technique for the determination of a specific analyte in a specific matrix. 8 9 • Procedure: Written directions outlining how to analyze a sample. • Protocol: a protocol is a set of stringent written guidelines detailing the procedure that must be followed if the agency specifying the protocol is to accept the results of the analysis. • Protocols are commonly encountered when analytical chemistry is used to support or define public policy.
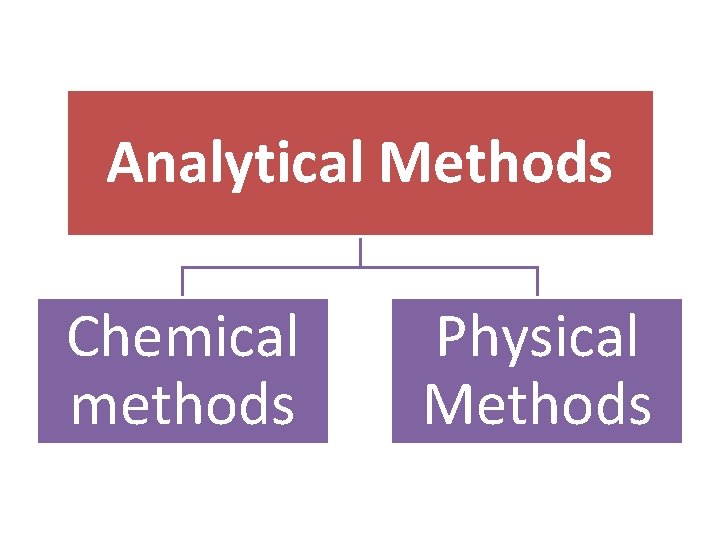
Analytical Methods Chemical methods Physical Methods
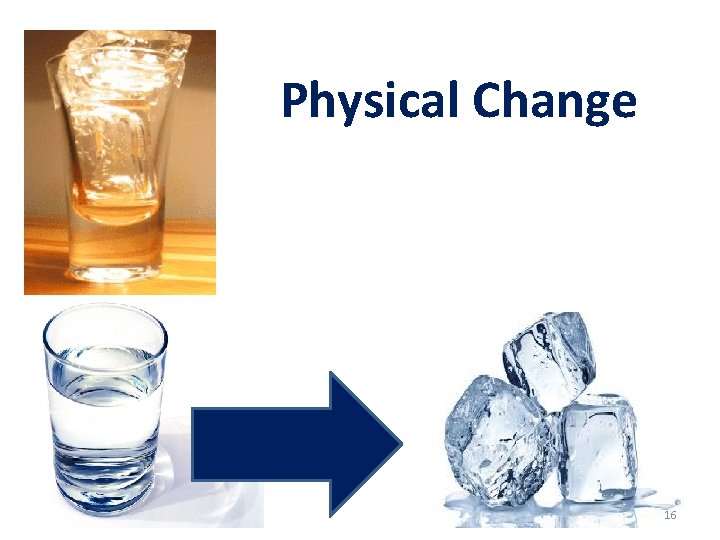
Physical Change 16
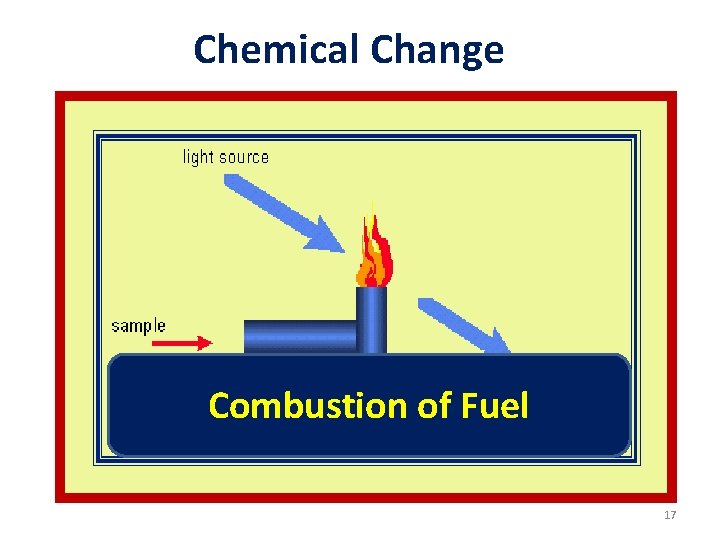
Chemical Change Combustion of Fuel 17
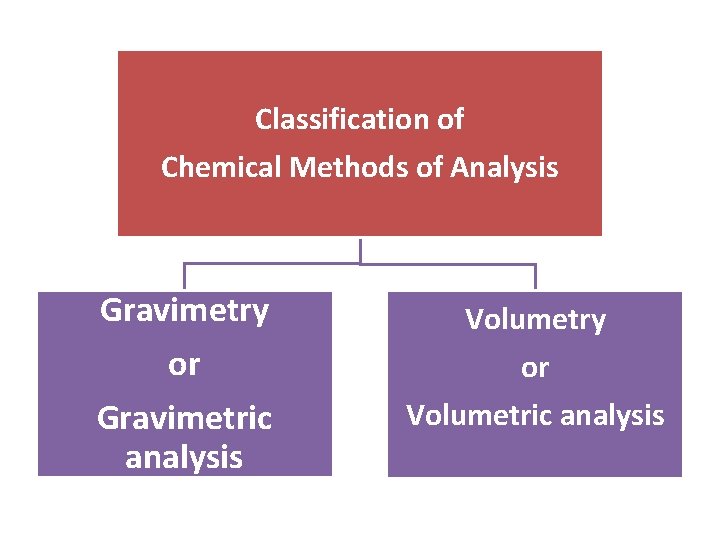
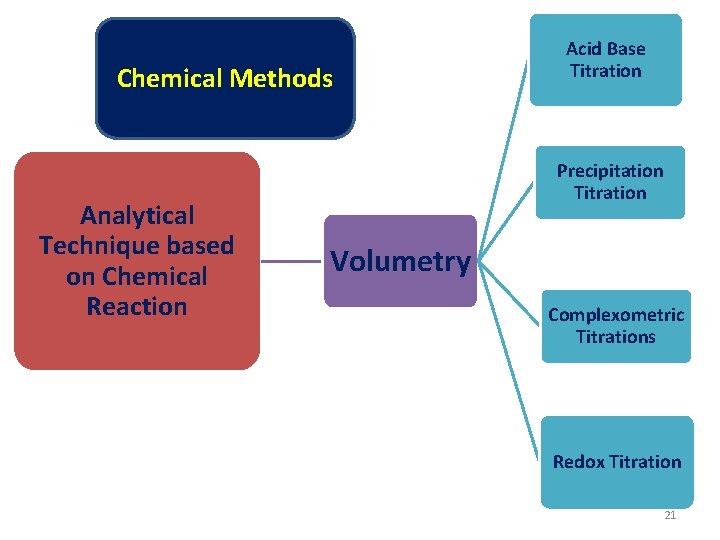
Classification of Chemical Methods of Analysis Gravimetry or Gravimetric analysis Volumetry or Volumetric analysis
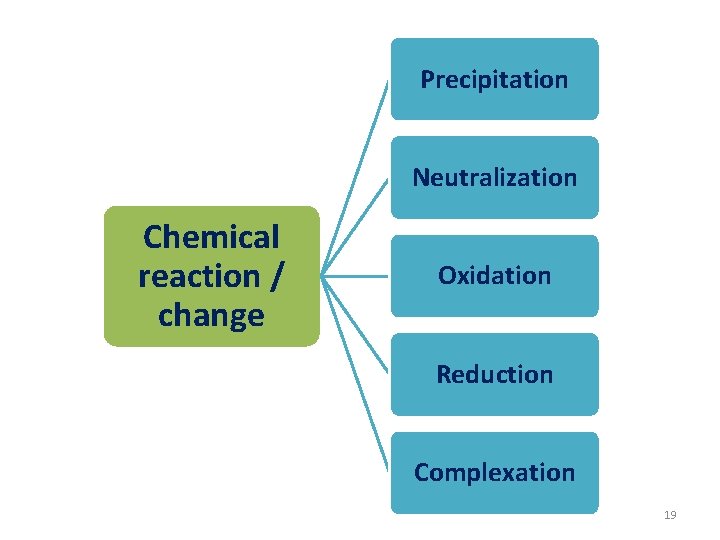
Precipitation Neutralization Chemical reaction / change Oxidation Reduction Complexation 19
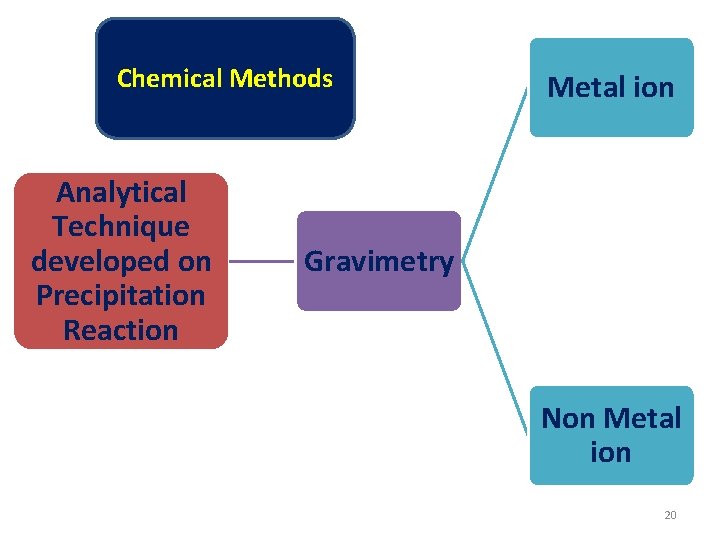
Chemical Methods Analytical Technique developed on Precipitation Reaction Metal ion Gravimetry Non Metal ion 20
Chemical Methods Analytical Technique based on Chemical Reaction Acid Base Titration Precipitation Titration Volumetry Complexometric Titrations Redox Titration 21
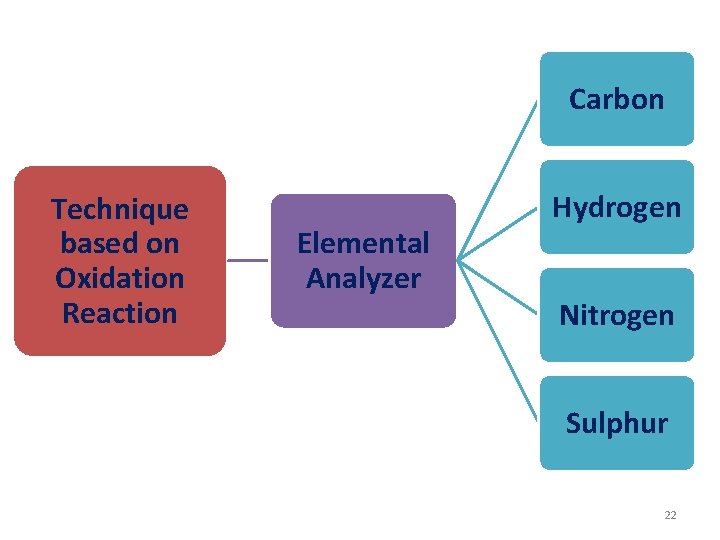
Carbon Technique based on Oxidation Reaction Elemental Analyzer Hydrogen Nitrogen Sulphur 22
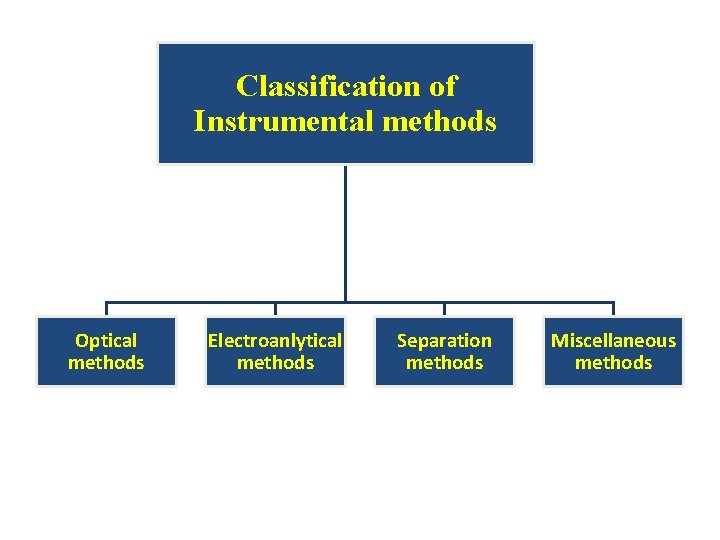
Classification of Instrumental methods Optical methods Electroanlytical methods Separation methods Miscellaneous methods
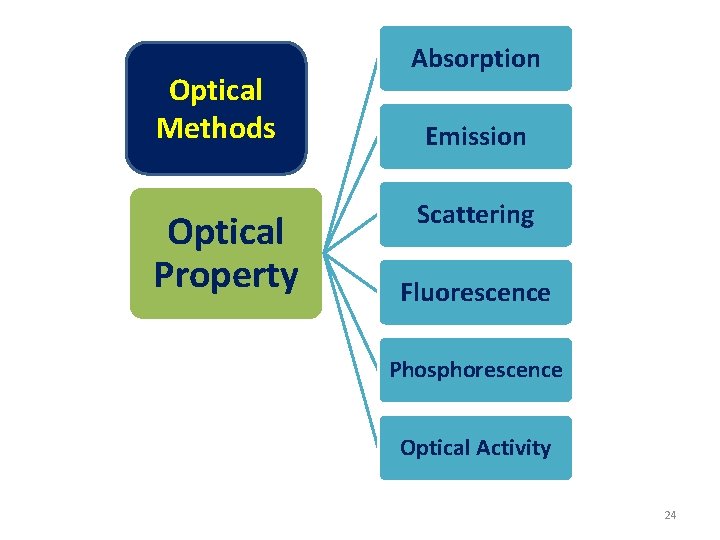
Optical Methods Optical Property Absorption Emission Scattering Fluorescence Phosphorescence Optical Activity 24
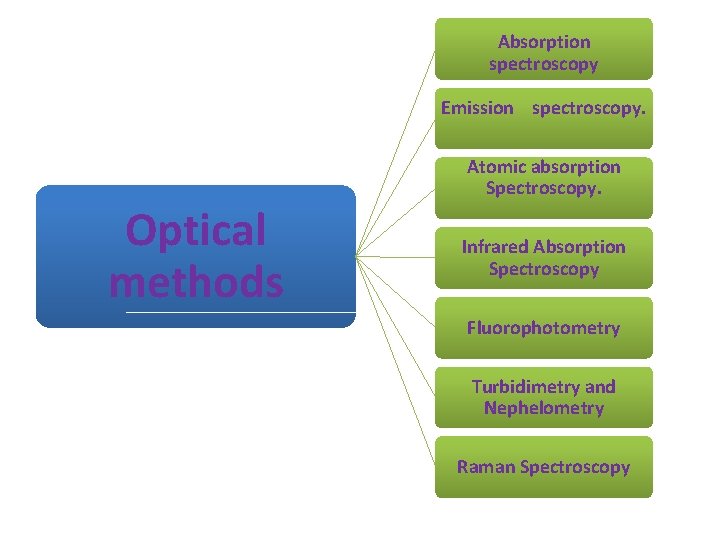
Absorption spectroscopy Emission spectroscopy. Optical methods Atomic absorption Spectroscopy. Infrared Absorption Spectroscopy Fluorophotometry Turbidimetry and Nephelometry Raman Spectroscopy
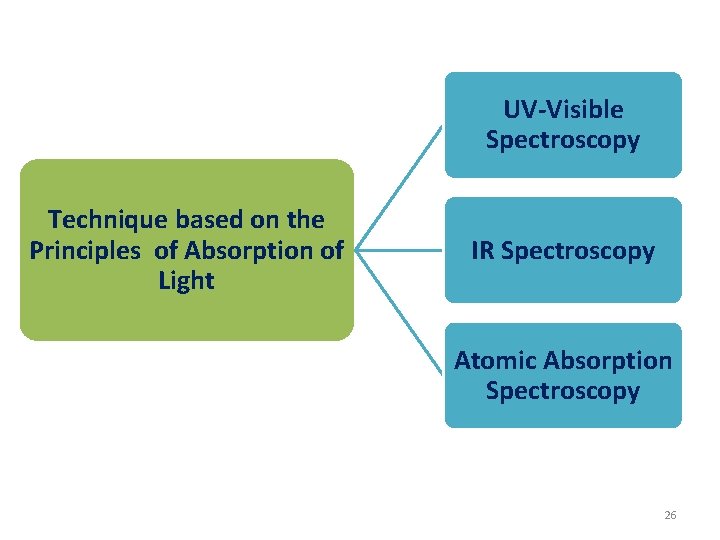
UV-Visible Spectroscopy Technique based on the Principles of Absorption of Light IR Spectroscopy Atomic Absorption Spectroscopy 26
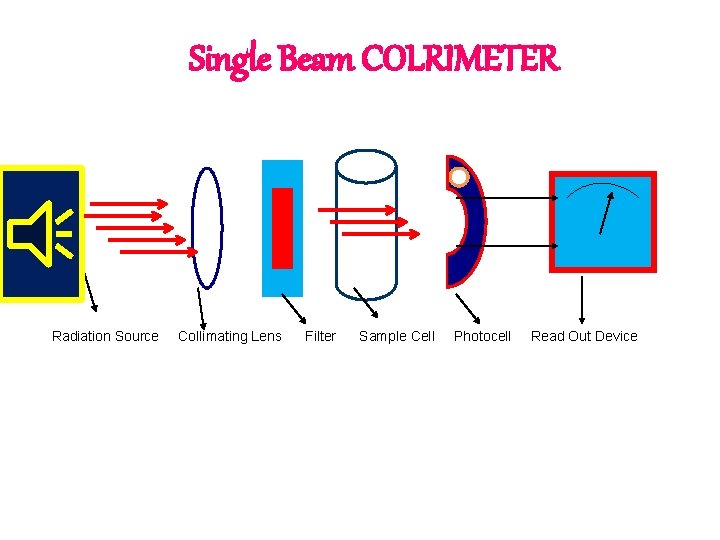
Single Beam COLRIMETER Radiation Source Collimating Lens Filter Sample Cell Photocell Read Out Device
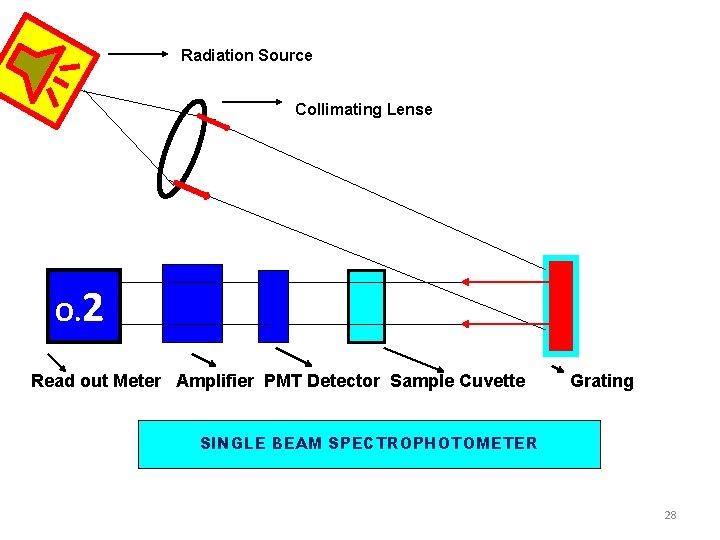
Radiation Source Collimating Lense O. 2 Read out Meter Amplifier PMT Detector Sample Cuvette Grating SINGLE BEAM SPECTROPHOTOMETER 28
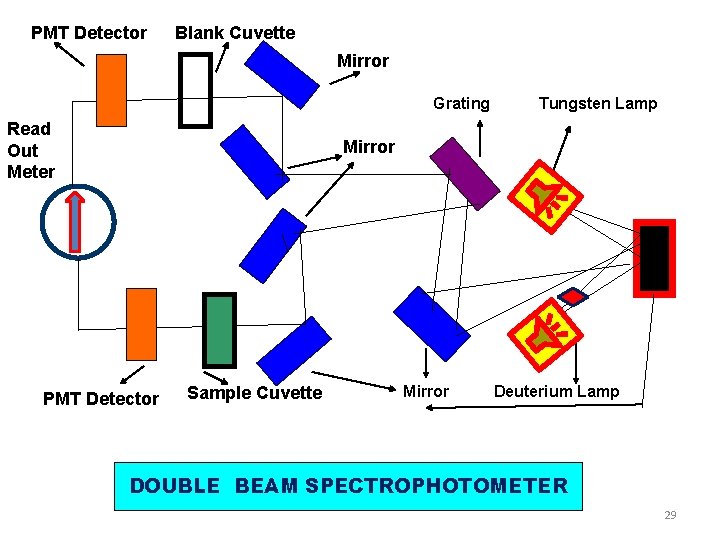
PMT Detector Blank Cuvette Mirror Grating Read Out Meter Tungsten Lamp Mirror PMT Detector Sample Cuvette Mirror Deuterium Lamp DOUBLE BEAM SPECTROPHOTOMETER 29
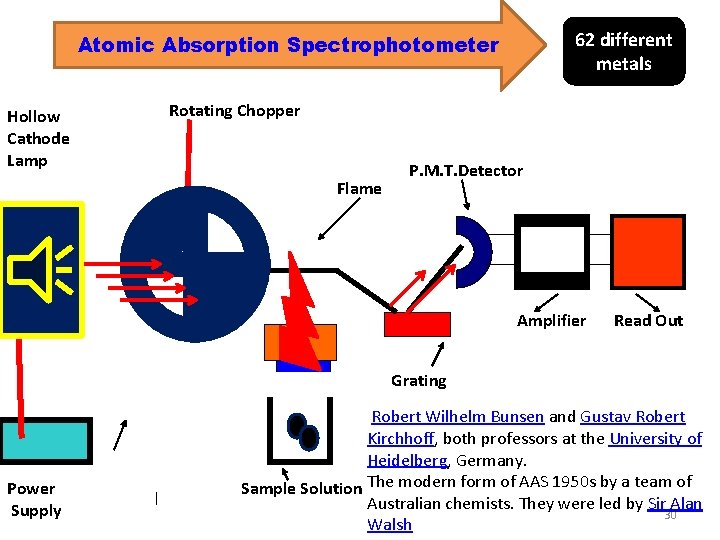
62 different metals Atomic Absorption Spectrophotometer Hollow Cathode Lamp Rotating Chopper Flame P. M. T. Detector Amplifier Read Out Grating Power Supply Robert Wilhelm Bunsen and Gustav Robert Kirchhoff, both professors at the University of Heidelberg, Germany. Sample Solution The modern form of AAS 1950 s by a team of Australian chemists. They were led by Sir Alan 30 Walsh
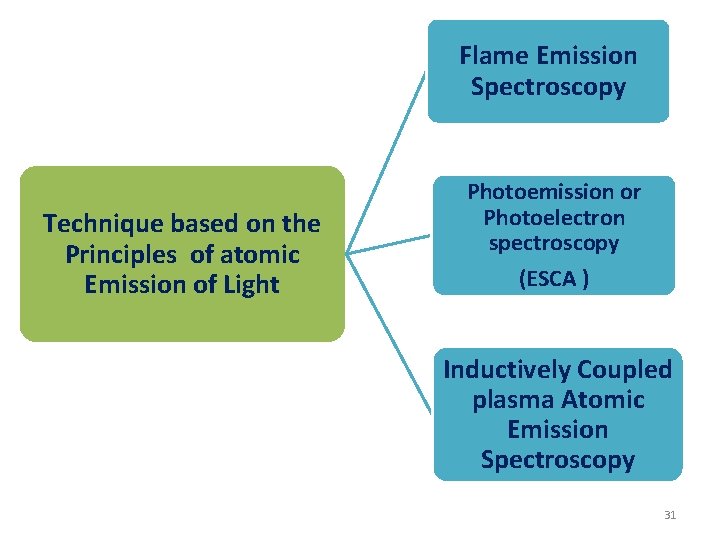
Flame Emission Spectroscopy Technique based on the Principles of atomic Emission of Light Photoemission or Photoelectron spectroscopy (ESCA ) Inductively Coupled plasma Atomic Emission Spectroscopy 31
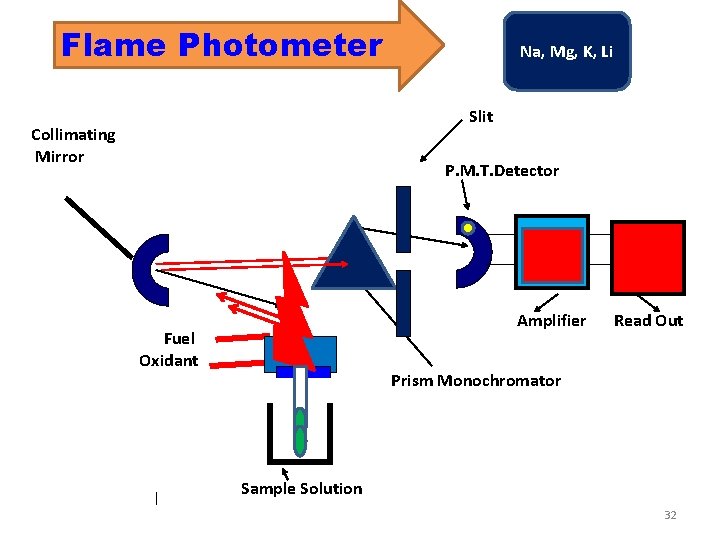
Flame Photometer Na, Mg, K, Li Slit Collimating Mirror P. M. T. Detector Amplifier Fuel Oxidant Read Out Prism Monochromator Sample Solution 32
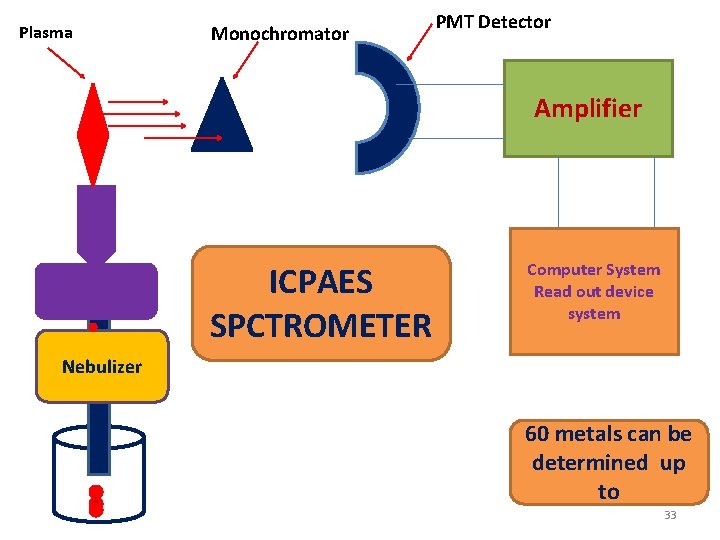
Plasma PMT Detector Monochromator Amplifier ICPAES SPCTROMETER Computer System Read out device system Nebulizer 60 metals can be determined up to 33
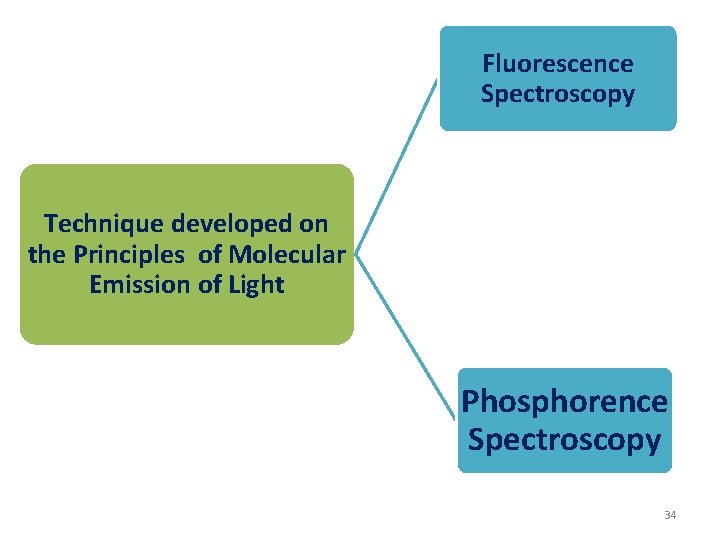
Fluorescence Spectroscopy Technique developed on the Principles of Molecular Emission of Light Phosphorence Spectroscopy 34
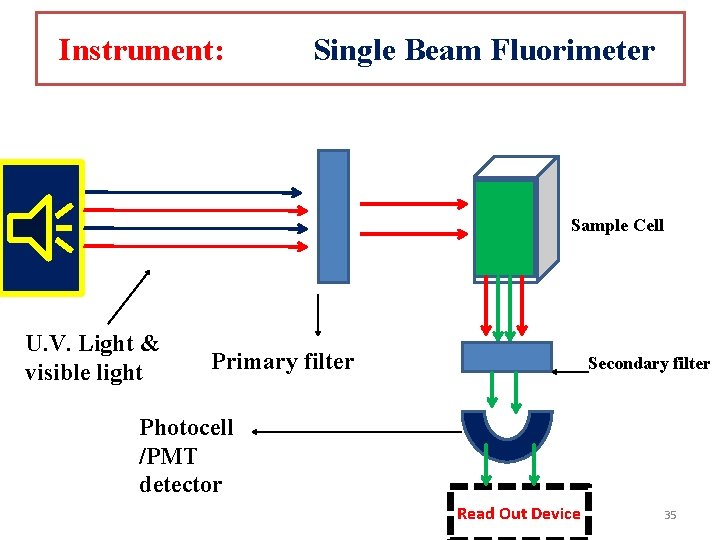
Instrument: Single Beam Fluorimeter Sample Cell U. V. Light & visible light Primary filter Secondary filter Photocell /PMT detector Read Out Device 35
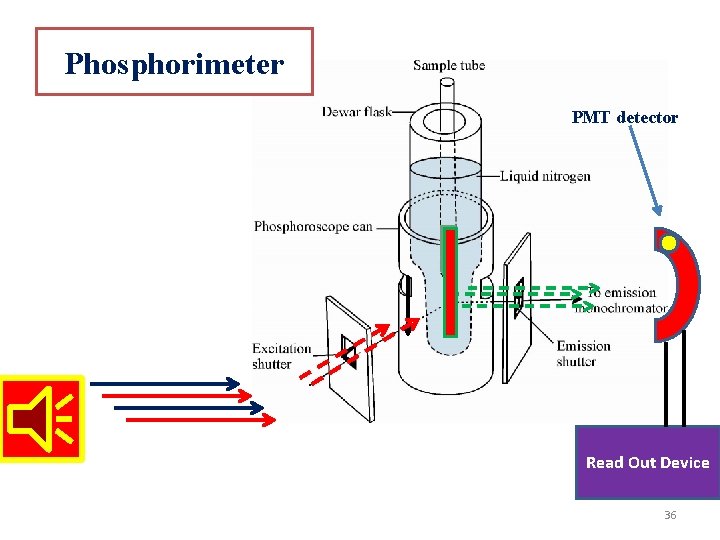
Phosphorimeter PMT detector Read Out Device 36
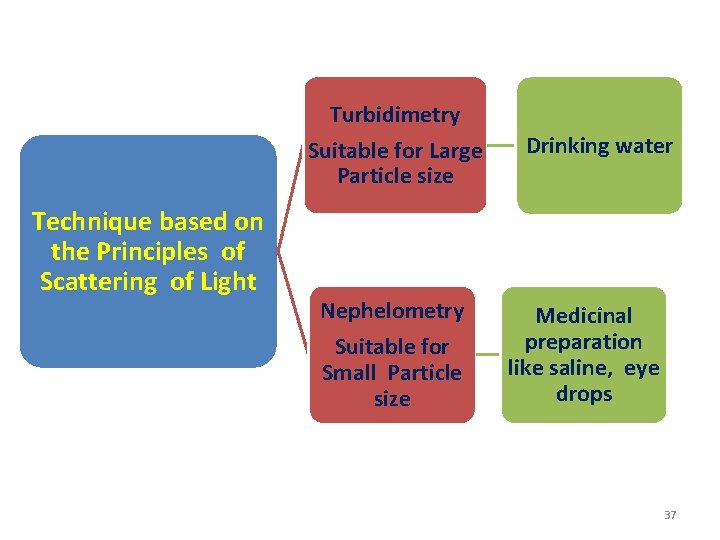
Turbidimetry Suitable for Large Particle size Technique based on the Principles of Scattering of Light Nephelometry Suitable for Small Particle size Drinking water Medicinal preparation like saline, eye drops 37
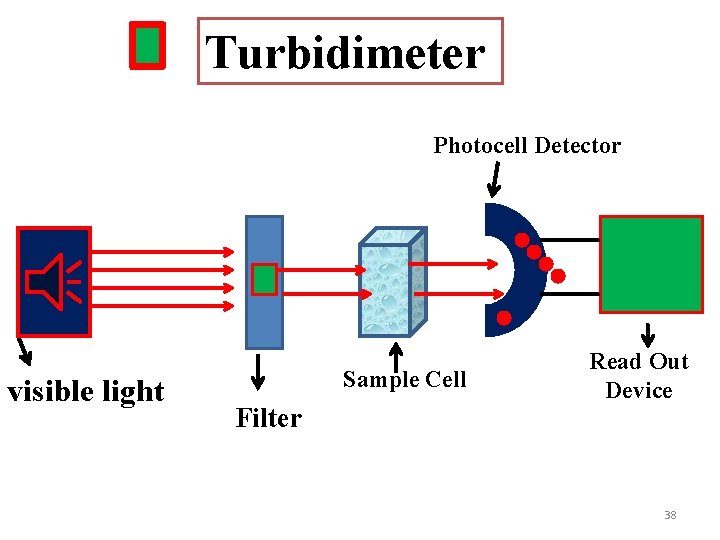
Turbidimeter Photocell Detector visible light Sample Cell Filter Read Out Device 38
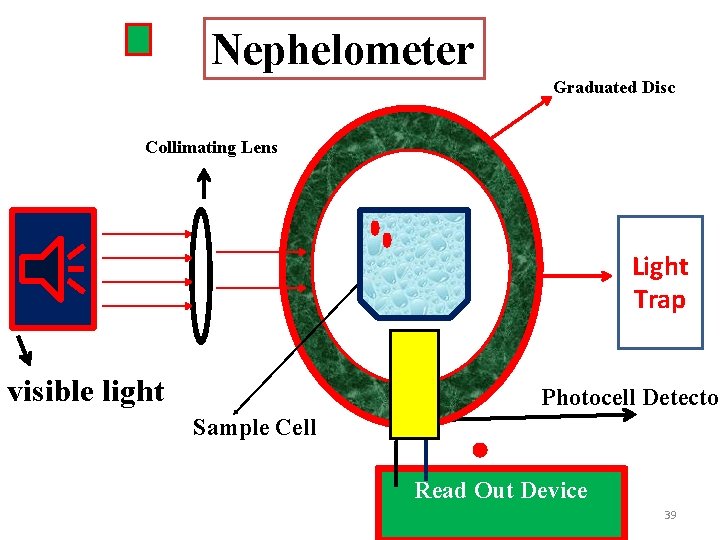
Nephelometer Graduated Disc Collimating Lens Light Trap visible light Photocell Detector Sample Cell Read Out Device 39
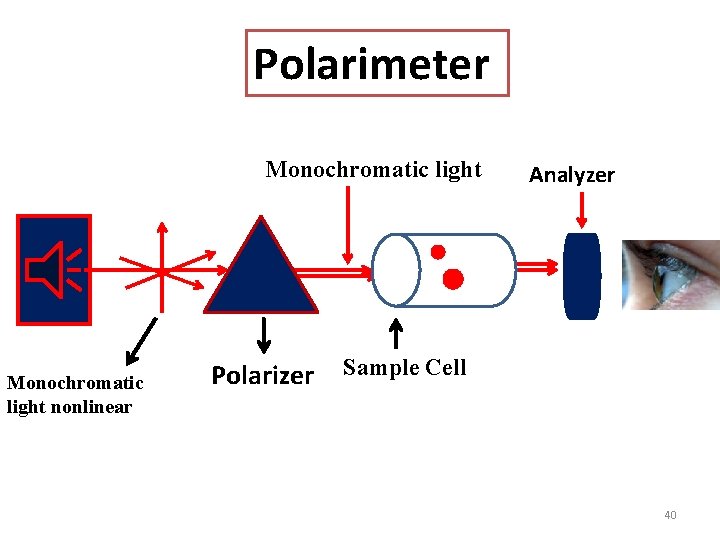
Polarimeter Monochromatic light nonlinear Analyzer Polarizer Sample Cell 40
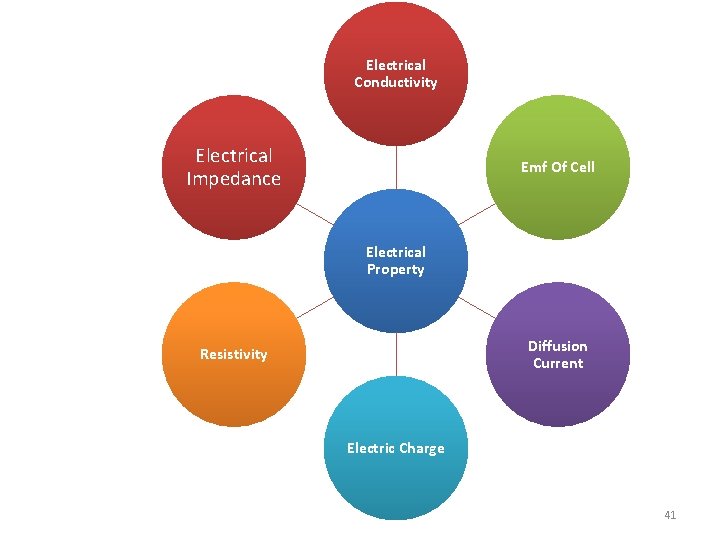
Electrical Conductivity Electrical Impedance Emf Of Cell Electrical Property Diffusion Current Resistivity Electric Charge 41
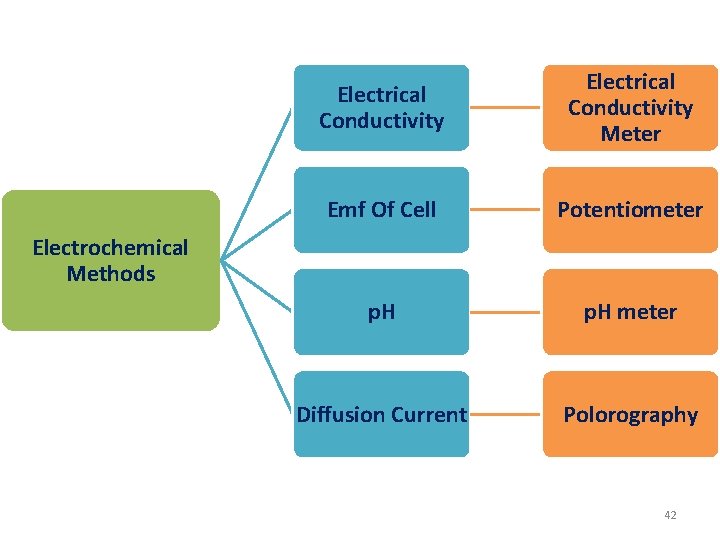
Electrical Conductivity Meter Emf Of Cell Potentiometer p. H meter Diffusion Current Polorography Electrochemical Methods 42
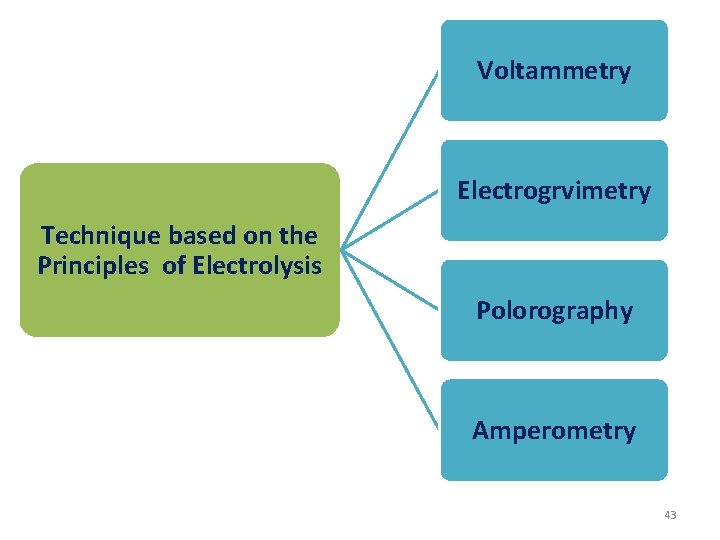
Voltammetry Electrogrvimetry Technique based on the Principles of Electrolysis Polorography Amperometry 43
• Separation techniques • Why separations is essential ? 44
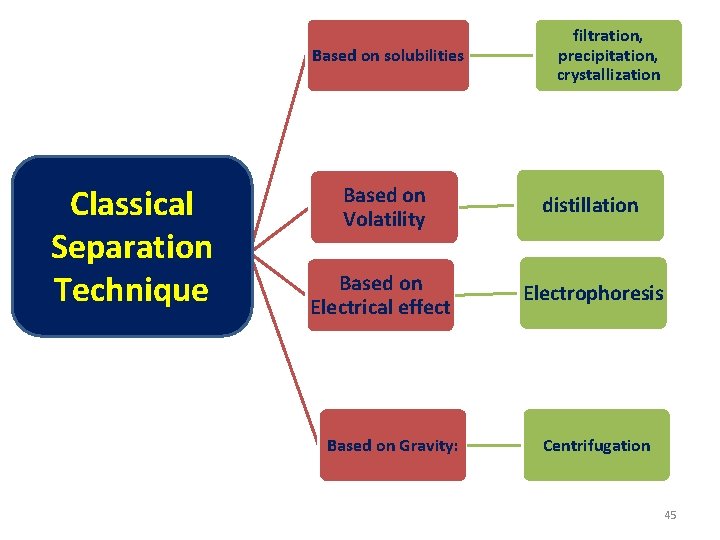
Based on solubilities Classical Separation Technique filtration, precipitation, crystallization Based on Volatility distillation Based on Electrical effect Electrophoresis Based on Gravity: Centrifugation 45
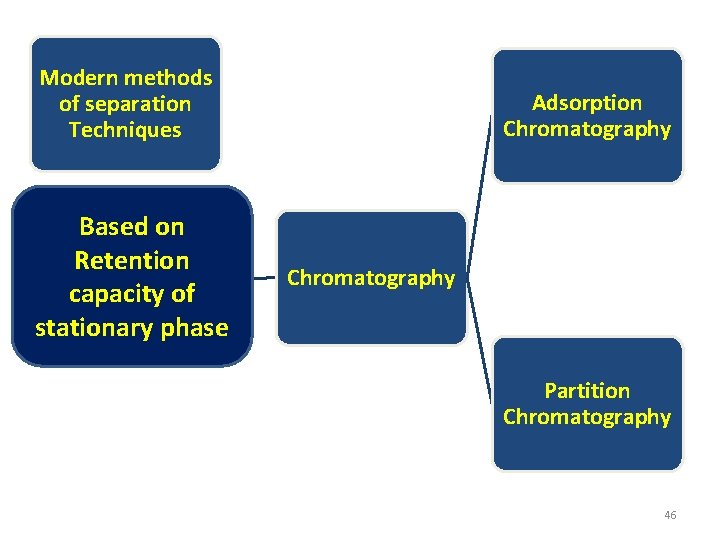
Modern methods of separation Techniques Based on Retention capacity of stationary phase Adsorption Chromatography Partition Chromatography 46
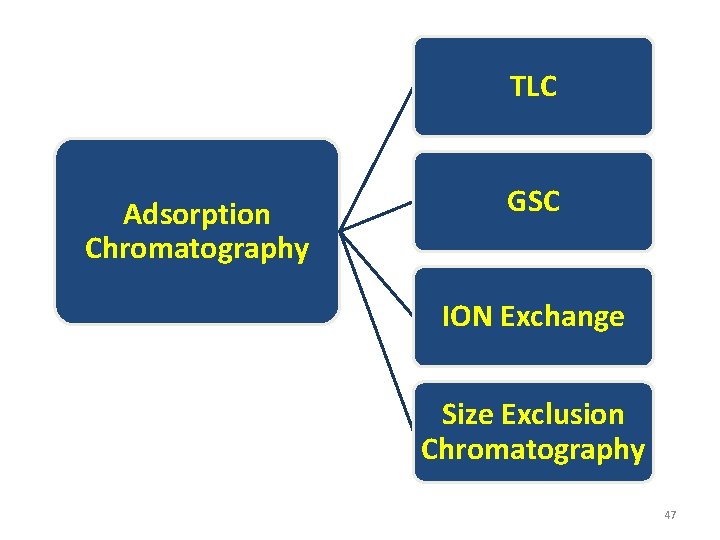
TLC Adsorption Chromatography GSC ION Exchange Size Exclusion Chromatography 47
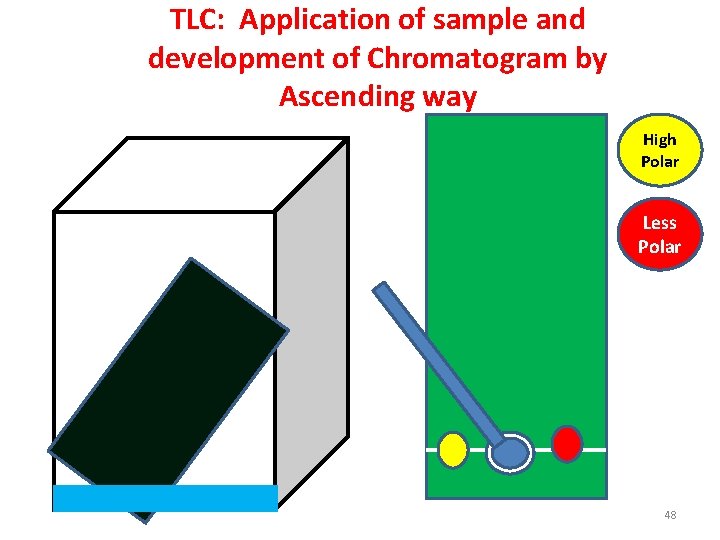
TLC: Application of sample and development of Chromatogram by Ascending way High Polar Less Polar 48
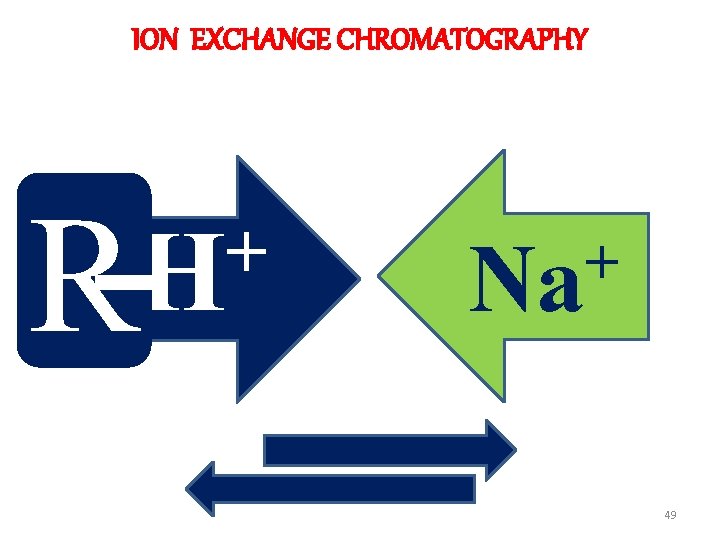
ION EXCHANGE CHROMATOGRAPHY H+ R + H + Na 49
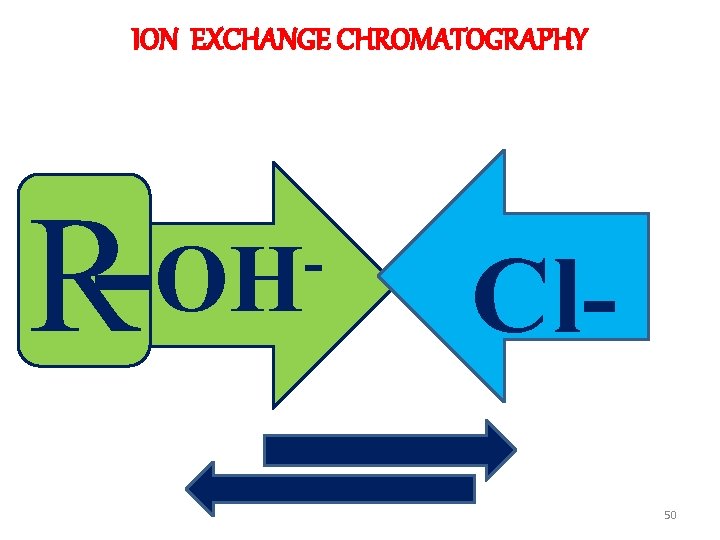
ION EXCHANGE CHROMATOGRAPHY H+ R OH Cl 50
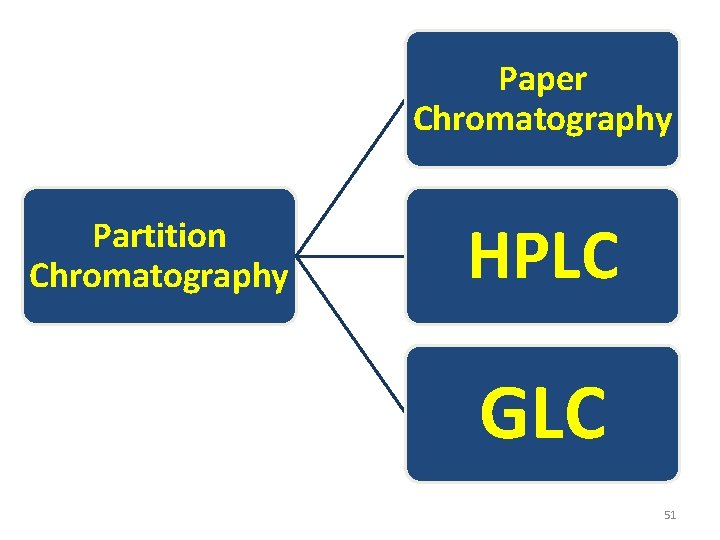
Paper Chromatography Partition Chromatography HPLC GLC 51
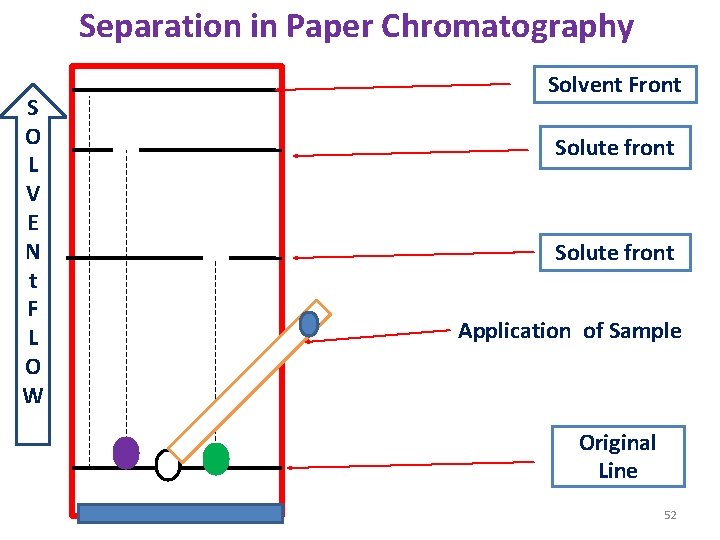
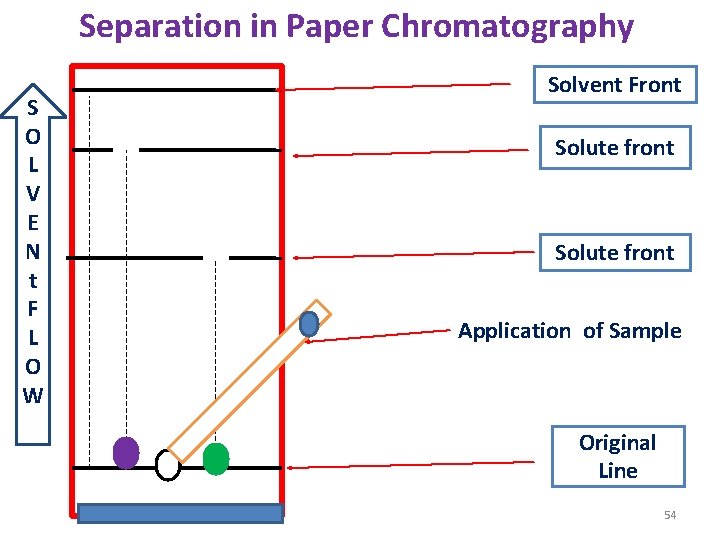
Separation in Paper Chromatography S O L V E N t F L O W Solvent Front Solute front Application of Sample Original Line 52
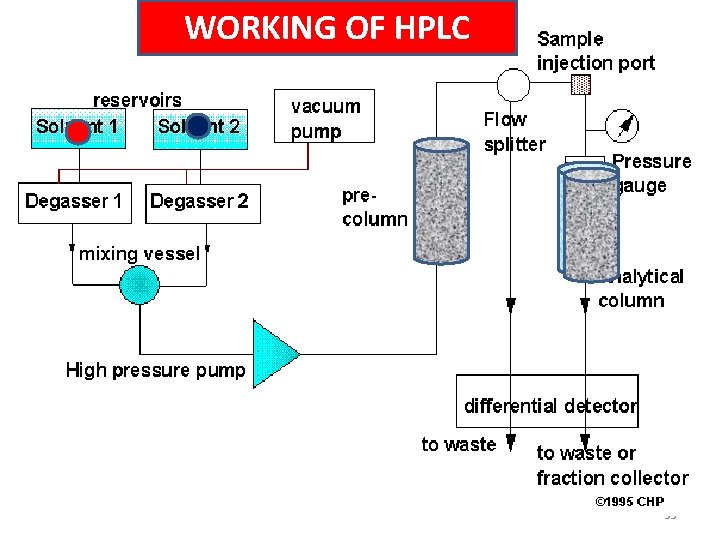
WORKING OF HPLC 53
Separation in Paper Chromatography S O L V E N t F L O W Solvent Front Solute front Application of Sample Original Line 54
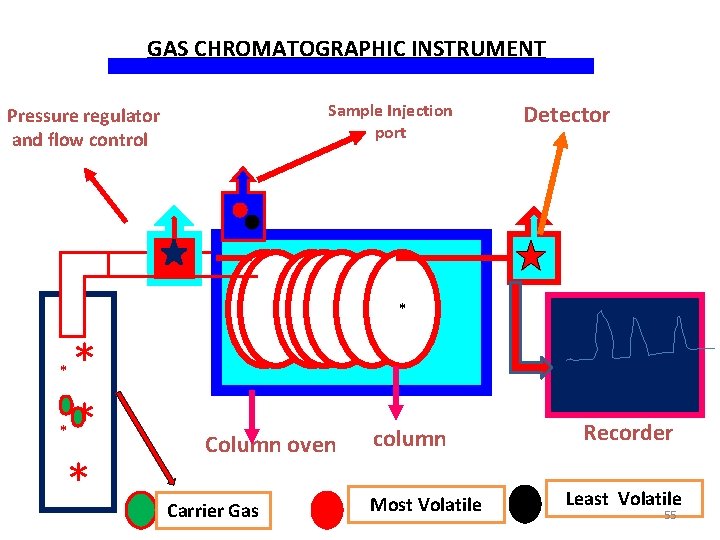
GAS CHROMATOGRAPHIC INSTRUMENT Sample Injection port Pressure regulator and flow control * * * Column oven Carrier Gas Detector * column Most Volatile Recorder Least Volatile 55
• New Versions of Chromatography 56
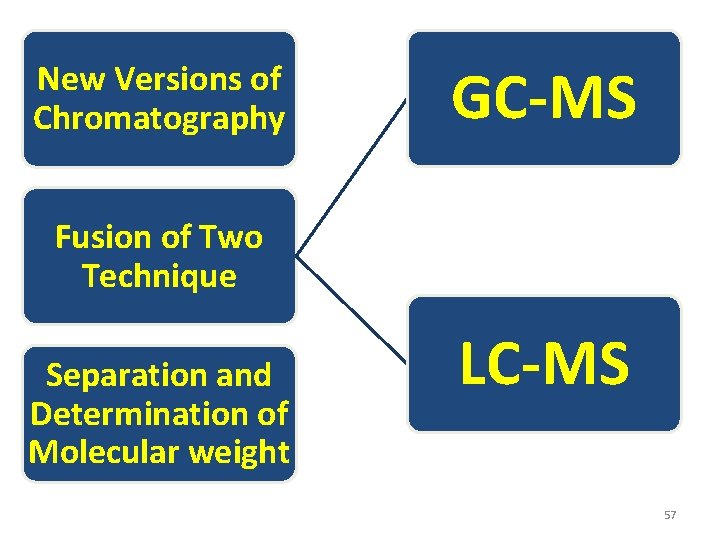
New Versions of Chromatography GC-MS Fusion of Two Technique Separation and Determination of Molecular weight LC-MS 57
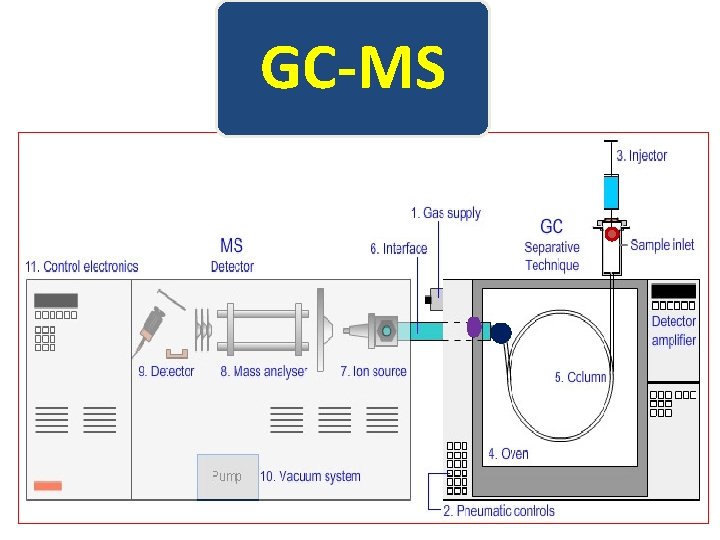
GC-MS
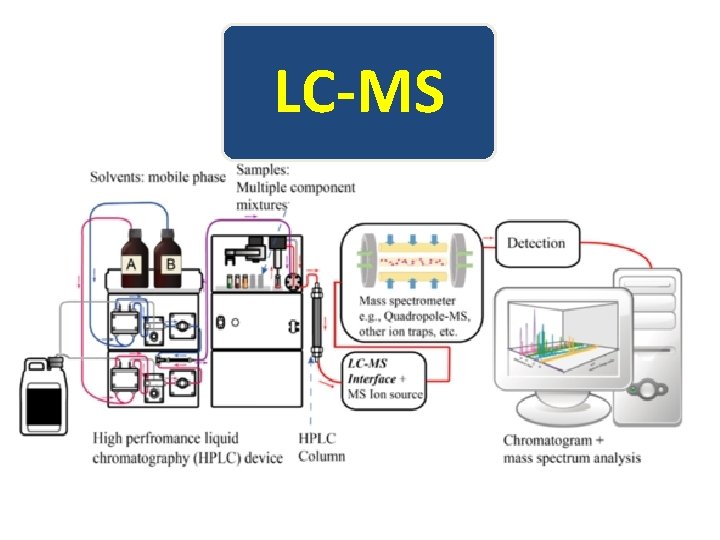
LC-MS
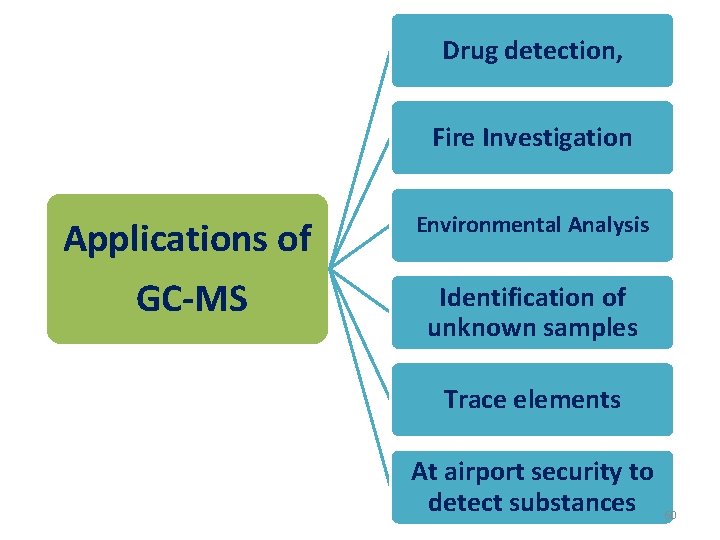
Drug detection, Fire Investigation Applications of Environmental Analysis GC-MS Identification of unknown samples Trace elements At airport security to detect substances 60
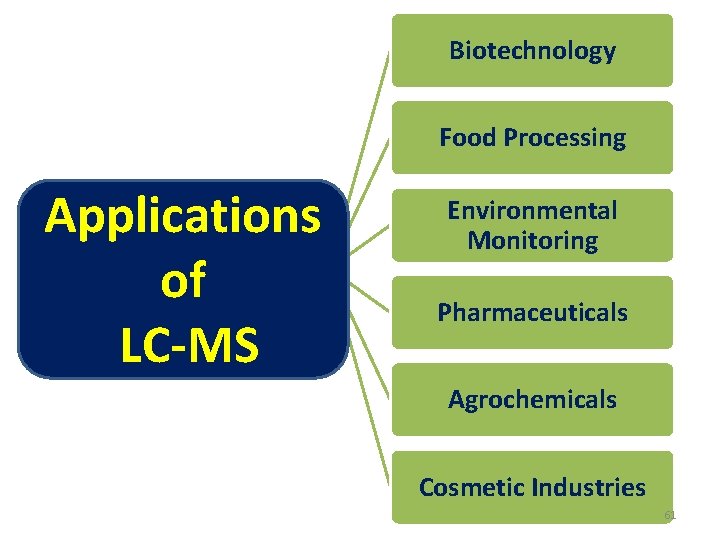
Biotechnology Food Processing Applications of LC-MS Environmental Monitoring Pharmaceuticals Agrochemicals Cosmetic Industries 61
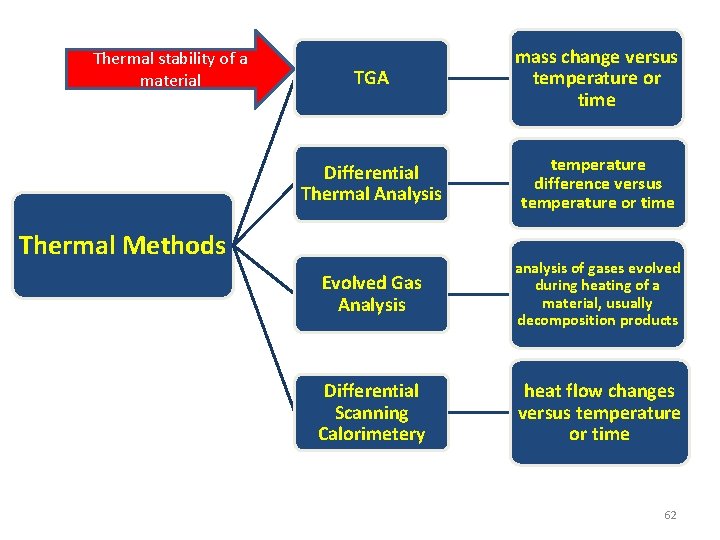
Thermal stability of a material TGA mass change versus temperature or time Differential Thermal Analysis temperature difference versus temperature or time Evolved Gas Analysis analysis of gases evolved during heating of a material, usually decomposition products Differential Scanning Calorimetery heat flow changes versus temperature or time Thermal Methods 62
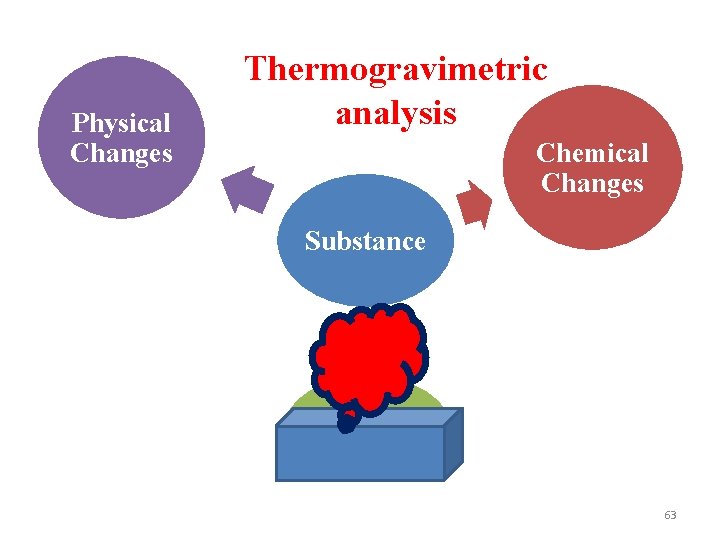
Physical Changes Thermogravimetric analysis Chemical Changes Substance Heated 63
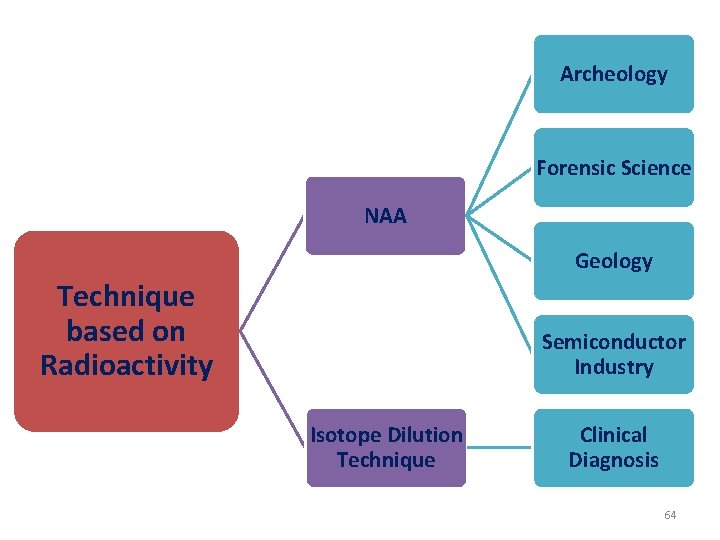
Archeology Forensic Science NAA Geology Technique based on Radioactivity Semiconductor Industry Isotope Dilution Technique Clinical Diagnosis 64
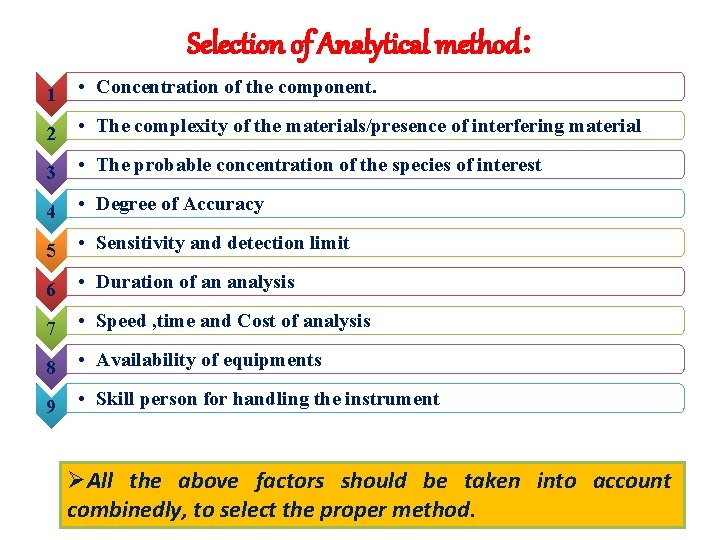
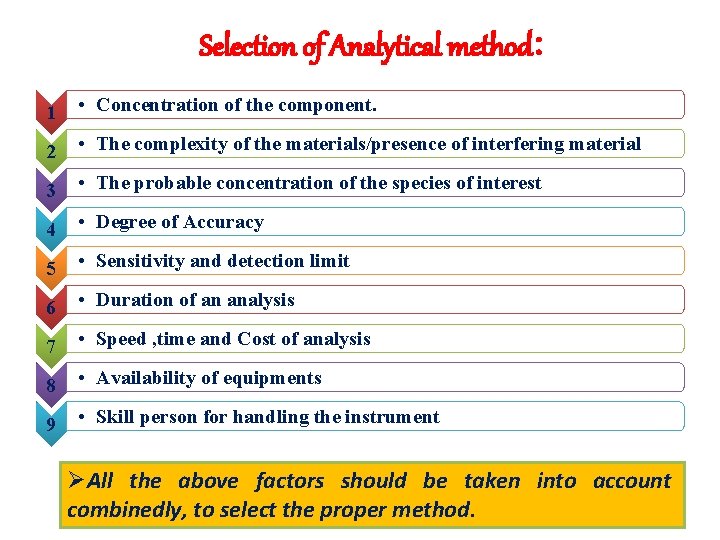
Selection of Analytical method: 1 • Concentration of the component. 2 • The complexity of the materials/presence of interfering material 3 • The probable concentration of the species of interest 4 • Degree of Accuracy 5 • Sensitivity and detection limit 6 • Duration of an analysis 7 • Speed , time and Cost of analysis 8 • Availability of equipments 9 • Skill person for handling the instrument ØAll the above factors should be taken into account combinedly, to select the proper method.
� 1. 1. 3 Errors, determinate errors, and Indeterminate errors, types of determinte errors, takaling of errors. � 1. 1. 4 Quntitive methods of analysis: calibration curve, standard addition and internal standard methods
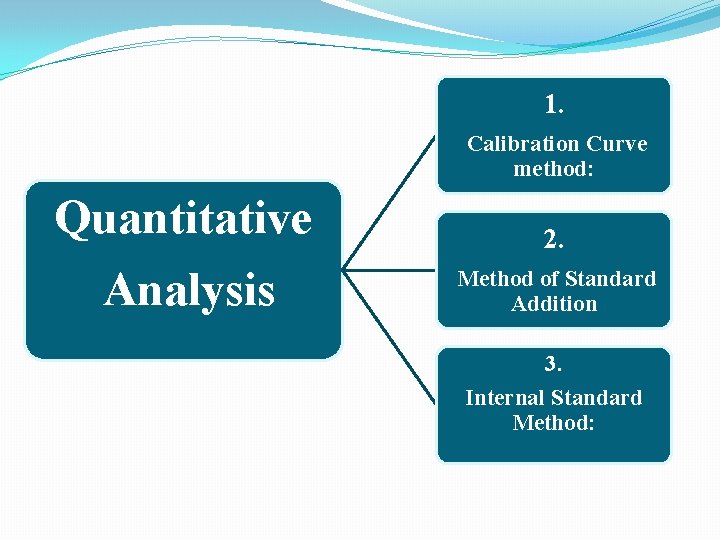
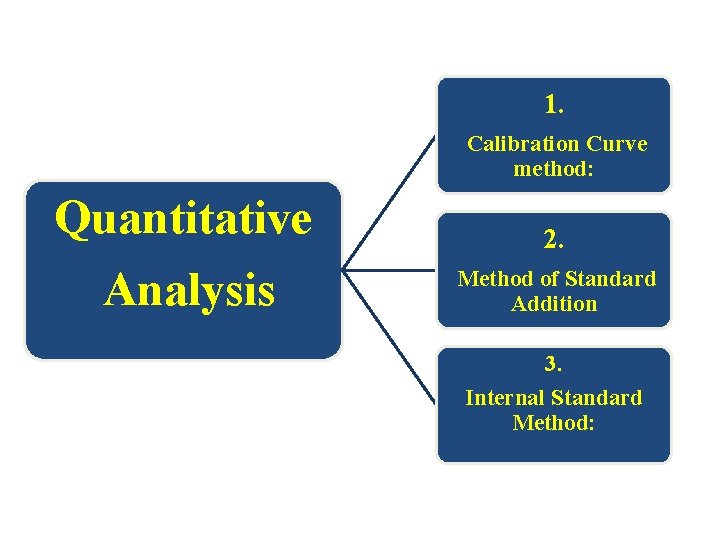
1. Calibration Curve method: Quantitative Analysis 2. Method of Standard Addition 3. Internal Standard Method:
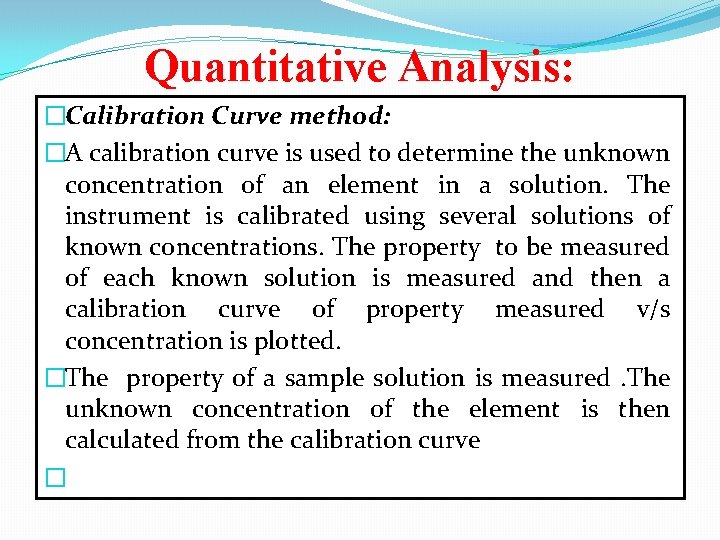
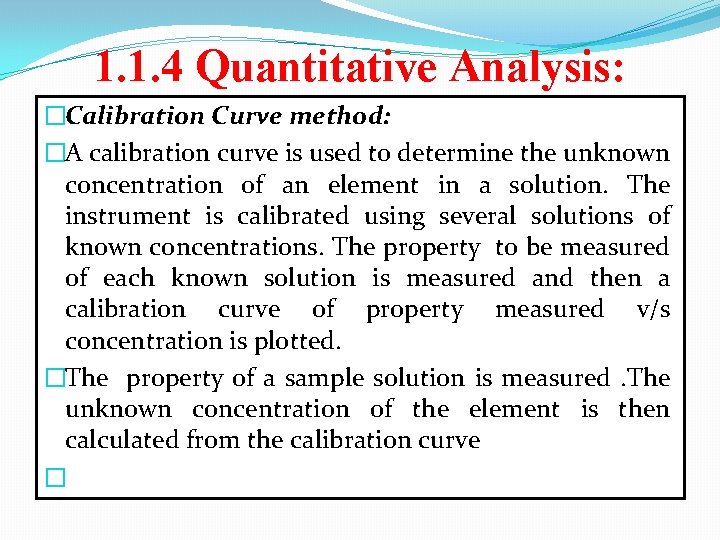
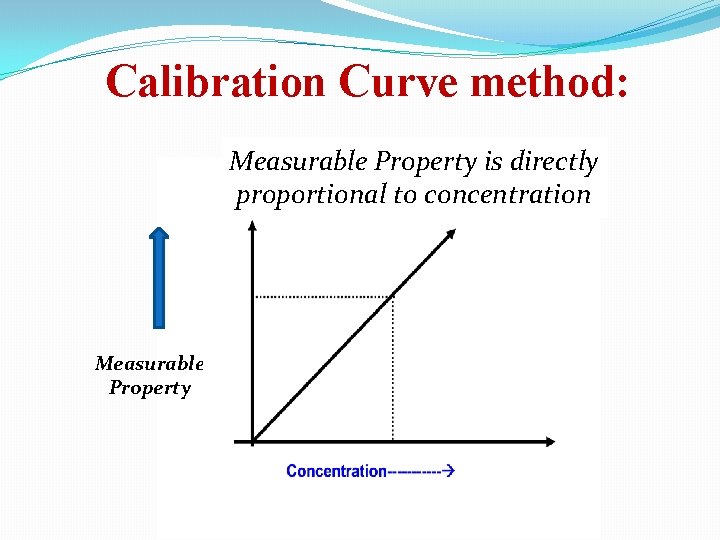
Quantitative Analysis: �Calibration Curve method: �A calibration curve is used to determine the unknown concentration of an element in a solution. The instrument is calibrated using several solutions of known concentrations. The property to be measured of each known solution is measured and then a calibration curve of property measured v/s concentration is plotted. �The property of a sample solution is measured. The unknown concentration of the element is then calculated from the calibration curve �
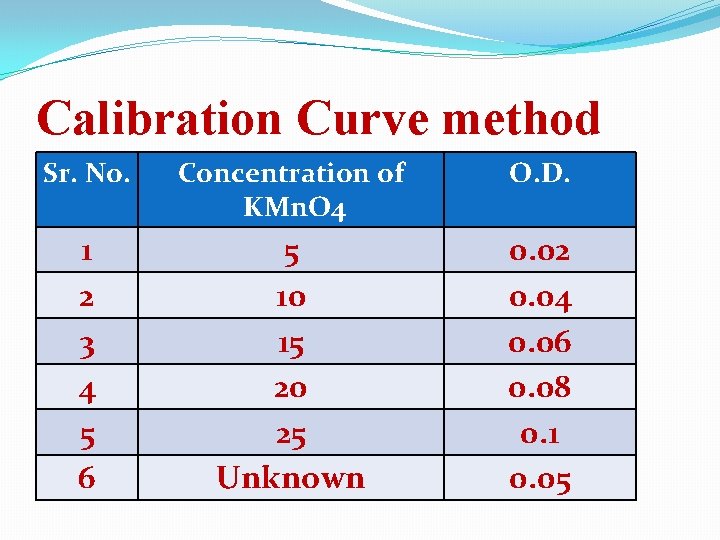
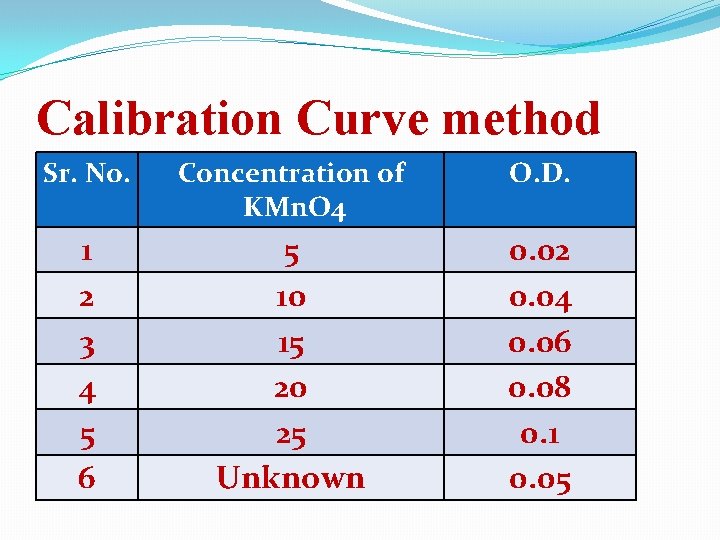
Calibration Curve method Sr. No. Concentration of KMn. O 4 O. D. 1 2 3 4 5 6 5 10 15 20 25 Unknown 0. 02 0. 04 0. 06 0. 08 0. 1 0. 05
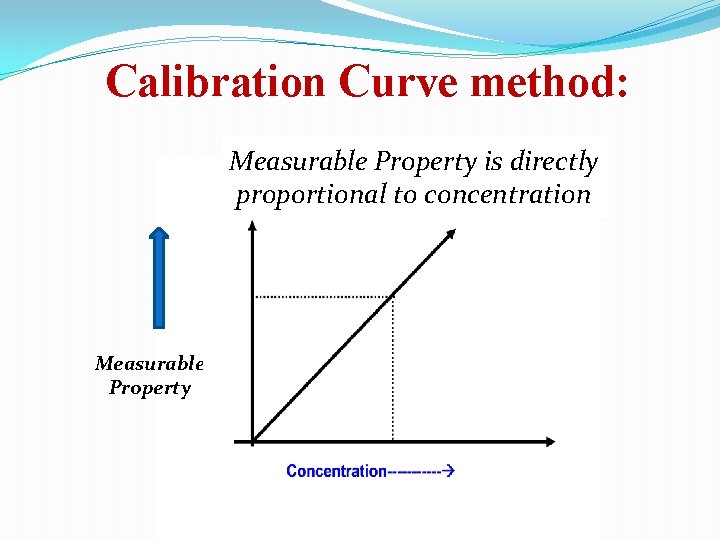
Calibration Curve method: Measurable Property is directly proportional to concentration Measurable Property
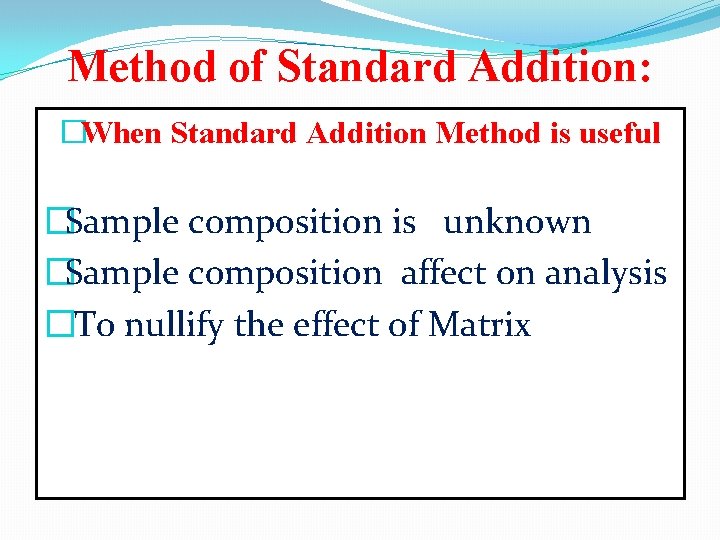
Method of Standard Addition: �When Standard Addition Method is useful �Sample composition is unknown �Sample composition affect on analysis �To nullify the effect of Matrix
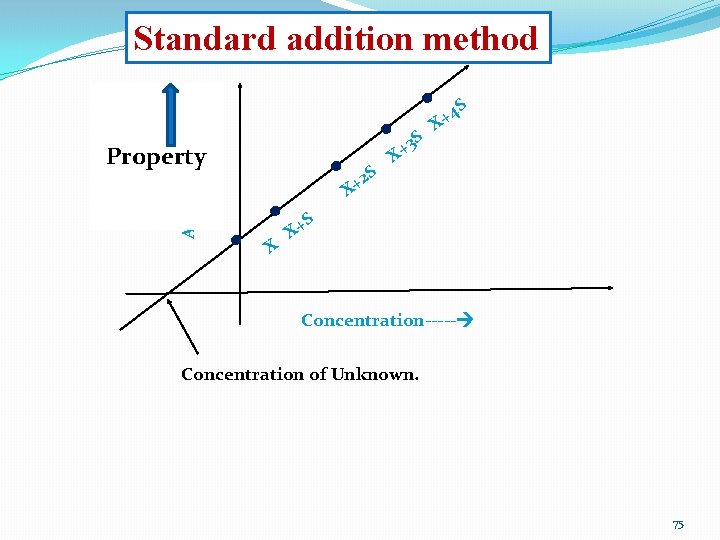
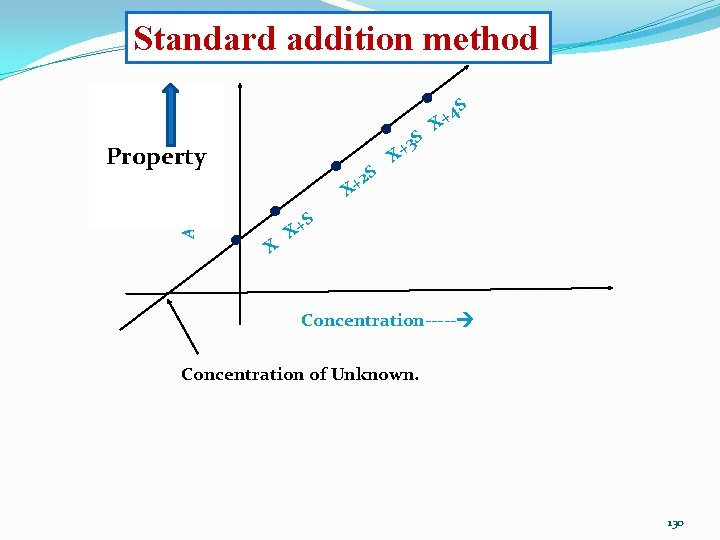
Method of Standard Addition: �In this method the property of unknown (X) is first find out against blank. Then a series of standards having definite amount of unknown (X) plus varying amount of standard are prepared and diluted to same volume in each case. Their property is then measured. A graph of measured property against concentrations of standard (S) gives a linear curve. The concentration of the unknown can be determined by extrapolation of line which cuts to X axis.
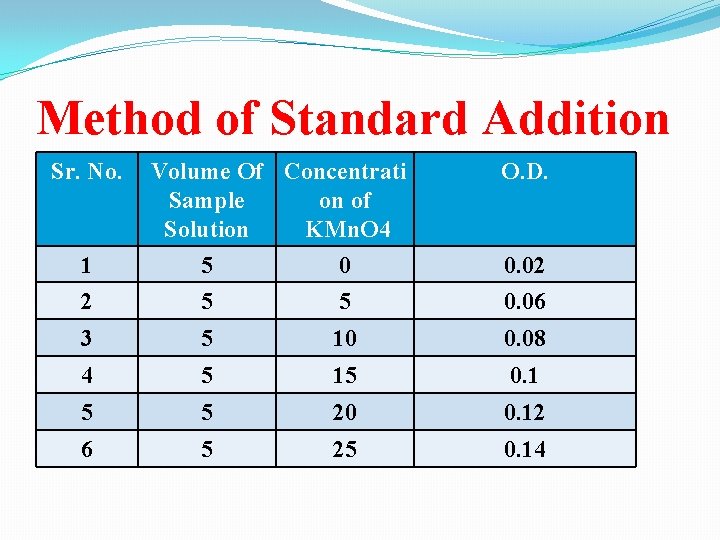
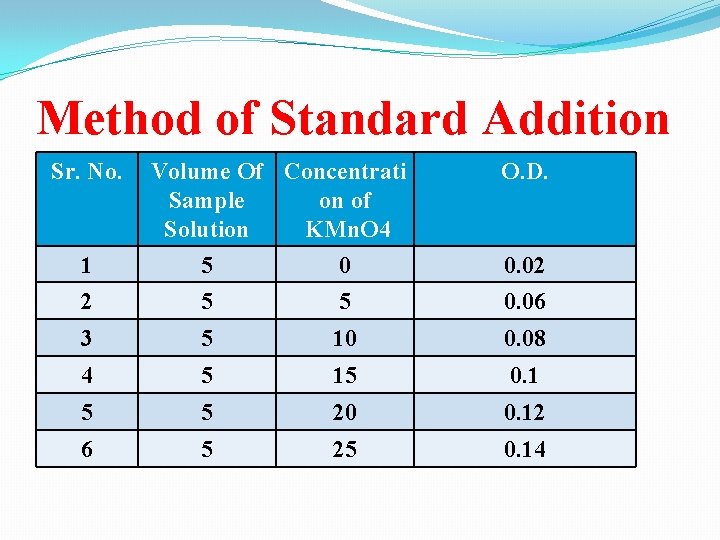
Method of Standard Addition Sr. No. Volume Of Concentrati Sample on of Solution KMn. O 4 O. D. 1 2 5 5 0. 02 0. 06 3 5 10 0. 08 4 5 15 0. 1 5 5 20 0. 12 6 5 25 0. 14
Absorbance--- Standard addition method Property . . X . 2 + X . . S 3 S + X 4 S + X S X+ Concentration----- Concentration of Unknown. 75
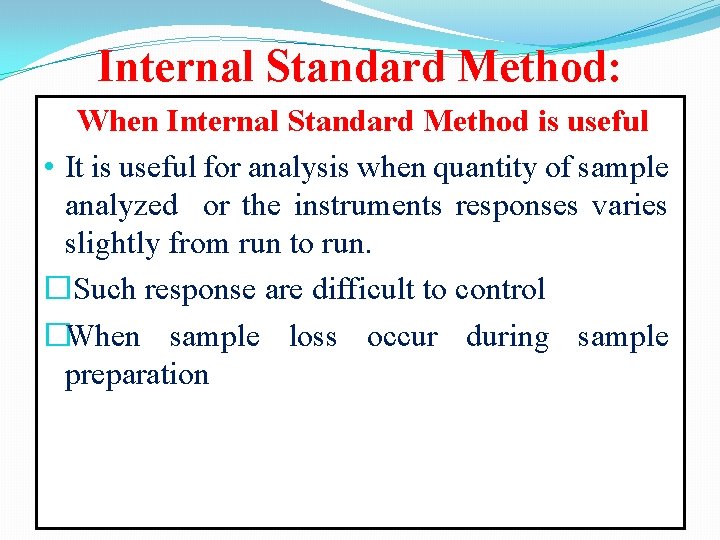
Internal Standard Method: When Internal Standard Method is useful • It is useful for analysis when quantity of sample analyzed or the instruments responses varies slightly from run to run. �Such response are difficult to control �When sample loss occur during sample preparation
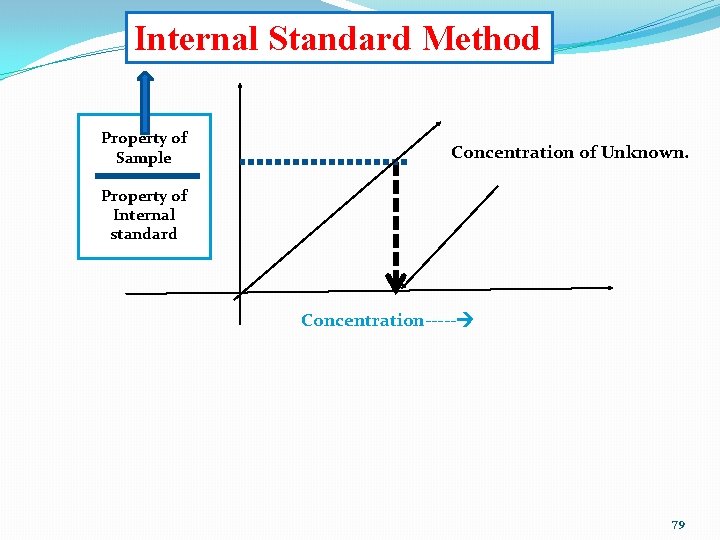
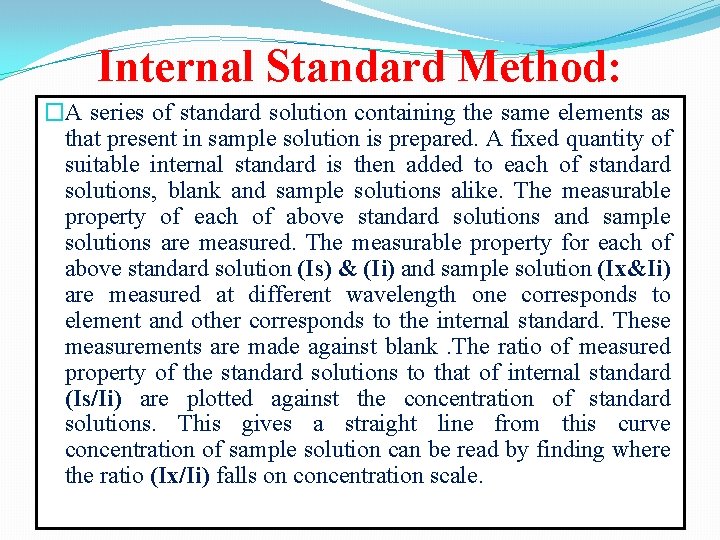
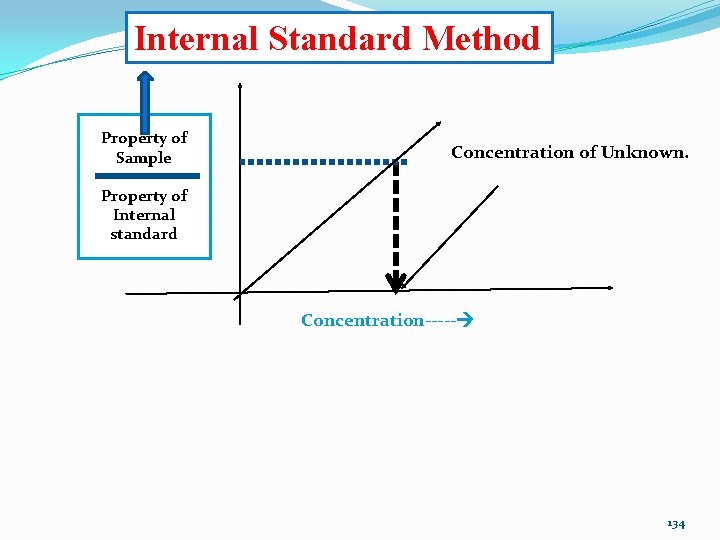
Internal Standard Method: �A series of standard solution containing the same elements as that present in sample solution is prepared. A fixed quantity of suitable internal standard is then added to each of standard solutions, blank and sample solutions alike. The measurable property of each of above standard solutions and sample solutions are measured. The measurable property for each of above standard solution (Is) & (Ii) and sample solution (Ix&Ii) are measured at different wavelength one corresponds to element and other corresponds to the internal standard. These measurements are made against blank. The ratio of measured property of the standard solutions to that of internal standard (Is/Ii) are plotted against the concentration of standard solutions. This gives a straight line from this curve concentration of sample solution can be read by finding where the ratio (Ix/Ii) falls on concentration scale.
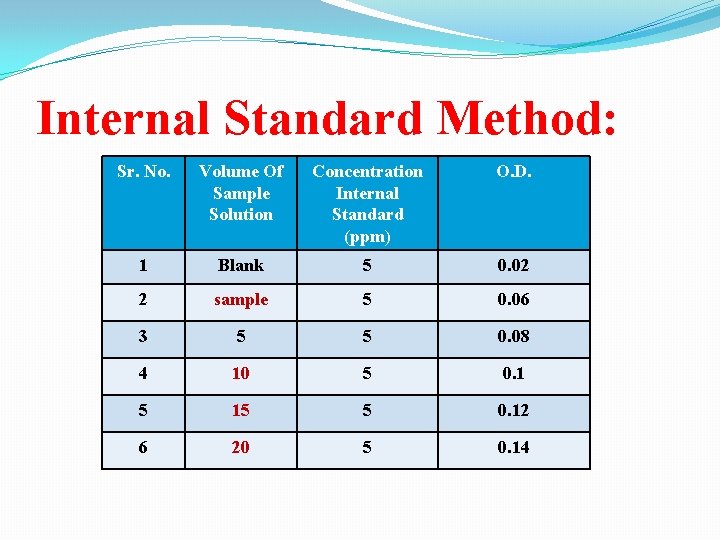
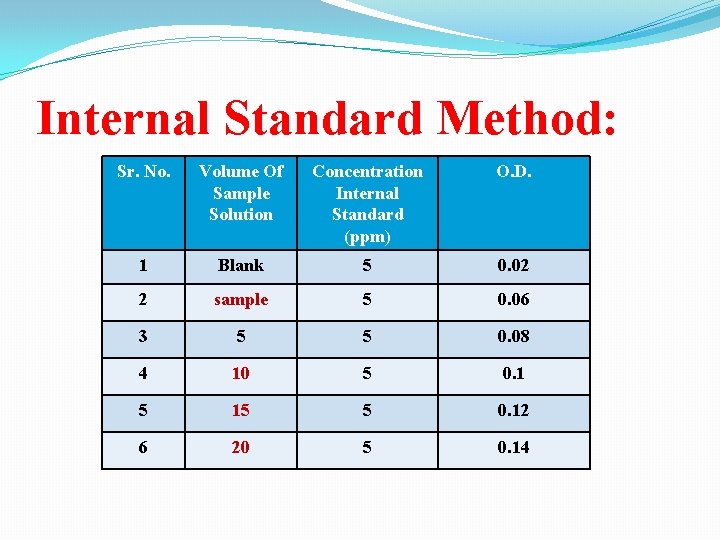
Internal Standard Method: Sr. No. Volume Of Sample Solution Concentration Internal Standard (ppm) O. D. 1 Blank 5 0. 02 2 sample 5 0. 06 3 5 5 0. 08 4 10 5 0. 1 5 15 5 0. 12 6 20 5 0. 14
Internal Standard Method Property of Sample Concentration of Unknown. Property of Internal standard Concentration----- 79
Types of Instruments Property to be measured
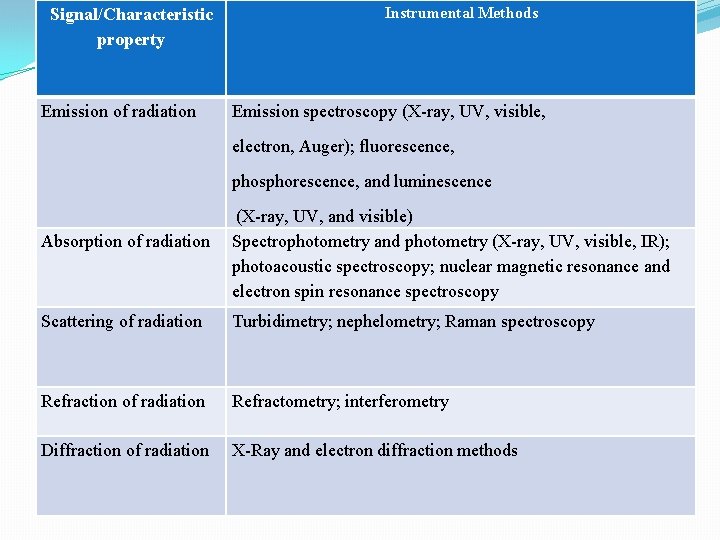
Signal/Characteristic property Emission of radiation Instrumental Methods Emission spectroscopy (X-ray, UV, visible, electron, Auger); fluorescence, phosphorescence, and luminescence Absorption of radiation (X-ray, UV, and visible) Spectrophotometry and photometry (X-ray, UV, visible, IR); photoacoustic spectroscopy; nuclear magnetic resonance and electron spin resonance spectroscopy Scattering of radiation Turbidimetry; nephelometry; Raman spectroscopy Refraction of radiation Refractometry; interferometry Diffraction of radiation X-Ray and electron diffraction methods
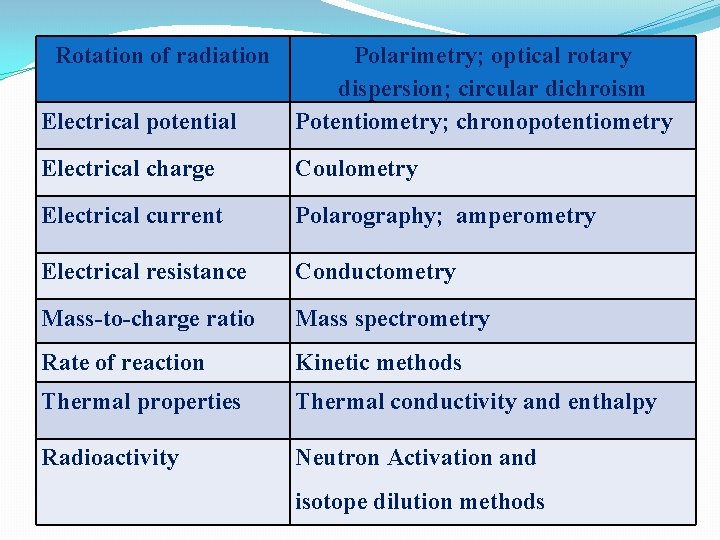
Rotation of radiation Electrical potential Polarimetry; optical rotary dispersion; circular dichroism Potentiometry; chronopotentiometry Electrical charge Coulometry Electrical current Polarography; amperometry Electrical resistance Conductometry Mass-to-charge ratio Mass spectrometry Rate of reaction Kinetic methods Thermal properties Thermal conductivity and enthalpy Radioactivity Neutron Activation and isotope dilution methods
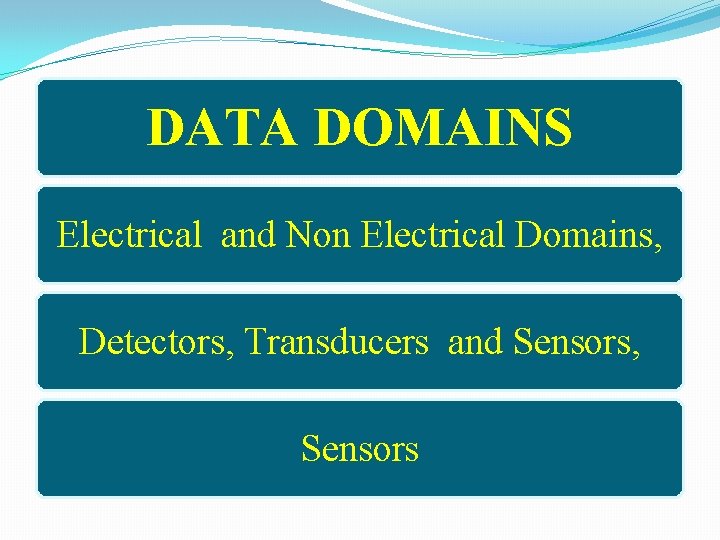
DATA DOMAINS Electrical and Non Electrical Domains, Detectors, Transducers and Sensors, Sensors
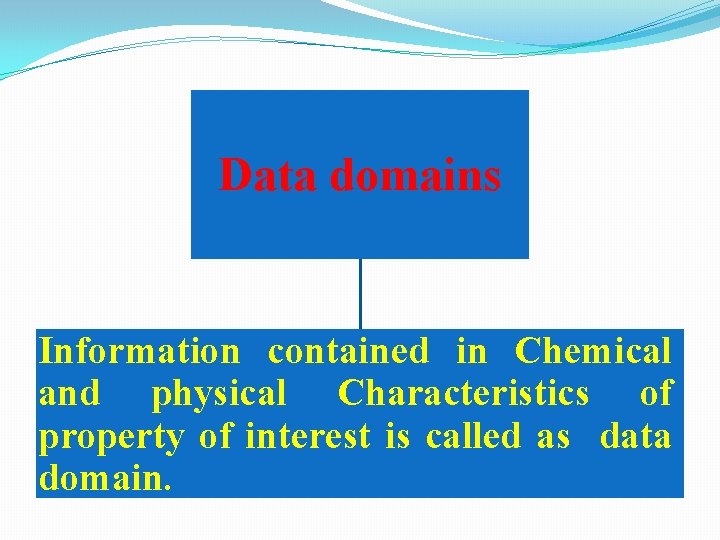
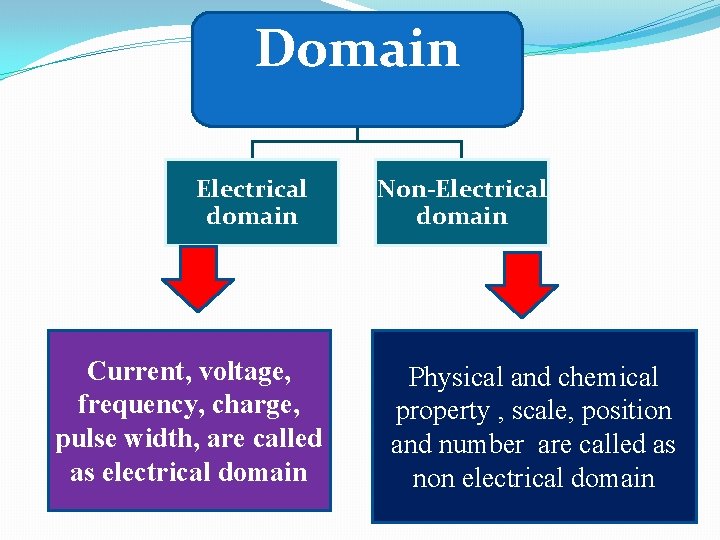
Data domains Information contained in Chemical and physical Characteristics of property of interest is called as data domain.
Domain Electrical domain Current, voltage, frequency, charge, pulse width, are called as electrical domain Non-Electrical domain Physical and chemical property , scale, position and number are called as non electrical domain
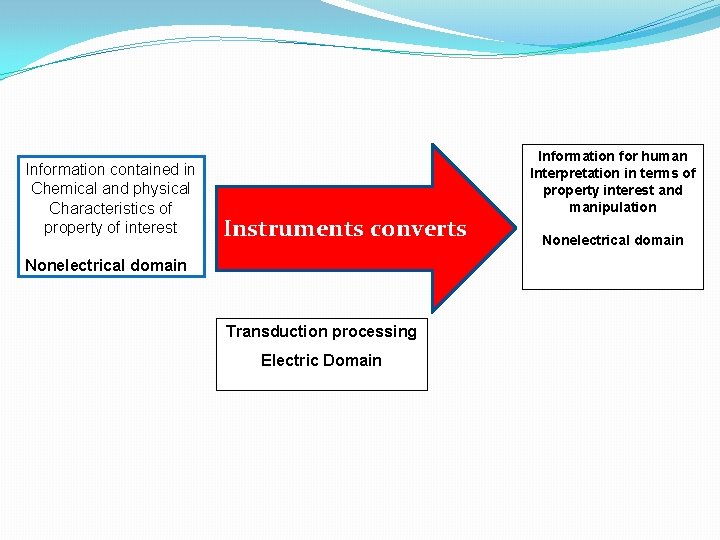
Information contained in Chemical and physical Characteristics of property of interest Instruments converts Nonelectrical domain Transduction processing Electric Domain Information for human Interpretation in terms of property interest and manipulation Nonelectrical domain
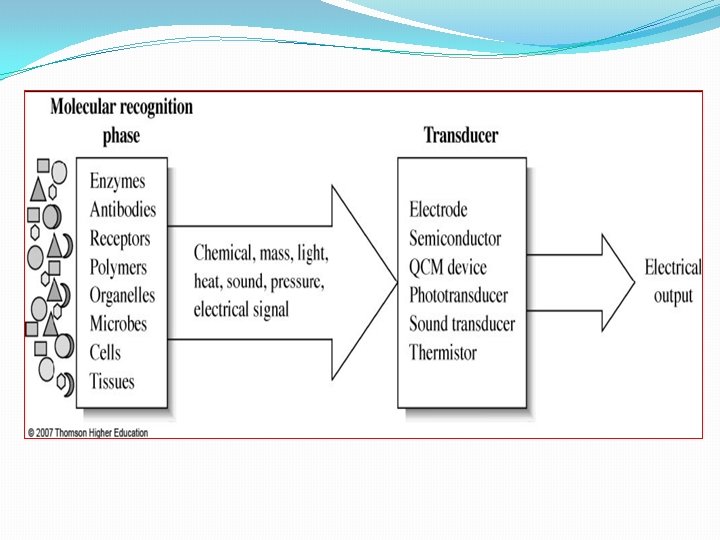
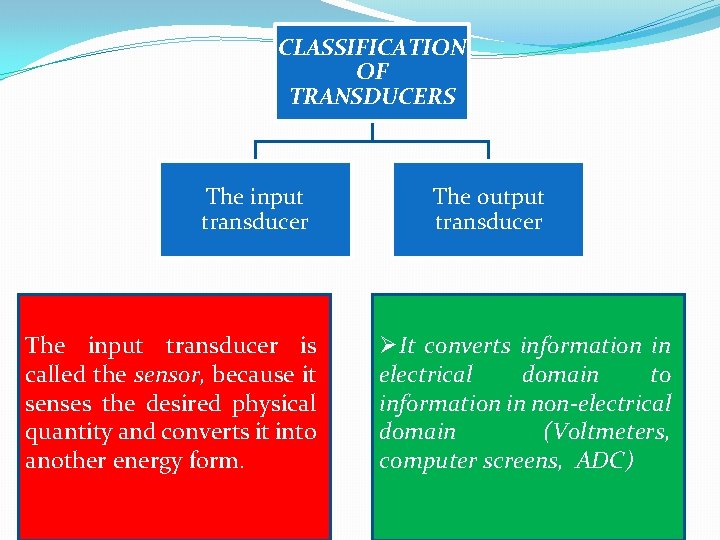
CLASSIFICATION OF TRANSDUCERS The input transducer is called the sensor, because it senses the desired physical quantity and converts it into another energy form. The output transducer ØIt converts information in electrical domain to information in non-electrical domain (Voltmeters, computer screens, ADC)
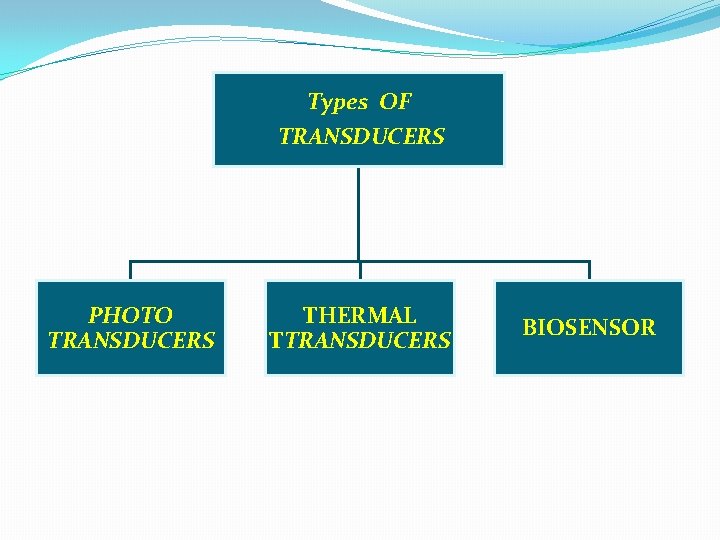
Types OF TRANSDUCERS PHOTO TRANSDUCERS THERMAL TTRANSDUCERS BIOSENSOR
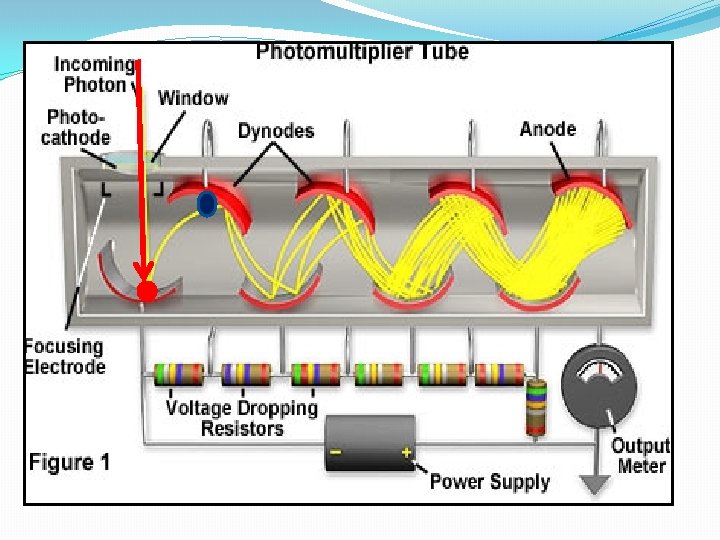
PHOTO TRANSDUCER Photo transducer is device that converts light energy into electrical energy are called Photo- transducer
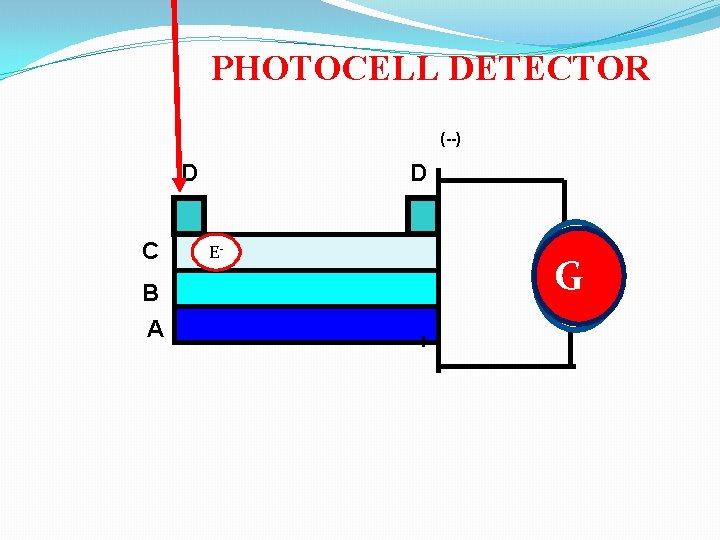
PHOTOCELL DETECTOR (--) D C B A D E- G G +
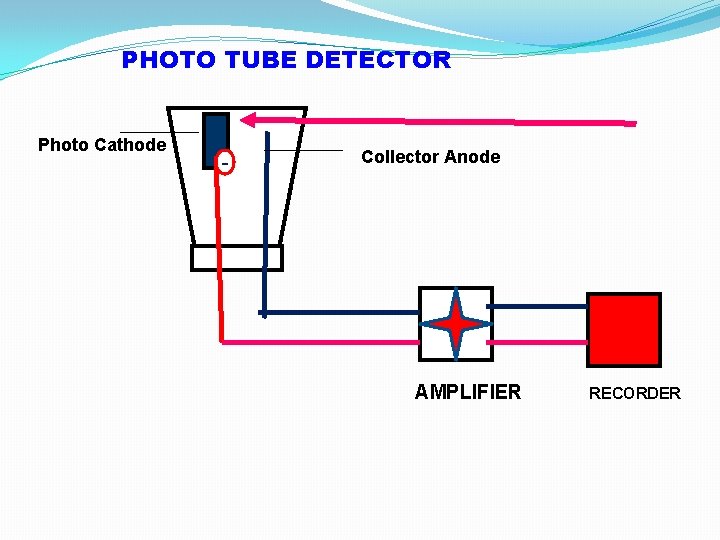
PHOTO TUBE DETECTOR Photo Cathode - Collector Anode AMPLIFIER RECORDER
A SENSOR • A sensor some time also called as detector that measures a physical quantity and converts it into signal which can read by an observer
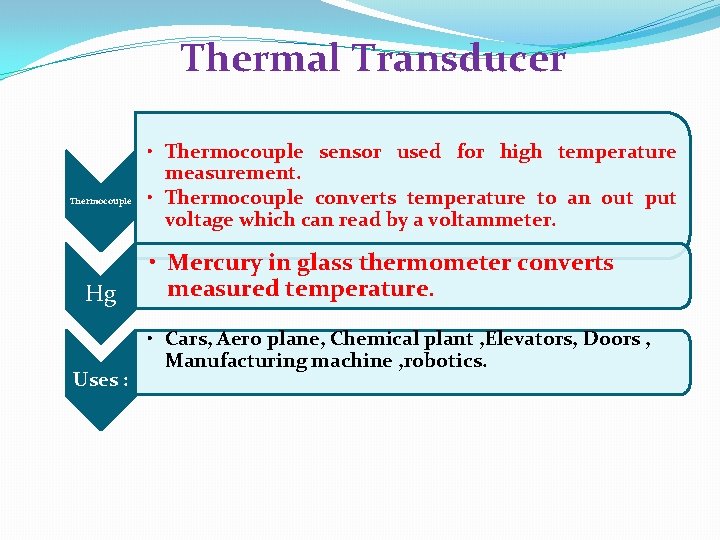
Thermal Transducer Thermocouple Hg Uses : • Thermocouple sensor used for high temperature measurement. • Thermocouple converts temperature to an out put voltage which can read by a voltammeter. • Mercury in glass thermometer converts measured temperature. • Cars, Aero plane, Chemical plant , Elevators, Doors , Manufacturing machine , robotics.
Biological Sensors: • A biosensor is an analytical device used for detection of analyte that combines a biological component with a physiochemical detector.
�Thermal Transducers Infrared radiation generally does not have sufficient energy �to produce a measurable current when using a photon transducer. A thermal transducer, therefore, is used for infrared spectroscopy. The absorption of infrared photons by a thermal transducer increases its temperature, changing one or more of its characteristic properties. The pneumatic transducer, for example, consists of a small tube filled with xenon gas equipped with an IR-transparent
SIGNAL PROCESSOR : • A device, such as a meter or computer, that displays the signal from the transducer in a form that is easily interpreted by the analyst.
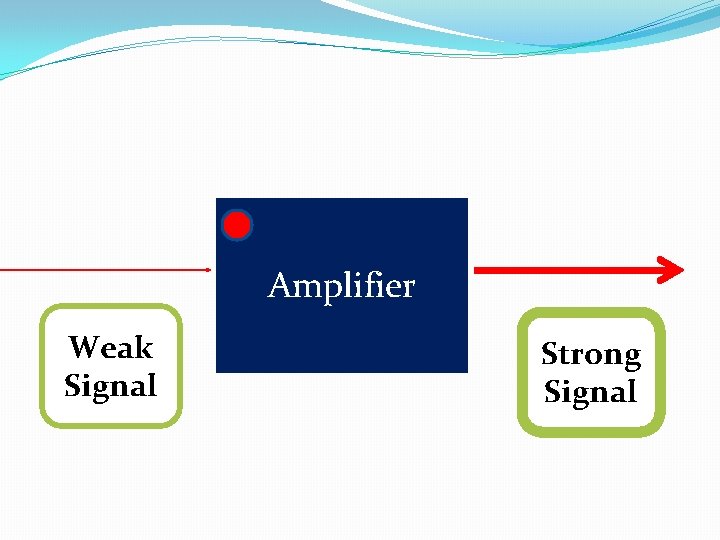
• An Electronic device that increases the power of signal Amplifier:
Amplifier Weak Signal Strong Signal
Selection of Analytical method: 1 • Concentration of the component. 2 • The complexity of the materials/presence of interfering material 3 • The probable concentration of the species of interest 4 • Degree of Accuracy 5 • Sensitivity and detection limit 6 • Duration of an analysis 7 • Speed , time and Cost of analysis 8 • Availability of equipments 9 • Skill person for handling the instrument ØAll the above factors should be taken into account combinedly, to select the proper method.
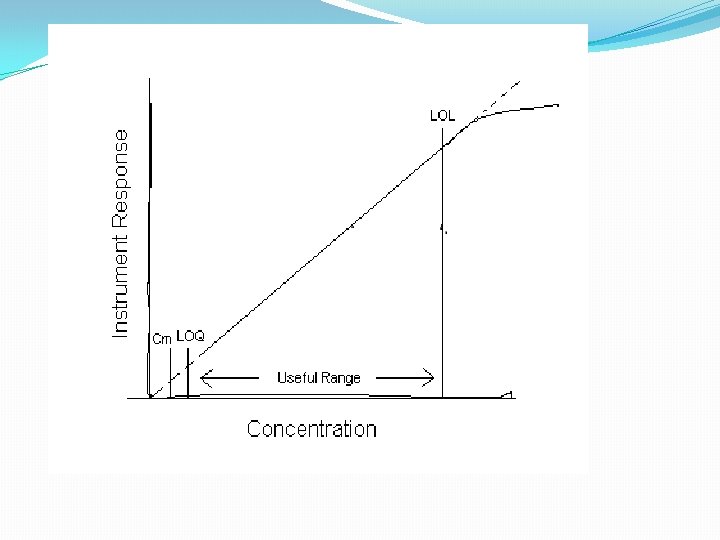
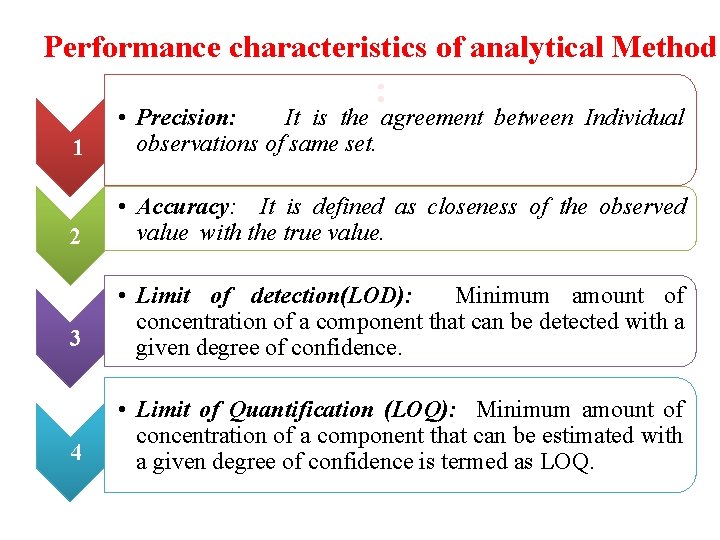
Performance characteristics of analytical Method : 1 • Precision: It is the agreement between Individual observations of same set. 2 • Accuracy: It is defined as closeness of the observed value with the true value. 3 • Limit of detection(LOD): Minimum amount of concentration of a component that can be detected with a given degree of confidence. 4 • Limit of Quantification (LOQ): Minimum amount of concentration of a component that can be estimated with a given degree of confidence is termed as LOQ.
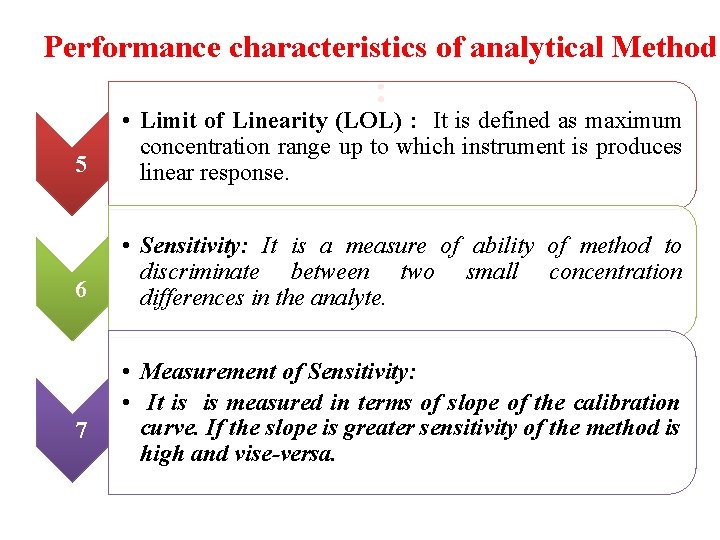
Performance characteristics of analytical Method : 5 • Limit of Linearity (LOL) : It is defined as maximum concentration range up to which instrument is produces linear response. 6 • Sensitivity: It is a measure of ability of method to discriminate between two small concentration differences in the analyte. 7 • Measurement of Sensitivity: • It is is measured in terms of slope of the calibration curve. If the slope is greater sensitivity of the method is high and vise-versa.
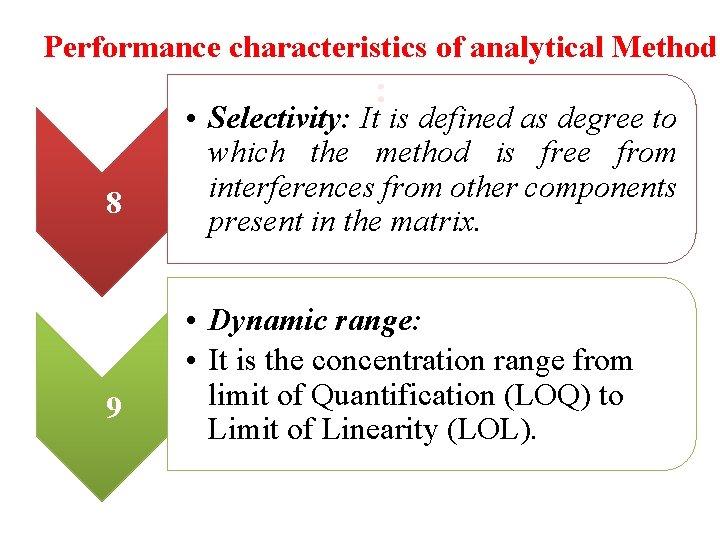
Performance characteristics of analytical Method : 8 9 • Selectivity: It is defined as degree to which the method is free from interferences from other components present in the matrix. • Dynamic range: • It is the concentration range from limit of Quantification (LOQ) to Limit of Linearity (LOL).
1. 1. 3 • Errors, determinate errors , and Indeterminate errors, types of determinate errors, takaling of errors.
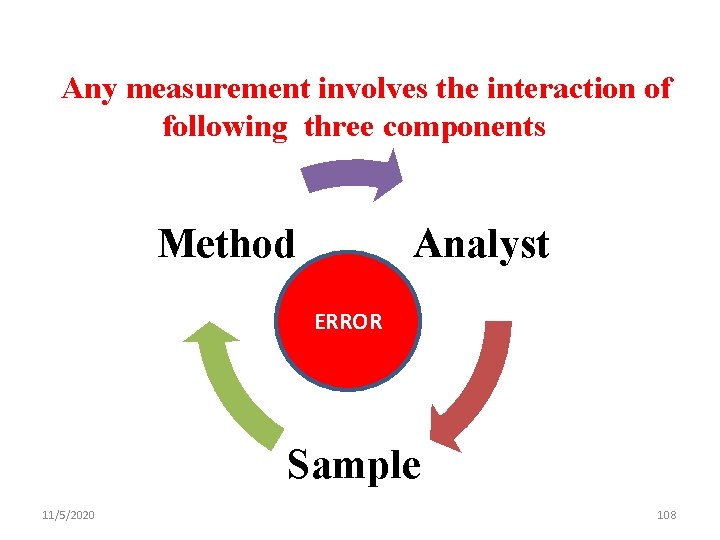
Any measurement involves the interaction of following three components Method Analyst ERROR Sample 11/5/2020 108
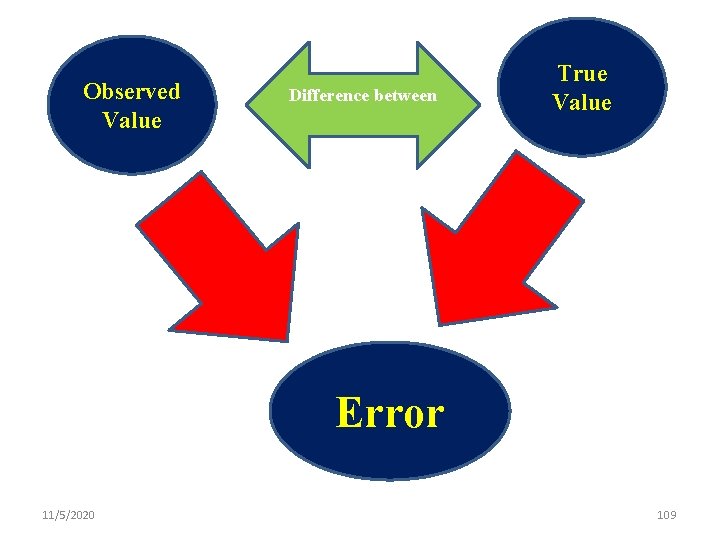
Observed Value Difference between True Value Error 11/5/2020 109
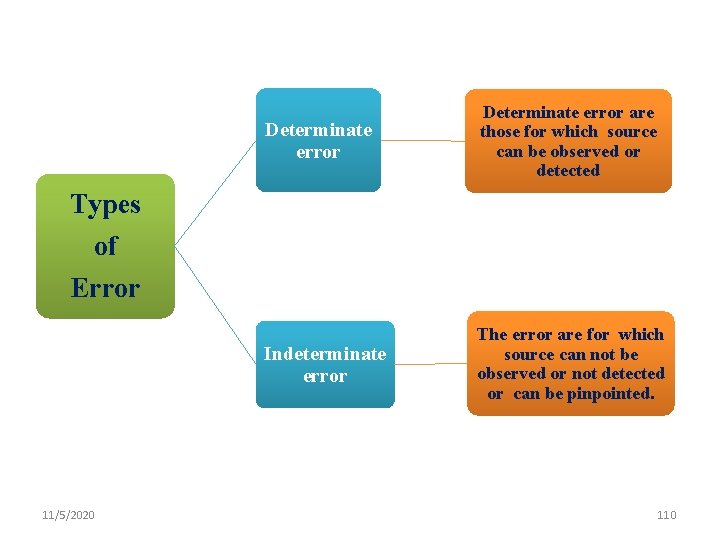
Determinate error are those for which source can be observed or detected Indeterminate error The error are for which source can not be observed or not detected or can be pinpointed. Types of Error 11/5/2020 110
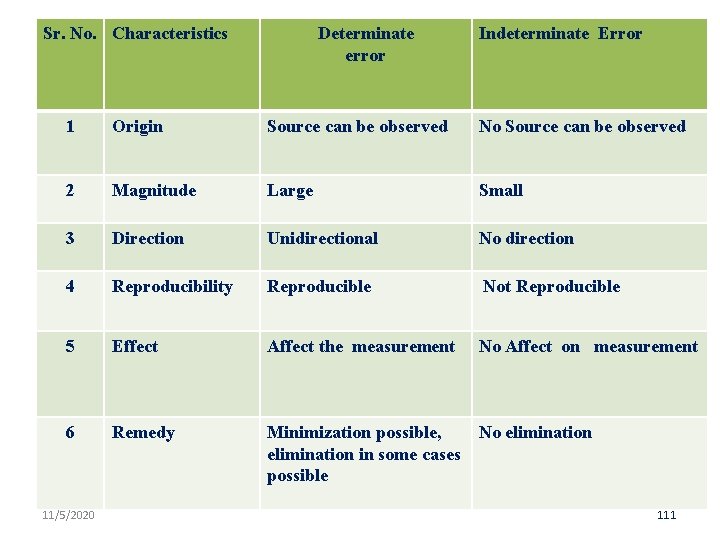
Sr. No. Characteristics Determinate error Indeterminate Error 1 Origin Source can be observed No Source can be observed 2 Magnitude Large Small 3 Direction Unidirectional No direction 4 Reproducibility Reproducible Not Reproducible 5 Effect Affect the measurement No Affect on measurement 6 Remedy Minimization possible, elimination in some cases possible No elimination 11/5/2020 111
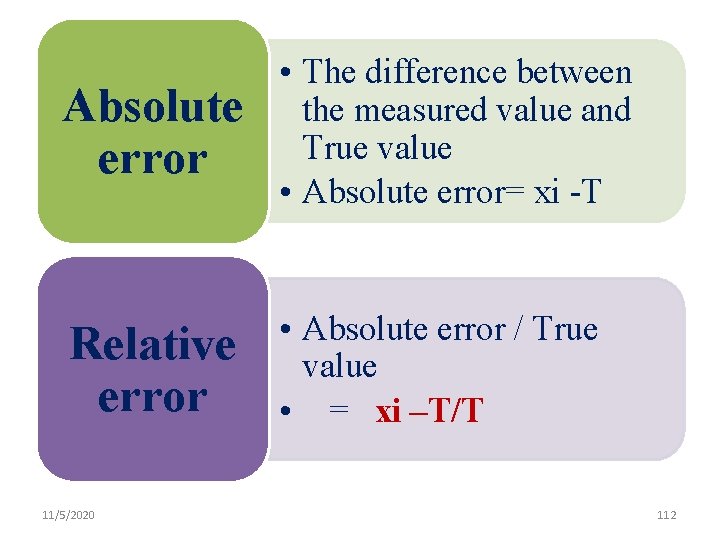
Absolute error • The difference between the measured value and True value • Absolute error= xi -T Relative error • Absolute error / True value • = xi –T/T 11/5/2020 112
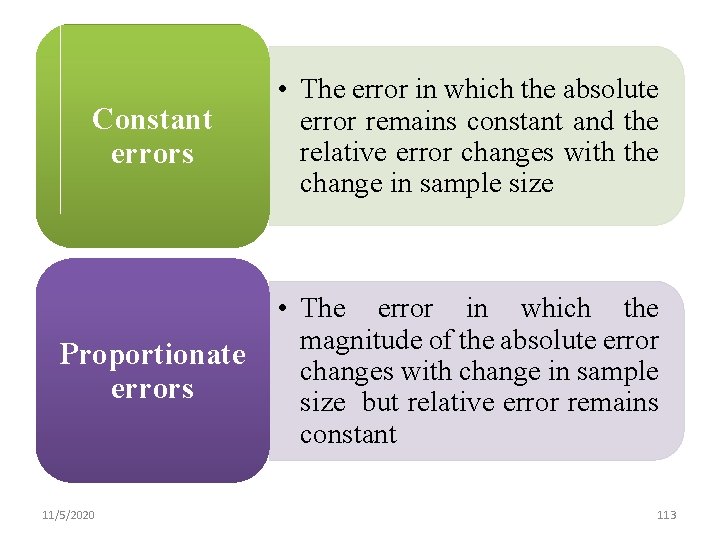
Constant errors • The error in which the absolute error remains constant and the relative error changes with the change in sample size Proportionate errors • The error in which the magnitude of the absolute error changes with change in sample size but relative error remains constant 11/5/2020 113
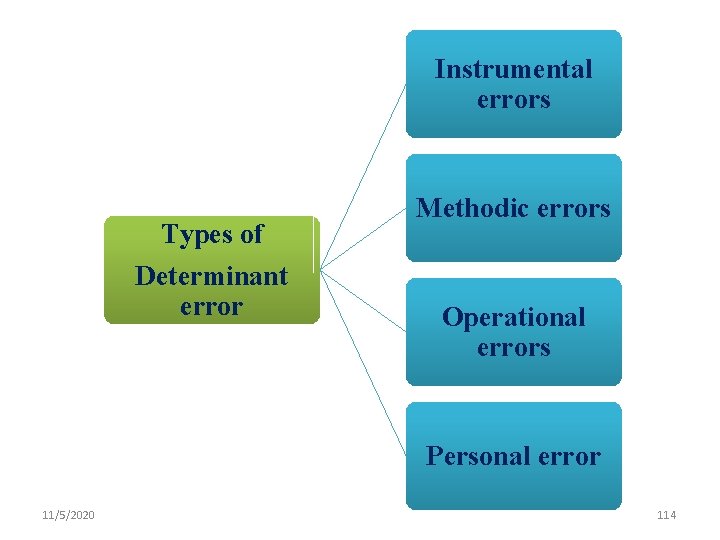
Instrumental errors Types of Determinant error Methodic errors Operational errors Personal error 11/5/2020 114
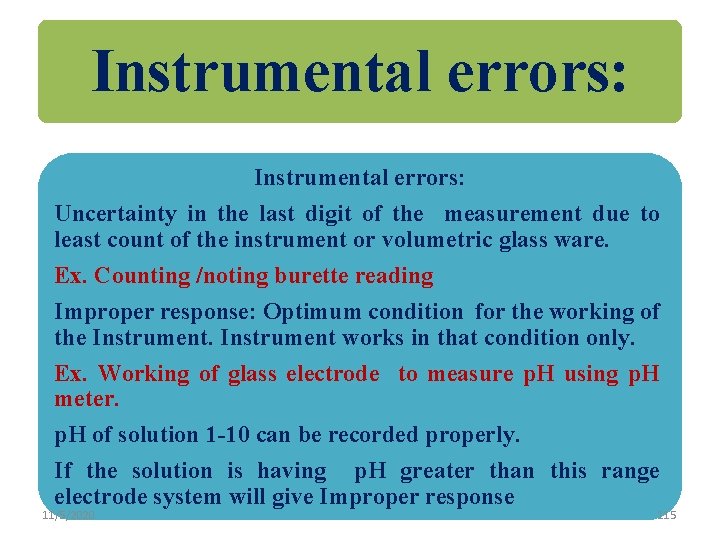
Instrumental errors: Uncertainty in the last digit of the measurement due to least count of the instrument or volumetric glass ware. Ex. Counting /noting burette reading Improper response: Optimum condition for the working of the Instrument works in that condition only. Ex. Working of glass electrode to measure p. H using p. H meter. p. H of solution 1 -10 can be recorded properly. If the solution is having p. H greater than this range electrode system will give Improper response 11/5/2020 115
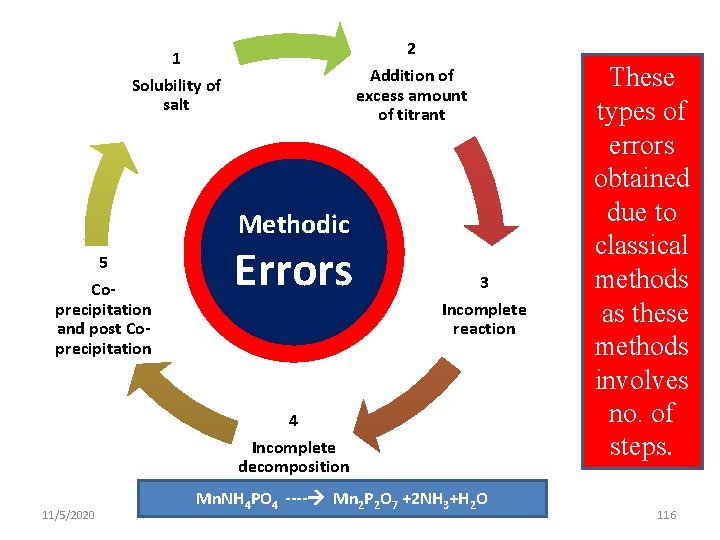
2 Addition of excess amount of titrant 1 Solubility of salt Methodic 5 Coprecipitation and post Coprecipitation Errors 3 Incomplete reaction 4 Incomplete decomposition 11/5/2020 Mn. NH 4 PO 4 ---- Mn 2 P 2 O 7 +2 NH 3+H 2 O These types of errors obtained due to classical methods as these methods involves no. of steps. 116
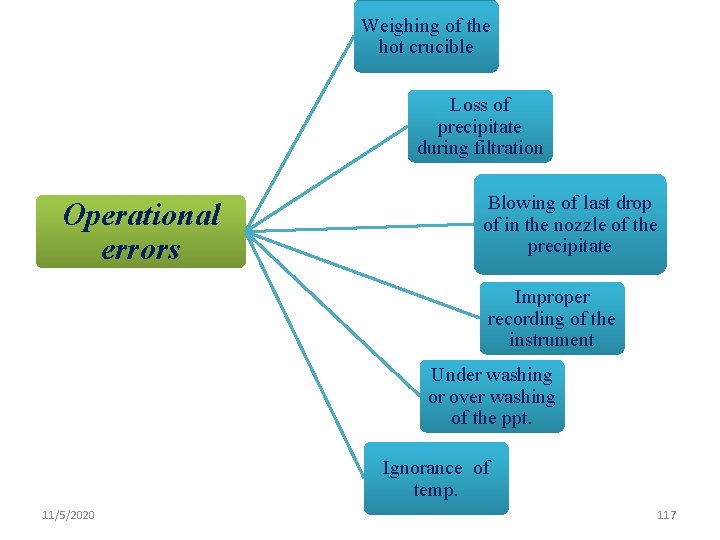
Weighing of the hot crucible Loss of precipitate during filtration Operational errors Blowing of last drop of in the nozzle of the precipitate Improper recording of the instrument Under washing or over washing of the ppt. Ignorance of temp. 11/5/2020 117
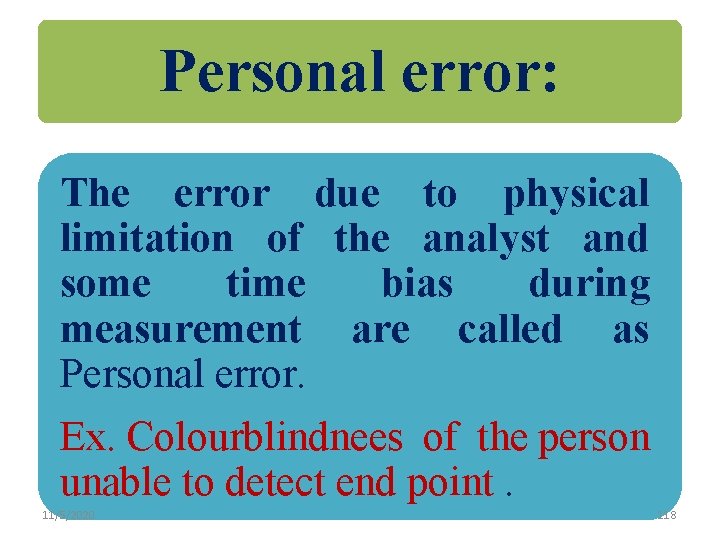
Personal error: The error due to physical limitation of the analyst and some time bias during measurement are called as Personal error. Ex. Colourblindnees of the person unable to detect end point. 11/5/2020 118
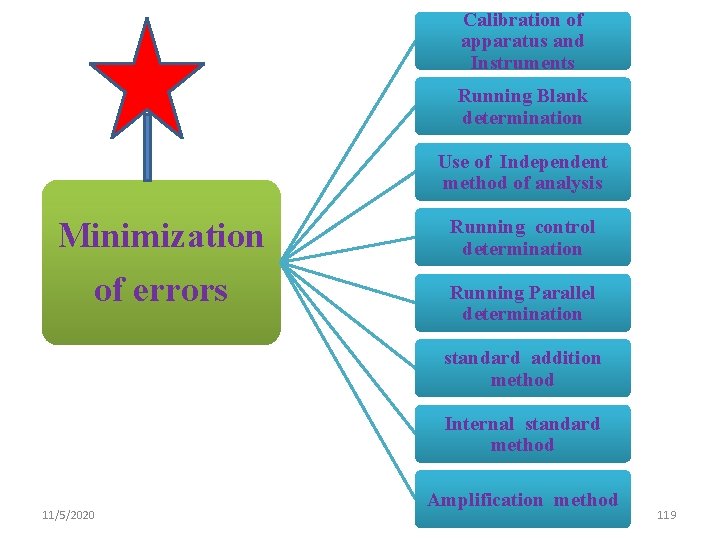
Calibration of apparatus and Instruments Running Blank determination Use of Independent method of analysis Minimization of errors Running control determination Running Parallel determination standard addition method Internal standard method 11/5/2020 Amplification method 119
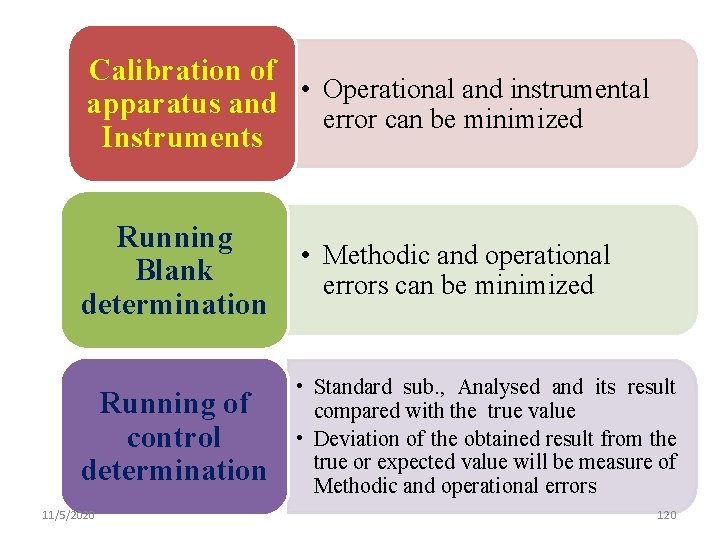
Calibration of • Operational and instrumental apparatus and error can be minimized Instruments Running Blank determination • Methodic and operational errors can be minimized Running of control determination • Standard sub. , Analysed and its result compared with the true value • Deviation of the obtained result from the true or expected value will be measure of Methodic and operational errors 11/5/2020 120
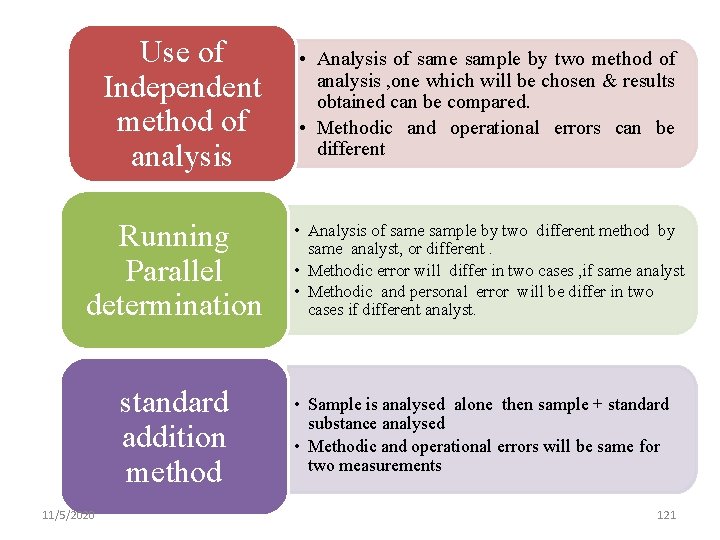
Use of Independent method of analysis Running Parallel determination standard addition method 11/5/2020 • Analysis of same sample by two method of analysis , one which will be chosen & results obtained can be compared. • Methodic and operational errors can be different • Analysis of same sample by two different method by same analyst, or different. • Methodic error will differ in two cases , if same analyst • Methodic and personal error will be differ in two cases if different analyst. • Sample is analysed alone then sample + standard substance analysed • Methodic and operational errors will be same for two measurements 121
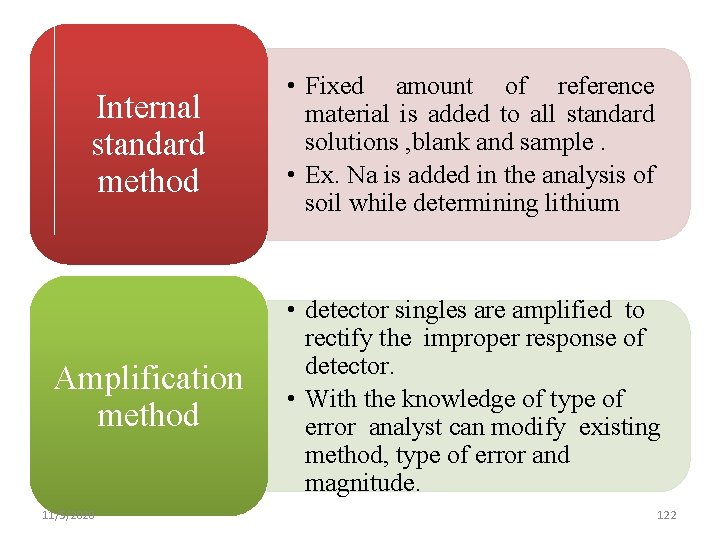
Internal standard method • Fixed amount of reference material is added to all standard solutions , blank and sample. • Ex. Na is added in the analysis of soil while determining lithium Amplification method • detector singles are amplified to rectify the improper response of detector. • With the knowledge of type of error analyst can modify existing method, type of error and magnitude. 11/5/2020 122
1. 1. 4 • Quantitative methods of analysis
1. Calibration Curve method: Quantitative Analysis 2. Method of Standard Addition 3. Internal Standard Method:
1. 1. 4 Quantitative Analysis: �Calibration Curve method: �A calibration curve is used to determine the unknown concentration of an element in a solution. The instrument is calibrated using several solutions of known concentrations. The property to be measured of each known solution is measured and then a calibration curve of property measured v/s concentration is plotted. �The property of a sample solution is measured. The unknown concentration of the element is then calculated from the calibration curve �
Calibration Curve method Sr. No. Concentration of KMn. O 4 O. D. 1 2 3 4 5 6 5 10 15 20 25 Unknown 0. 02 0. 04 0. 06 0. 08 0. 1 0. 05
Calibration Curve method: Measurable Property is directly proportional to concentration Measurable Property
Method of Standard Addition: �In this method the property of unknown (X) is first find out against blank. Then a series of standards having definite amount of unknown (X) plus varying amount of standard are prepared and diluted to same volume in each case. Their property is then measured. A graph of measured property against concentrations of standard (S) gives a linear curve. The concentration of the unknown can be determined by extrapolation of line which cuts to X axis.
Method of Standard Addition Sr. No. Volume Of Concentrati Sample on of Solution KMn. O 4 O. D. 1 2 5 5 0. 02 0. 06 3 5 10 0. 08 4 5 15 0. 1 5 5 20 0. 12 6 5 25 0. 14
Absorbance--- Standard addition method Property . . X . 2 + X . . S 3 S + X 4 S + X S X+ Concentration----- Concentration of Unknown. 130
Internal Standard Method: When Internal Standard Method is useful • It is useful for analysis when quantity of sample analyzed or the instruments responses varies slightly from run to run. �Such response are difficult to control �When sample loss occur during sample preparation
Internal Standard Method: �A series of standard solution containing the same elements as that present in sample solution is prepared. A fixed quantity of suitable internal standard is then added to each of standard solutions, blank and sample solutions alike. The measurable property of each of above standard solutions and sample solutions are measured. The measurable property for each of above standard solution (Is) & (Ii) and sample solution (Ix&Ii) are measured at different wavelength one corresponds to element and other corresponds to the internal standard. These measurements are made against blank. The ratio of measured property of the standard solutions to that of internal standard (Is/Ii) are plotted against the concentration of standard solutions. This gives a straight line from this curve concentration of sample solution can be read by finding where the ratio (Ix/Ii) falls on concentration scale.
Internal Standard Method: Sr. No. Volume Of Sample Solution Concentration Internal Standard (ppm) O. D. 1 Blank 5 0. 02 2 sample 5 0. 06 3 5 5 0. 08 4 10 5 0. 1 5 15 5 0. 12 6 20 5 0. 14
Internal Standard Method Property of Sample Concentration of Unknown. Property of Internal standard Concentration----- 134
� Thank you