Mitglied der HelmholtzGemeinschaft Principles and Practice of Application




- Slides: 121

Mitglied der Helmholtz-Gemeinschaft Principles and Practice of Application Performance Measurement and Analysis on Parallel Systems Lecture 2: Practical Performance Analysis and Tuning 2012 | Bernd Mohr Institute for Advanced Simulation (IAS) Jülich Supercomputing Centre (JSC)

CONTENT § § Fall-back • Simple timers • Hardware counter measurements Overview of some performance tools Practical Performance Analysis and Tuning Challenges and open problems in performance optimization • Heterogeneous systems • Automatic performance analysis: KOJAK/Scalasca • Beyond execution time and flops • Extremely large HPC systems • Tool integration

Fall-back: Home-grown Performance Tools n If performance analysis and tuning tools are ¨ not available ¨ too complex and complicated it is still possible to do some simple measurements n Time Measurements ¨ gettimeofday( ) ¨ clock_gettime( ) ¨. . . Hardware Performance Counter Measurements ¨ PAPI n II-3

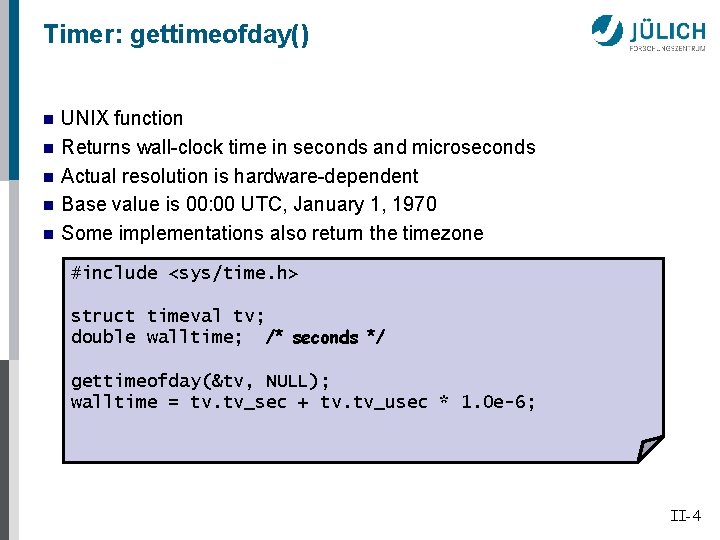
Timer: gettimeofday() n n n UNIX function Returns wall-clock time in seconds and microseconds Actual resolution is hardware-dependent Base value is 00: 00 UTC, January 1, 1970 Some implementations also return the timezone #include <sys/time. h> struct timeval tv; double walltime; /* seconds */ gettimeofday(&tv, NULL); walltime = tv. tv_sec + tv. tv_usec * 1. 0 e-6; II-4

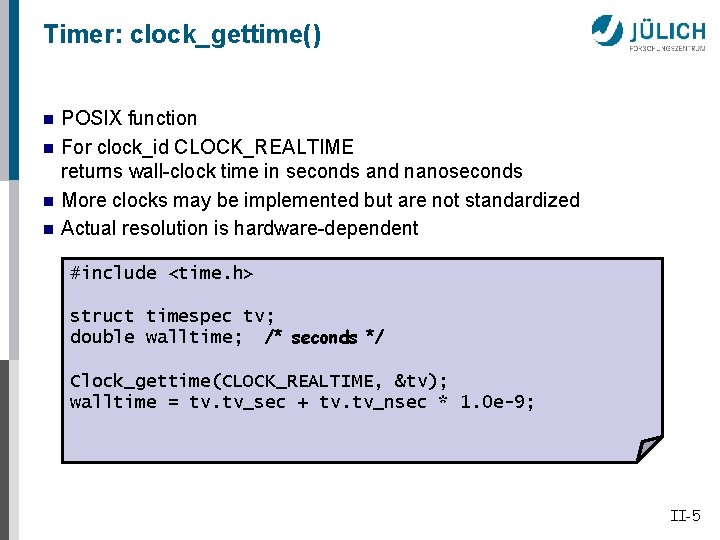
Timer: clock_gettime() n n POSIX function For clock_id CLOCK_REALTIME returns wall-clock time in seconds and nanoseconds More clocks may be implemented but are not standardized Actual resolution is hardware-dependent #include <time. h> struct timespec tv; double walltime; /* seconds */ Clock_gettime(CLOCK_REALTIME, &tv); walltime = tv. tv_sec + tv. tv_nsec * 1. 0 e-9; II-5

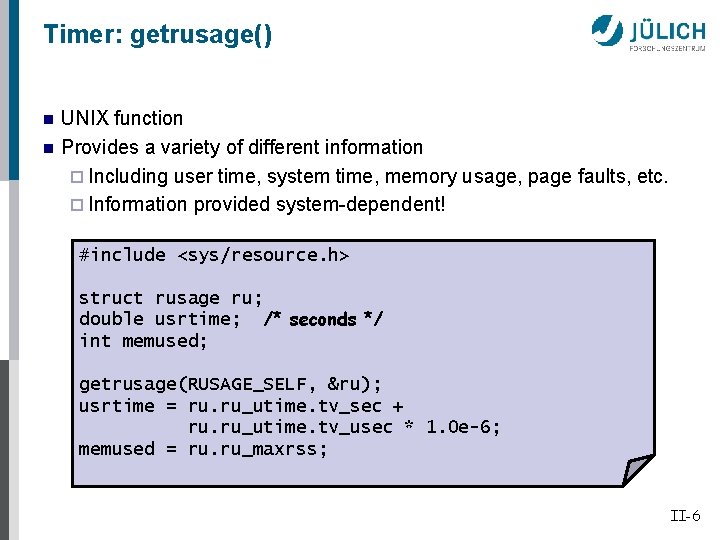
Timer: getrusage() n n UNIX function Provides a variety of different information ¨ Including user time, system time, memory usage, page faults, etc. ¨ Information provided system-dependent! #include <sys/resource. h> struct rusage ru; double usrtime; /* seconds */ int memused; getrusage(RUSAGE_SELF, &ru); usrtime = ru. ru_utime. tv_sec + ru. ru_utime. tv_usec * 1. 0 e-6; memused = ru. ru_maxrss; II-6

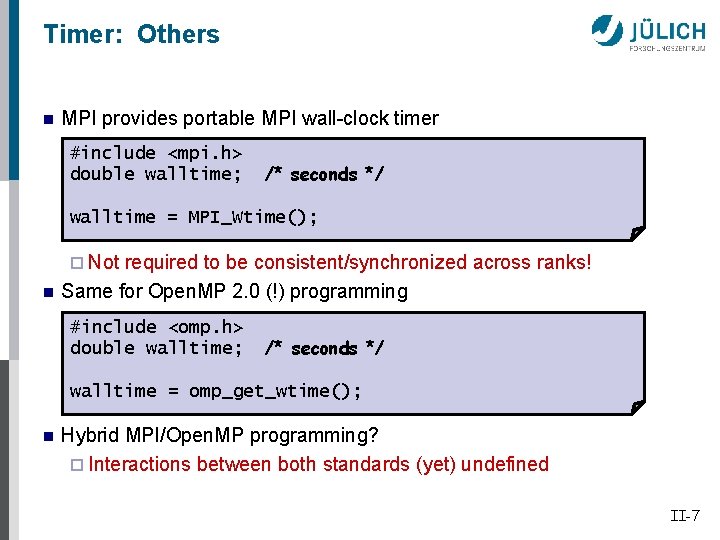
Timer: Others n MPI provides portable MPI wall-clock timer #include <mpi. h> double walltime; /* seconds */ walltime = MPI_Wtime(); ¨ Not n required to be consistent/synchronized across ranks! Same for Open. MP 2. 0 (!) programming #include <omp. h> double walltime; /* seconds */ walltime = omp_get_wtime(); n Hybrid MPI/Open. MP programming? ¨ Interactions between both standards (yet) undefined II-7

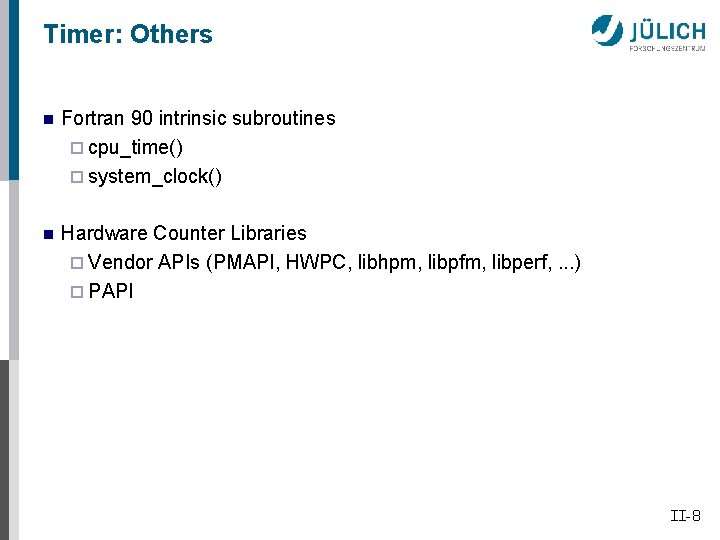
Timer: Others n Fortran 90 intrinsic subroutines ¨ cpu_time() ¨ system_clock() n Hardware Counter Libraries ¨ Vendor APIs (PMAPI, HWPC, libhpm, libpfm, libperf, . . . ) ¨ PAPI II-8

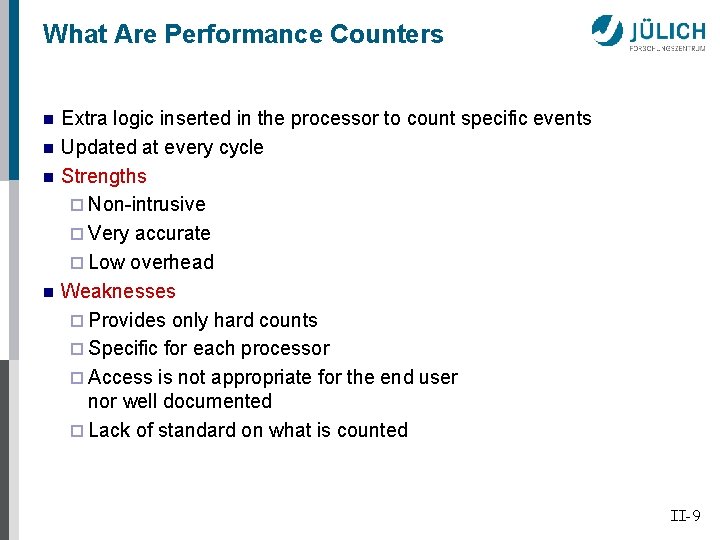
What Are Performance Counters n n Extra logic inserted in the processor to count specific events Updated at every cycle Strengths ¨ Non-intrusive ¨ Very accurate ¨ Low overhead Weaknesses ¨ Provides only hard counts ¨ Specific for each processor ¨ Access is not appropriate for the end user nor well documented ¨ Lack of standard on what is counted II-9

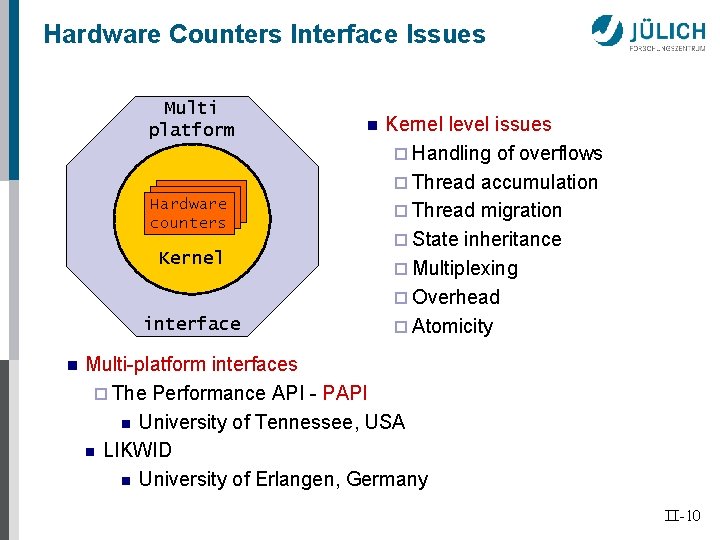
Hardware Counters Interface Issues Multi platform Hardware counters Kernel interface n n Kernel level issues ¨ Handling of overflows ¨ Thread accumulation ¨ Thread migration ¨ State inheritance ¨ Multiplexing ¨ Overhead ¨ Atomicity Multi-platform interfaces ¨ The Performance API - PAPI n University of Tennessee, USA n LIKWID n University of Erlangen, Germany II-10

Hardware Measurement n Typical measured events account for: ¨ Functional units status n Float point operations n Fixed point operations n Load/stores ¨ Access to memory hierarchy ¨ Cache coherence protocol events ¨ Cycles and instructions counts ¨ Speculative execution information n Instructions dispatched n Branches mispredicted II-11

Hardware Metrics n Typical Hardware Counter ¨ Cycles / Instructions ¨ Floating point instructions ¨ Integer instructions ¨ Load/stores ¨ Cache misses ¨ TLB misses n Derived metrics allow users to correlate the behavior of the application to one or more of the hardware components One can define threshold values acceptable for metrics and take actions regarding program optimization when values are below/above threshold n n Useful derived metrics ¨ IPC - instructions per cycle ¨ Float point rate ¨ Computation intensity ¨ Instructions per load/store ¨ Load/stores per cache miss ¨ Cache hit rate ¨ Loads per load miss ¨ Loads per TLB miss II-12

Accuracy Issues n Granularity of the measured code ¨ If not sufficiently large enough, overhead of the counter interfaces may dominate n Pay attention to what is not measured: ¨ Out-of-order processors ¨ Sometimes speculation is included ¨ Lack of standard on what is counted n Microbenchmarks can help determine accuracy of the hardware counters II-13

Hardware Counters Access on Linux had not defined an out-of-the-box interface to access the hardware counters! ¨ Linux Performance Monitoring Counters Driver (Perf. Ctr) by Mikael Pettersson from Uppsala X 86 + X 86 -64 n Needs kernel patching! ¨ http: //user. it. uu. se/~mikpe/linux/perfctr/ ¨ Perfmon n n by Stephane Eranian from HP – IA 64 It was being evaluated to be added to Linux ¨ http: //www. hpl. hp. com/research/linux/perfmon/ Linux 2. 6. 31 ¨ Performance Counter subsystem provides an abstraction of special performance counter hardware registers II-14

Utilities to Count Hardware Events n There are utilities that start a program and at the end of the execution provide overall event counts ¨ hpmcount (IBM) ¨ Cray. Pat (Cray) ¨ pfmon from HP (part of Perfmon for AI 64) ¨ psrun (NCSA) ¨ cputrack, har (Sun) ¨ perfex, ssrun (SGI) ¨ perf (Linux 2. 6. 31) II-15

Hardware Counters: PAPI n Parallel Tools Consortium (PTools) sponsored project n Performance Application Programming Interface Two interfaces to the underlying counter hardware: ¨ The high-level interface simply provides the ability to start, stop and read the counters for a specified list of events ¨ The low-level interface manages hardware events in user defined groups called Event. Sets Timers and system information C and Fortran bindings Experimental PAPI interface to performance counters support in the linux 2. 6. 31 kernel http: //icl. cs. utk. edu/papi/ n n n II-16

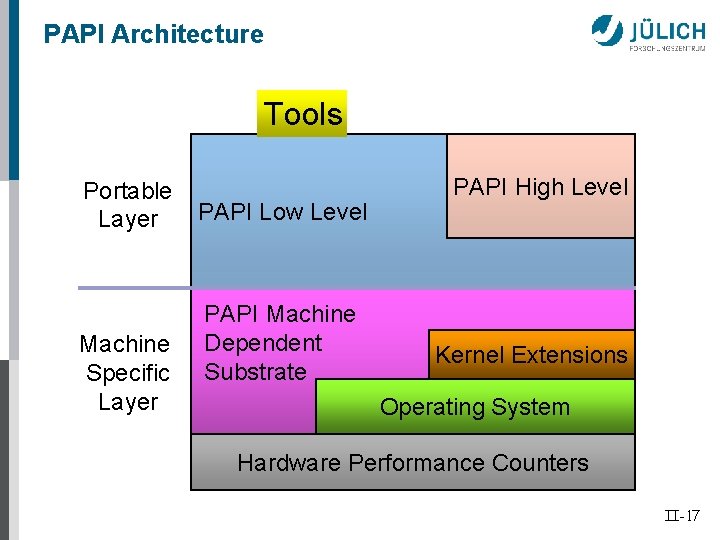
PAPI Architecture Tools Portable Layer Machine Specific Layer PAPI Low Level PAPI Machine Dependent Substrate PAPI High Level Kernel Extensions Operating System Hardware Performance Counters II-17

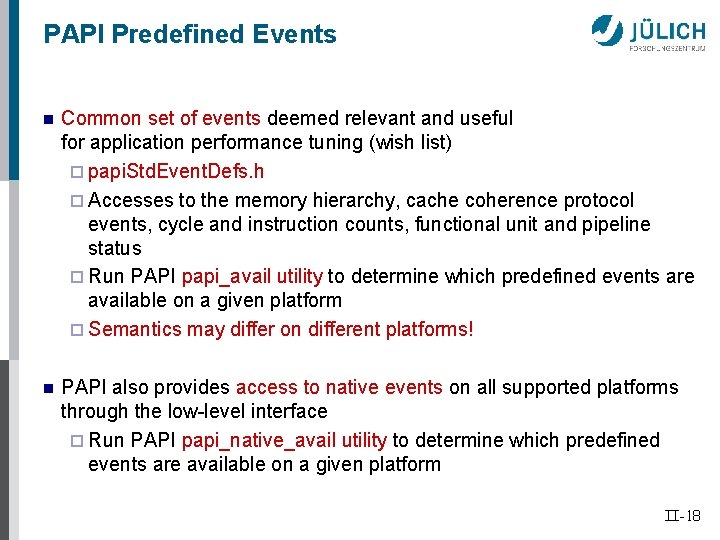
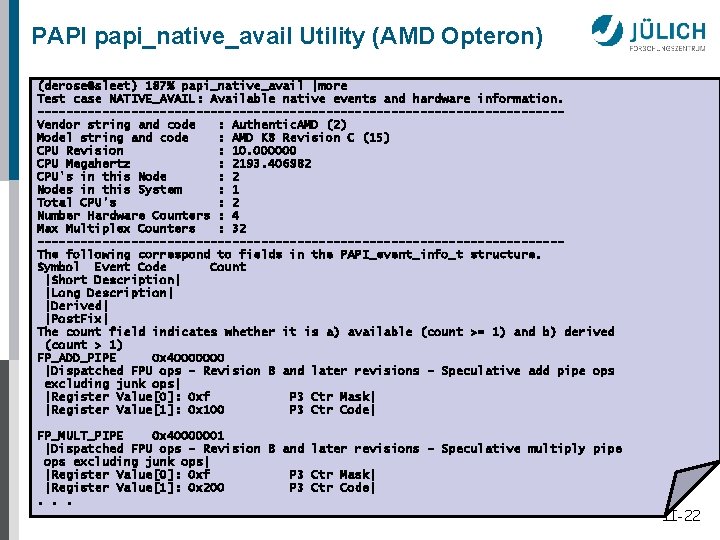
PAPI Predefined Events n Common set of events deemed relevant and useful for application performance tuning (wish list) ¨ papi. Std. Event. Defs. h ¨ Accesses to the memory hierarchy, cache coherence protocol events, cycle and instruction counts, functional unit and pipeline status ¨ Run PAPI papi_avail utility to determine which predefined events are available on a given platform ¨ Semantics may differ on different platforms! n PAPI also provides access to native events on all supported platforms through the low-level interface ¨ Run PAPI papi_native_avail utility to determine which predefined events are available on a given platform II-18

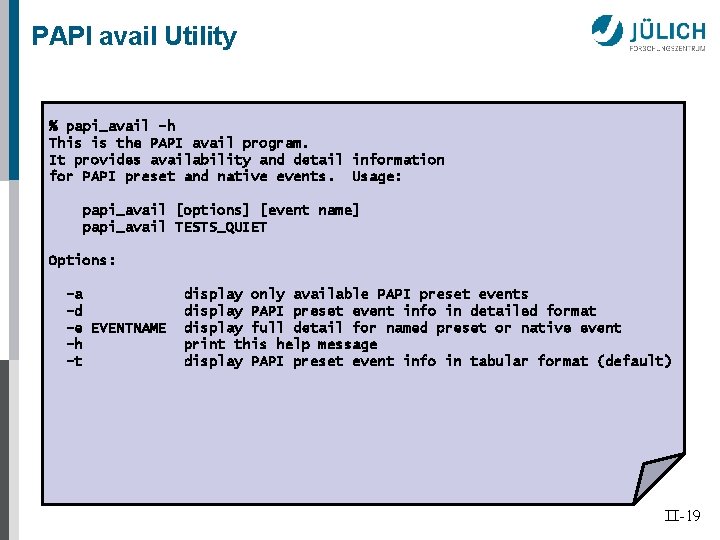
PAPI avail Utility % papi_avail -h This is the PAPI avail program. It provides availability and detail information for PAPI preset and native events. Usage: papi_avail [options] [event name] papi_avail TESTS_QUIET Options: -a -d -e EVENTNAME -h -t display only available PAPI preset events display PAPI preset event info in detailed format display full detail for named preset or native event print this help message display PAPI preset event info in tabular format (default) II-19

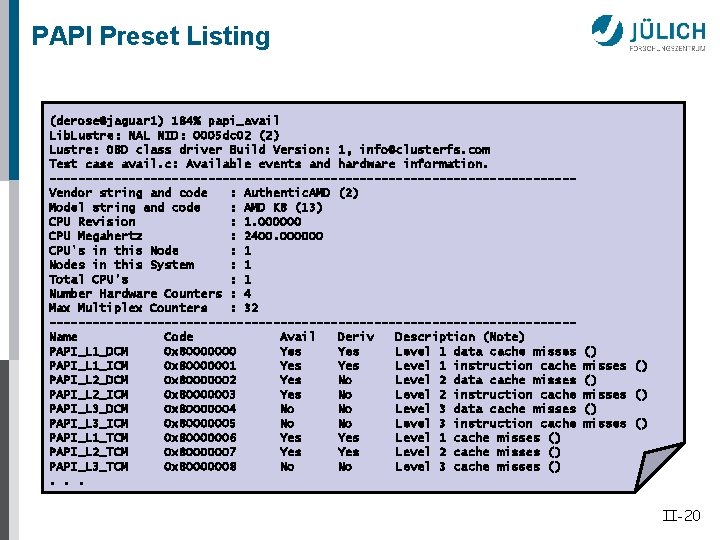
PAPI Preset Listing (derose@jaguar 1) 184% papi_avail Lib. Lustre: NAL NID: 0005 dc 02 (2) Lustre: OBD class driver Build Version: 1, info@clusterfs. com Test case avail. c: Available events and hardware information. ------------------------------------Vendor string and code : Authentic. AMD (2) Model string and code : AMD K 8 (13) CPU Revision : 1. 000000 CPU Megahertz : 2400. 000000 CPU's in this Node : 1 Nodes in this System : 1 Total CPU's : 1 Number Hardware Counters : 4 Max Multiplex Counters : 32 ------------------------------------Name Code Avail Deriv Description (Note) PAPI_L 1_DCM 0 x 80000000 Yes Level 1 data cache misses PAPI_L 1_ICM 0 x 80000001 Yes Level 1 instruction cache PAPI_L 2_DCM 0 x 80000002 Yes No Level 2 data cache misses PAPI_L 2_ICM 0 x 80000003 Yes No Level 2 instruction cache PAPI_L 3_DCM 0 x 80000004 No No Level 3 data cache misses PAPI_L 3_ICM 0 x 80000005 No No Level 3 instruction cache PAPI_L 1_TCM 0 x 80000006 Yes Level 1 cache misses () PAPI_L 2_TCM 0 x 80000007 Yes Level 2 cache misses () PAPI_L 3_TCM 0 x 80000008 No No Level 3 cache misses (). . . () misses () II-20

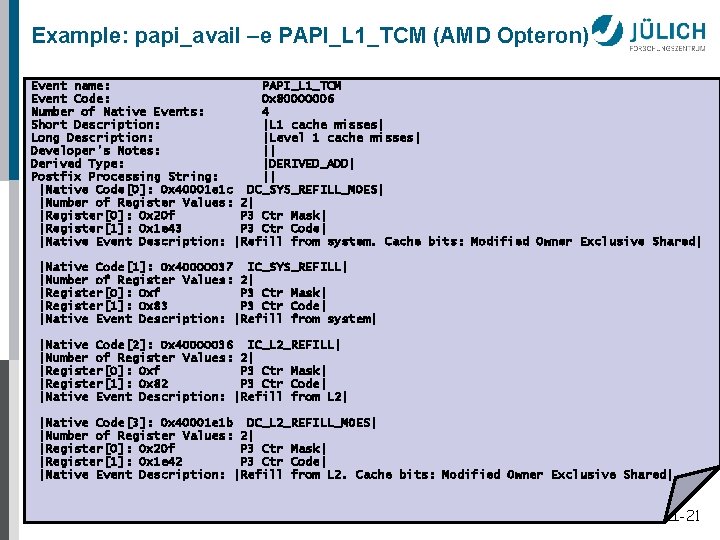
Example: papi_avail –e PAPI_L 1_TCM (AMD Opteron) Event name: PAPI_L 1_TCM Event Code: 0 x 80000006 Number of Native Events: 4 Short Description: |L 1 cache misses| Long Description: |Level 1 cache misses| Developer's Notes: || Derived Type: |DERIVED_ADD| Postfix Processing String: || |Native Code[0]: 0 x 40001 e 1 c DC_SYS_REFILL_MOES| |Number of Register Values: 2| |Register[0]: 0 x 20 f P 3 Ctr Mask| |Register[1]: 0 x 1 e 43 P 3 Ctr Code| |Native Event Description: |Refill from system. Cache bits: Modified Owner Exclusive Shared| |Native Code[1]: 0 x 40000037 IC_SYS_REFILL| |Number of Register Values: 2| |Register[0]: 0 xf P 3 Ctr Mask| |Register[1]: 0 x 83 P 3 Ctr Code| |Native Event Description: |Refill from system| |Native Code[2]: 0 x 40000036 IC_L 2_REFILL| |Number of Register Values: 2| |Register[0]: 0 xf P 3 Ctr Mask| |Register[1]: 0 x 82 P 3 Ctr Code| |Native Event Description: |Refill from L 2| |Native Code[3]: 0 x 40001 e 1 b DC_L 2_REFILL_MOES| |Number of Register Values: 2| |Register[0]: 0 x 20 f P 3 Ctr Mask| |Register[1]: 0 x 1 e 42 P 3 Ctr Code| |Native Event Description: |Refill from L 2. Cache bits: Modified Owner Exclusive Shared| II-21

PAPI papi_native_avail Utility (AMD Opteron) (derose@sleet) 187% papi_native_avail |more Test case NATIVE_AVAIL: Available native events and hardware information. ------------------------------------Vendor string and code : Authentic. AMD (2) Model string and code : AMD K 8 Revision C (15) CPU Revision : 10. 000000 CPU Megahertz : 2193. 406982 CPU's in this Node : 2 Nodes in this System : 1 Total CPU's : 2 Number Hardware Counters : 4 Max Multiplex Counters : 32 ------------------------------------The following correspond to fields in the PAPI_event_info_t structure. Symbol Event Code Count |Short Description| |Long Description| |Derived| |Post. Fix| The count field indicates whether it is a) available (count >= 1) and b) derived (count > 1) FP_ADD_PIPE 0 x 40000000 |Dispatched FPU ops - Revision B and later revisions - Speculative add pipe ops excluding junk ops| |Register Value[0]: 0 xf P 3 Ctr Mask| |Register Value[1]: 0 x 100 P 3 Ctr Code| FP_MULT_PIPE 0 x 40000001 |Dispatched FPU ops - Revision B and later revisions - Speculative multiply pipe ops excluding junk ops| |Register Value[0]: 0 xf P 3 Ctr Mask| |Register Value[1]: 0 x 200 P 3 Ctr Code|. . . II-22

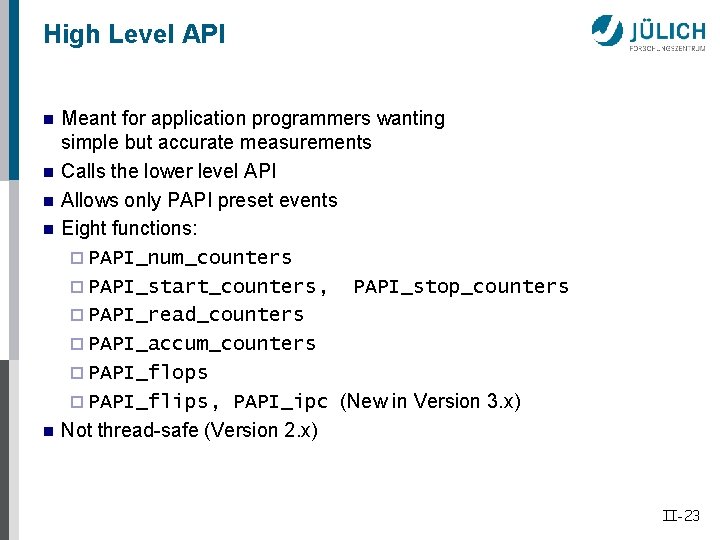
High Level API n n n Meant for application programmers wanting simple but accurate measurements Calls the lower level API Allows only PAPI preset events Eight functions: ¨ PAPI_num_counters ¨ PAPI_start_counters, PAPI_stop_counters ¨ PAPI_read_counters ¨ PAPI_accum_counters ¨ PAPI_flops ¨ PAPI_flips, PAPI_ipc (New in Version 3. x) Not thread-safe (Version 2. x) II-23

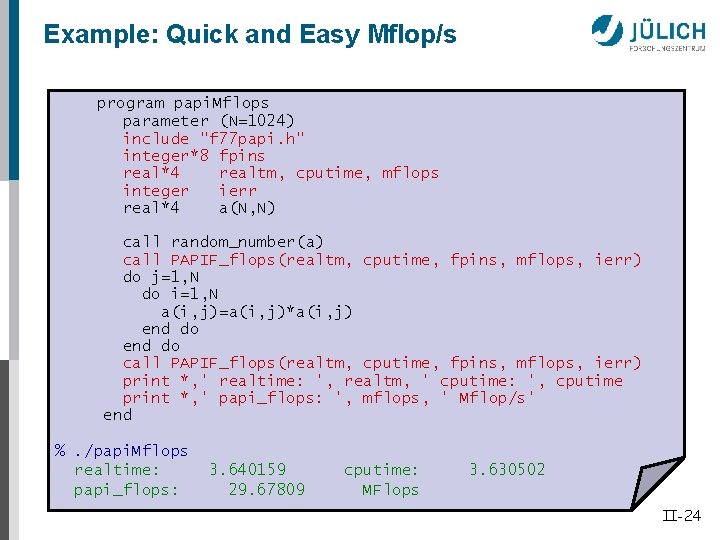
Example: Quick and Easy Mflop/s program papi. Mflops parameter (N=1024) include "f 77 papi. h" integer*8 fpins real*4 realtm, cputime, mflops integer ierr real*4 a(N, N) call random_number(a) call PAPIF_flops(realtm, cputime, fpins, mflops, ierr) do j=1, N do i=1, N a(i, j)=a(i, j)*a(i, j) end do call PAPIF_flops(realtm, cputime, fpins, mflops, ierr) print *, ' realtime: ', realtm, ' cputime: ', cputime print *, ' papi_flops: ', mflops, ' Mflop/s' end %. /papi. Mflops realtime: papi_flops: 3. 640159 29. 67809 cputime: MFlops 3. 630502 II-24

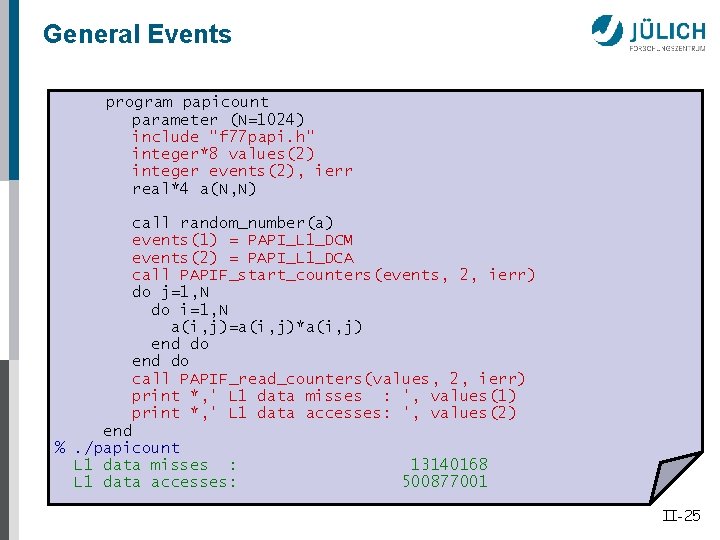
General Events program papicount parameter (N=1024) include "f 77 papi. h" integer*8 values(2) integer events(2), ierr real*4 a(N, N) call random_number(a) events(1) = PAPI_L 1_DCM events(2) = PAPI_L 1_DCA call PAPIF_start_counters(events, 2, ierr) do j=1, N do i=1, N a(i, j)=a(i, j)*a(i, j) end do call PAPIF_read_counters(values, 2, ierr) print *, ' L 1 data misses : ', values(1) print *, ' L 1 data accesses: ', values(2) end %. /papicount L 1 data misses : L 1 data accesses: 13140168 500877001 II-25

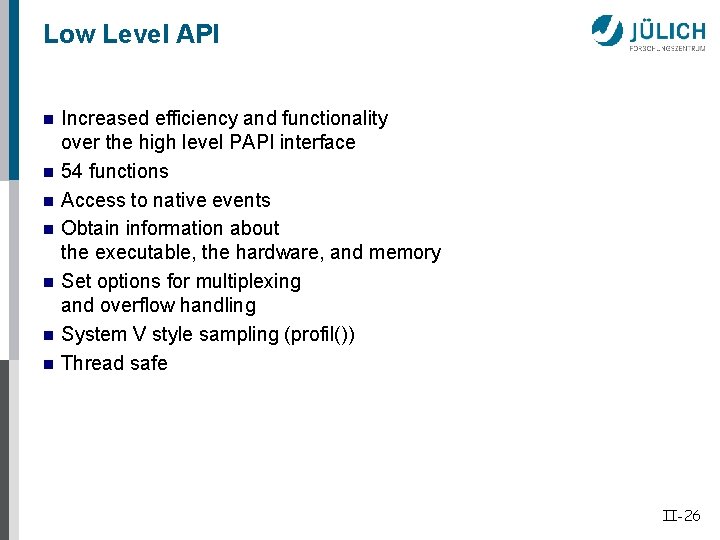
Low Level API n n n n Increased efficiency and functionality over the high level PAPI interface 54 functions Access to native events Obtain information about the executable, the hardware, and memory Set options for multiplexing and overflow handling System V style sampling (profil()) Thread safe II-26

CONTENT § § Fall-back • Simple timers • Hardware counter measurements Overview of some performance tools Practical Performance Analysis and Tuning Challenges and open problems in performance optimization • Heterogeneous systems • Automatic performance analysis: KOJAK/Scalasca • Beyond execution time and flops • Extremely large HPC systems • Tool integration

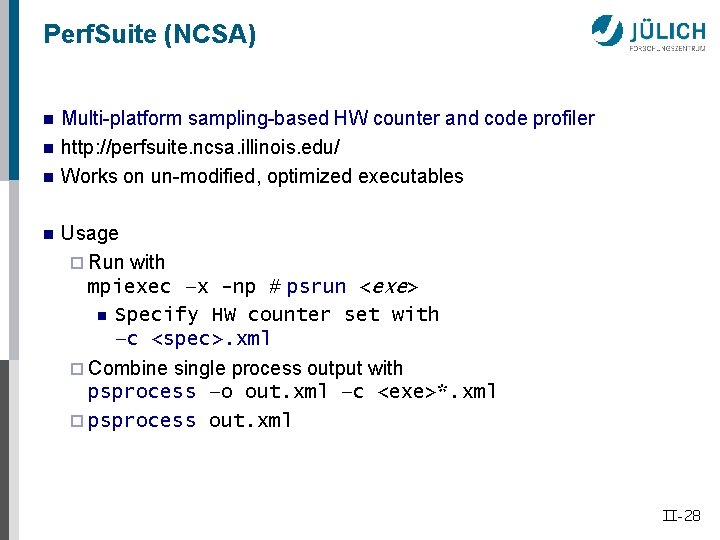
Perf. Suite (NCSA) n n Multi-platform sampling-based HW counter and code profiler http: //perfsuite. ncsa. illinois. edu/ Works on un-modified, optimized executables Usage ¨ Run with mpiexec –x -np # psrun <exe> n Specify HW counter set with –c <spec>. xml ¨ Combine single process output with psprocess –o out. xml –c <exe>*. xml ¨ psprocess out. xml II-28

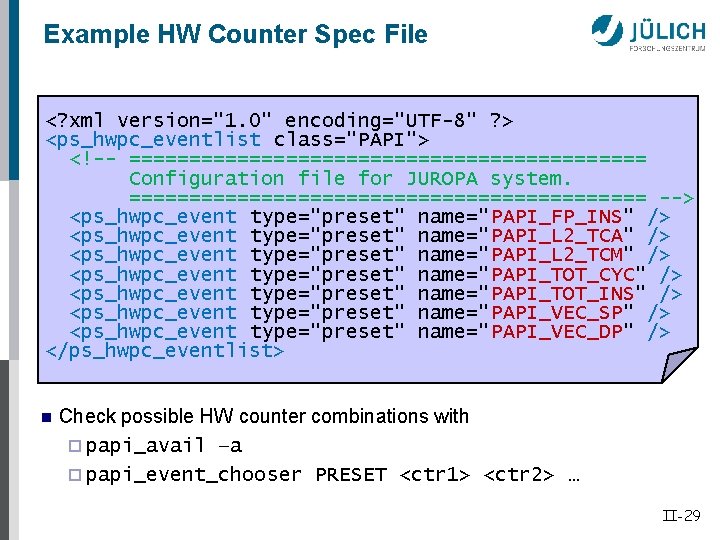
Example HW Counter Spec File <? xml version="1. 0" encoding="UTF-8" ? > <ps_hwpc_eventlist class="PAPI"> <!-- ====================== Configuration file for JUROPA system. ====================== --> <ps_hwpc_event type="preset" name="PAPI_FP_INS" /> <ps_hwpc_event type="preset" name="PAPI_L 2_TCA" /> <ps_hwpc_event type="preset" name="PAPI_L 2_TCM" /> <ps_hwpc_event type="preset" name="PAPI_TOT_CYC" /> <ps_hwpc_event type="preset" name="PAPI_TOT_INS" /> <ps_hwpc_event type="preset" name="PAPI_VEC_SP" /> <ps_hwpc_event type="preset" name="PAPI_VEC_DP" /> </ps_hwpc_eventlist> n Check possible HW counter combinations with ¨ papi_avail –a ¨ papi_event_chooser PRESET <ctr 1> <ctr 2> … II-29

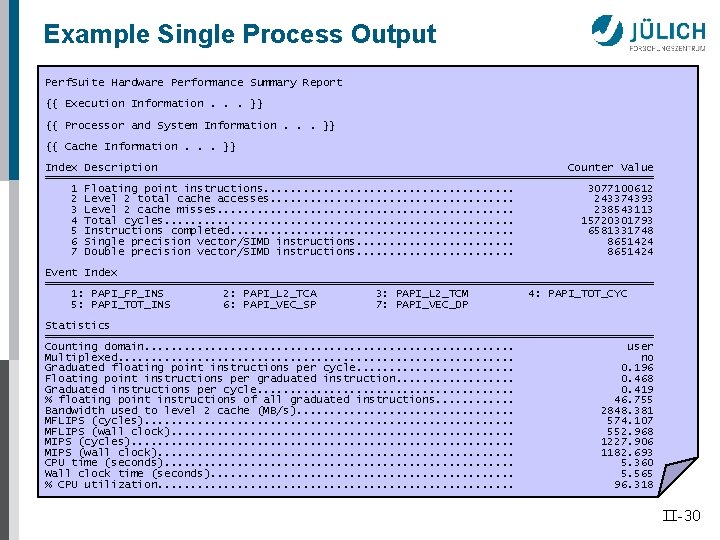
Example Single Process Output Perf. Suite Hardware Performance Summary Report {{ Execution Information. . . }} {{ Processor and System Information. . . }} {{ Cache Information. . . }} Index Description Counter Value ============================================== 1 Floating point instructions. . . . . 3077100612 2 Level 2 total cache accesses. . . . . 243374393 3 Level 2 cache misses. . . 238543113 4 Total cycles. . . . 15720301793 5 Instructions completed. . . 6581331748 6 Single precision vector/SIMD instructions. . . 8651424 7 Double precision vector/SIMD instructions. . . 8651424 Event Index ============================================== 1: PAPI_FP_INS 2: PAPI_L 2_TCA 3: PAPI_L 2_TCM 4: PAPI_TOT_CYC 5: PAPI_TOT_INS 6: PAPI_VEC_SP 7: PAPI_VEC_DP Statistics ============================================== Counting domain. . . . user Multiplexed. . . . no Graduated floating point instructions per cycle. . . 0. 196 Floating point instructions per graduated instruction. . . . 0. 468 Graduated instructions per cycle. . . . . 0. 419 % floating point instructions of all graduated instructions. . . 46. 755 Bandwidth used to level 2 cache (MB/s). . . . 2848. 381 MFLIPS (cycles). . . . 574. 107 MFLIPS (wall clock). . . . 552. 968 MIPS (cycles). . . . 1227. 906 MIPS (wall clock). . . . 1182. 693 CPU time (seconds). . . . 5. 360 Wall clock time (seconds). . . 5. 565 % CPU utilization. . . . 96. 318 II-30

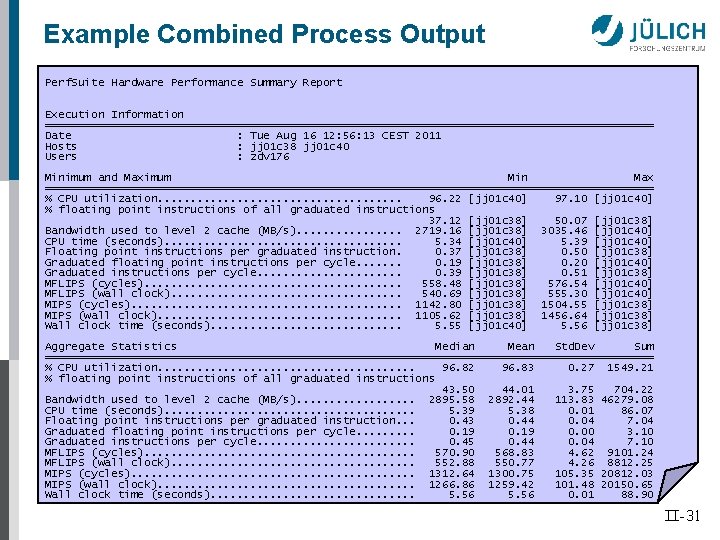
Example Combined Process Output Perf. Suite Hardware Performance Summary Report Execution Information ============================================== Date : Tue Aug 16 12: 56: 13 CEST 2011 Hosts : jj 01 c 38 jj 01 c 40 Users : zdv 176 Minimum and Maximum Min Max ============================================== % CPU utilization. . . . . 96. 22 [jj 01 c 40] 97. 10 [jj 01 c 40] % floating point instructions of all graduated instructions 37. 12 [jj 01 c 38] 50. 07 [jj 01 c 38] Bandwidth used to level 2 cache (MB/s). . . . 2719. 16 [jj 01 c 38] 3035. 46 [jj 01 c 40] CPU time (seconds). . . . . 5. 34 [jj 01 c 40] 5. 39 [jj 01 c 40] Floating point instructions per graduated instruction. 0. 37 [jj 01 c 38] 0. 50 [jj 01 c 38] Graduated floating point instructions per cycle. . . . 0. 19 [jj 01 c 38] 0. 20 [jj 01 c 40] Graduated instructions per cycle. . . . . 0. 39 [jj 01 c 38] 0. 51 [jj 01 c 38] MFLIPS (cycles). . . . . 558. 48 [jj 01 c 38] 576. 54 [jj 01 c 40] MFLIPS (wall clock). . . . . 540. 69 [jj 01 c 38] 555. 30 [jj 01 c 40] MIPS (cycles). . . . . 1142. 80 [jj 01 c 38] 1504. 55 [jj 01 c 38] MIPS (wall clock). . . . . 1105. 62 [jj 01 c 38] 1456. 64 [jj 01 c 38] Wall clock time (seconds). . . . 5. 55 [jj 01 c 40] 5. 56 [jj 01 c 38] Aggregate Statistics Median Mean Std. Dev Sum ============================================== % CPU utilization. . . . . 96. 82 96. 83 0. 27 1549. 21 % floating point instructions of all graduated instructions 43. 50 44. 01 3. 75 704. 22 Bandwidth used to level 2 cache (MB/s). . . . 2895. 58 2892. 44 113. 83 46279. 08 CPU time (seconds). . . . . 5. 39 5. 38 0. 01 86. 07 Floating point instructions per graduated instruction. . . 0. 43 0. 44 0. 04 7. 04 Graduated floating point instructions per cycle. . 0. 19 0. 00 3. 10 Graduated instructions per cycle. . . 0. 45 0. 44 0. 04 7. 10 MFLIPS (cycles). . . . . 570. 90 568. 83 4. 62 9101. 24 MFLIPS (wall clock). . . . . 552. 88 550. 77 4. 26 8812. 25 MIPS (cycles). . . 1312. 64 1300. 75 105. 35 20812. 03 MIPS (wall clock). . . . . 1266. 86 1259. 42 101. 48 20150. 65 Wall clock time (seconds). . . . 5. 56 0. 01 88. 90 II-31

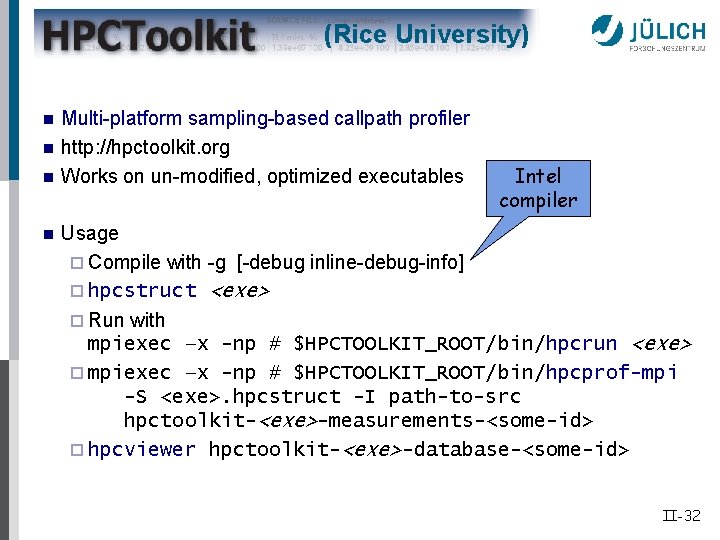
(Rice University) n n Multi-platform sampling-based callpath profiler http: //hpctoolkit. org Works on un-modified, optimized executables Intel compiler Usage ¨ Compile with -g [-debug inline-debug-info] ¨ hpcstruct <exe> ¨ Run with mpiexec –x -np # $HPCTOOLKIT_ROOT/bin/hpcrun <exe> ¨ mpiexec –x -np # $HPCTOOLKIT_ROOT/bin/hpcprof-mpi -S <exe>. hpcstruct -I path-to-src hpctoolkit-<exe>-measurements-<some-id> ¨ hpcviewer hpctoolkit-<exe>-database-<some-id> II-32

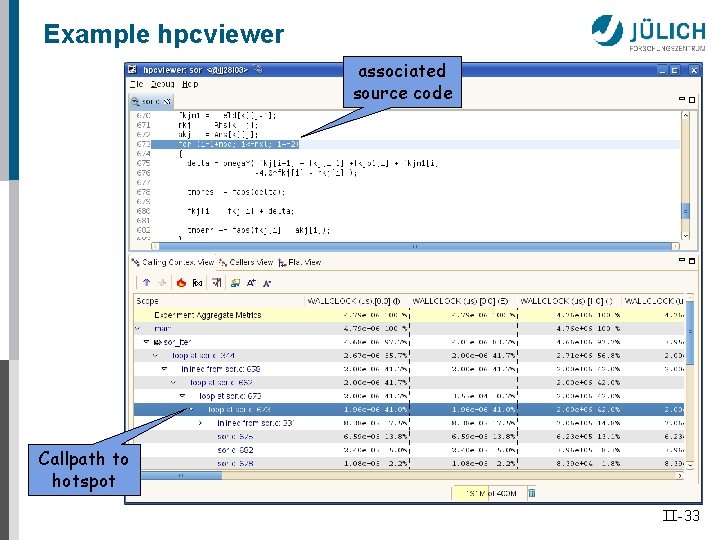
Example hpcviewer associated source code Callpath to hotspot II-33

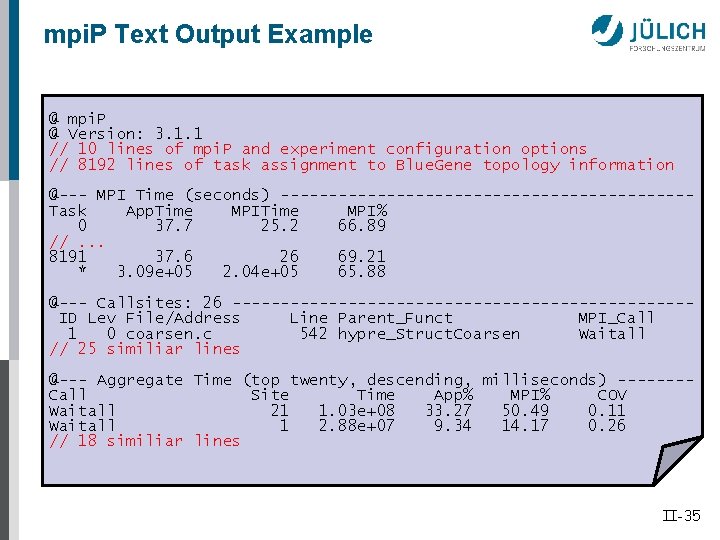
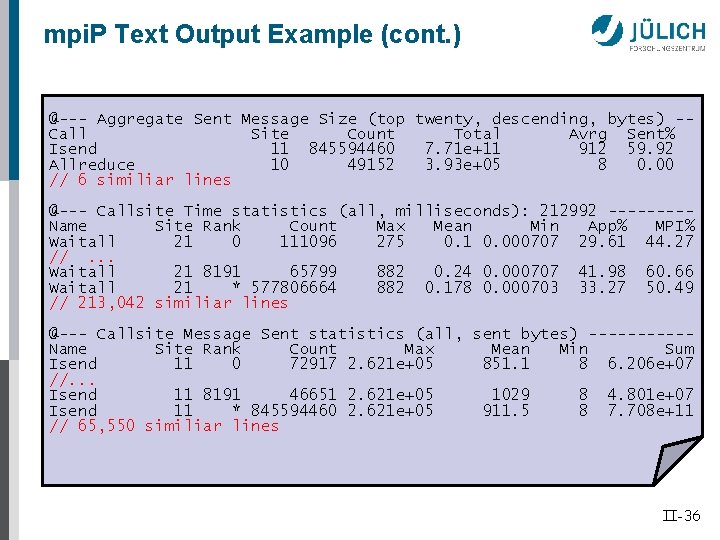
MPI Profiling: mpi. P n Scalable, light-weight MPI profiling library n Generates detailed text summary of MPI behavior ¨ Time spent at each MPI function callsite ¨ Bytes sent by each MPI function callsite (where applicable) ¨ MPI I/O statistics ¨ Configurable traceback depth for function callsites n Usage ¨ Compile with –g ¨ Link with -L$MPIP_LIBRTS -lmpi. P -lbfd -liberty -lm -lz n http: //mpip. sourceforge. net/ II-34

mpi. P Text Output Example @ mpi. P @ Version: 3. 1. 1 // 10 lines of mpi. P and experiment configuration options // 8192 lines of task assignment to Blue. Gene topology information @--- MPI Time (seconds) ---------------------Task App. Time MPI% 0 37. 7 25. 2 66. 89 //. . . 8191 37. 6 26 69. 21 * 3. 09 e+05 2. 04 e+05 65. 88 @--- Callsites: 26 ------------------------ID Lev File/Address Line Parent_Funct MPI_Call 1 0 coarsen. c 542 hypre_Struct. Coarsen Waitall // 25 similiar lines @--- Aggregate Time (top twenty, descending, milliseconds) -------Call Site Time App% MPI% COV Waitall 21 1. 03 e+08 33. 27 50. 49 0. 11 Waitall 1 2. 88 e+07 9. 34 14. 17 0. 26 // 18 similiar lines II-35

mpi. P Text Output Example (cont. ) @--- Aggregate Sent Message Size (top twenty, descending, bytes) -Call Site Count Total Avrg Sent% Isend 11 845594460 7. 71 e+11 912 59. 92 Allreduce 10 49152 3. 93 e+05 8 0. 00 // 6 similiar lines @--- Callsite Time statistics (all, milliseconds): 212992 ----Name Site Rank Count Max Mean Min App% MPI% Waitall 21 0 111096 275 0. 1 0. 000707 29. 61 44. 27 //. . . Waitall 21 8191 65799 882 0. 24 0. 000707 41. 98 60. 66 Waitall 21 * 577806664 882 0. 178 0. 000703 33. 27 50. 49 // 213, 042 similiar lines @--- Callsite Message Sent statistics (all, sent bytes) -----Name Site Rank Count Max Mean Min Sum Isend 11 0 72917 2. 621 e+05 851. 1 8 6. 206 e+07 //. . . Isend 11 8191 46651 2. 621 e+05 1029 8 4. 801 e+07 Isend 11 * 845594460 2. 621 e+05 911. 5 8 7. 708 e+11 // 65, 550 similiar lines II-36

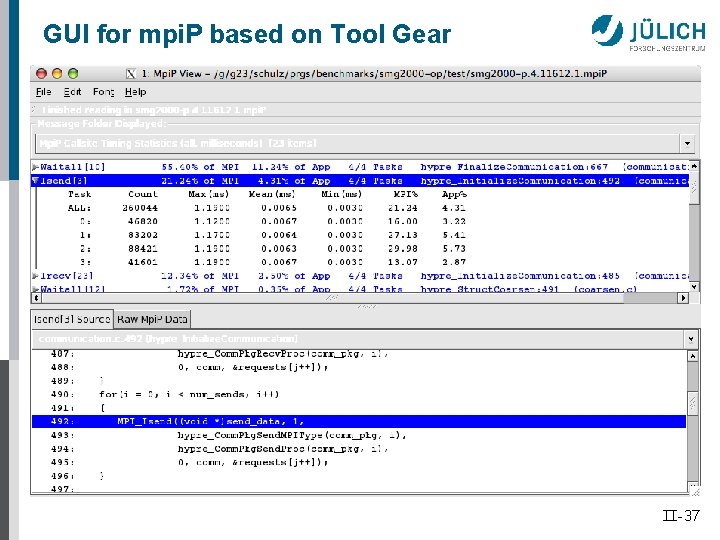
GUI for mpi. P based on Tool Gear II-37

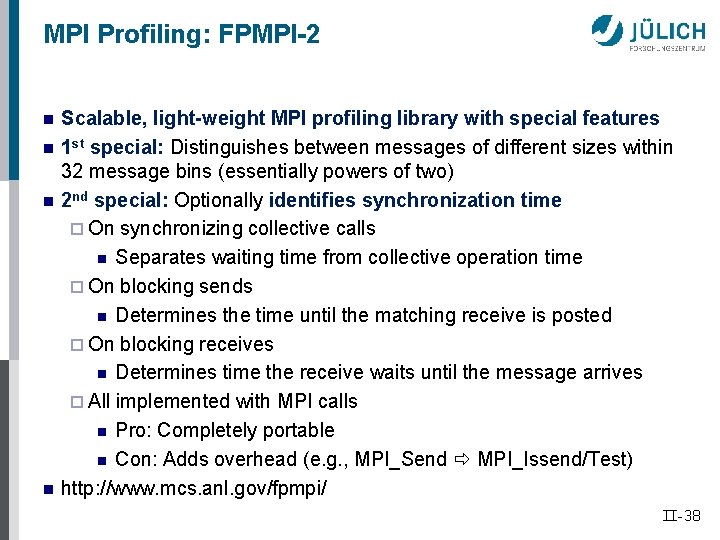
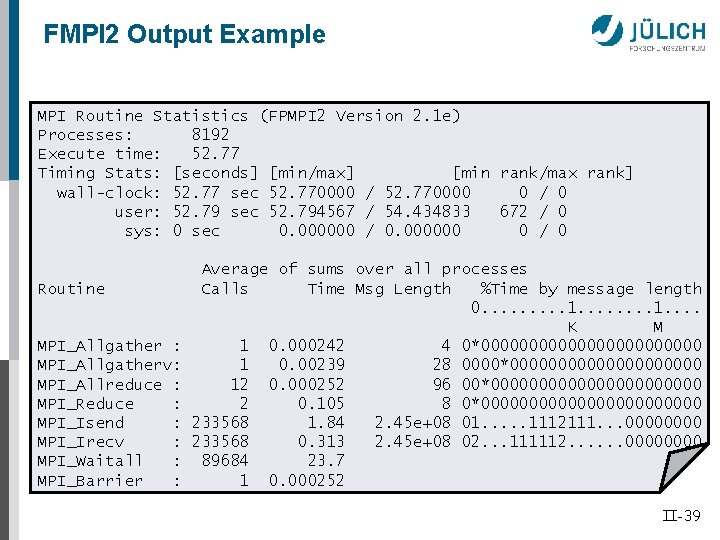
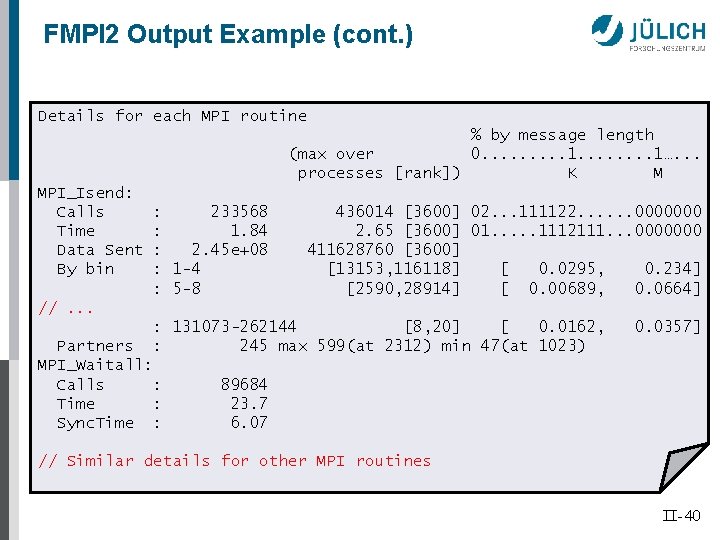
MPI Profiling: FPMPI-2 n n Scalable, light-weight MPI profiling library with special features 1 st special: Distinguishes between messages of different sizes within 32 message bins (essentially powers of two) 2 nd special: Optionally identifies synchronization time ¨ On synchronizing collective calls n Separates waiting time from collective operation time ¨ On blocking sends n Determines the time until the matching receive is posted ¨ On blocking receives n Determines time the receive waits until the message arrives ¨ All implemented with MPI calls n Pro: Completely portable n Con: Adds overhead (e. g. , MPI_Send MPI_Issend/Test) http: //www. mcs. anl. gov/fpmpi/ II-38

FMPI 2 Output Example MPI Routine Statistics (FPMPI 2 Version 2. 1 e) Processes: 8192 Execute time: 52. 77 Timing Stats: [seconds] [min/max] [min rank/max rank] wall-clock: 52. 77 sec 52. 770000 / 52. 770000 0 / 0 user: 52. 79 sec 52. 794567 / 54. 434833 672 / 0 sys: 0 sec 0. 000000 / 0. 000000 0 / 0 Routine MPI_Allgather : MPI_Allgatherv: MPI_Allreduce : MPI_Reduce : MPI_Isend : MPI_Irecv : MPI_Waitall : MPI_Barrier : Average of sums over all processes Calls Time Msg Length %Time by message length 0. . 1. . K M 1 0. 000242 4 0*000000000000 1 0. 00239 28 0000*0000000000 12 0. 000252 96 00*00000000000 2 0. 105 8 0*000000000000 233568 1. 84 2. 45 e+08 01. . . 1112111. . . 0000 233568 0. 313 2. 45 e+08 02. . . 111112. . . 0000 89684 23. 7 1 0. 000252 II-39

FMPI 2 Output Example (cont. ) Details for each MPI routine % by message length (max over 0. . 1. . . . 1…. . . processes [rank]) K M MPI_Isend: Calls Time Data Sent By bin : 233568 : 1. 84 : 2. 45 e+08 : 1 -4 : 5 -8 436014 [3600] 02. . . 111122. . . 0000000 2. 65 [3600] 01. . . 1112111. . . 0000000 411628760 [3600] [13153, 116118] [ 0. 0295, 0. 234] [2590, 28914] [ 0. 00689, 0. 0664] //. . . : 131073 -262144 [8, 20] [ 0. 0162, : 245 max 599(at 2312) min 47(at 1023) Partners MPI_Waitall: Calls : Time : Sync. Time : 0. 0357] 89684 23. 7 6. 07 // Similar details for other MPI routines II-40

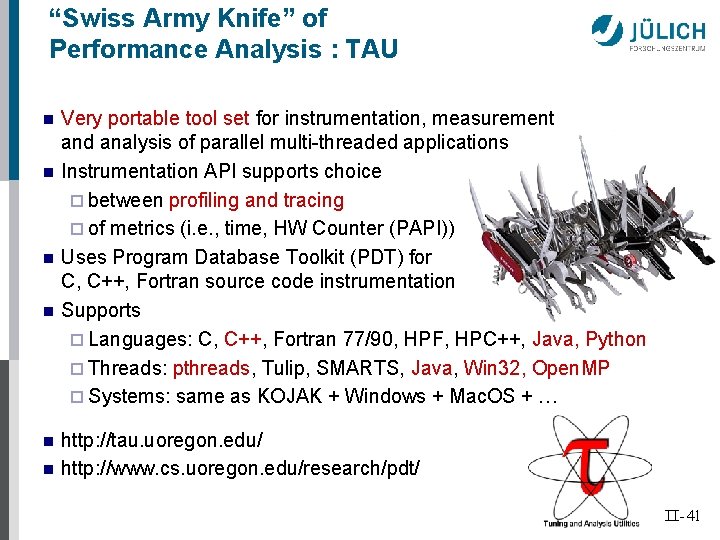
“Swiss Army Knife” of Performance Analysis : TAU n n n Very portable tool set for instrumentation, measurement and analysis of parallel multi-threaded applications Instrumentation API supports choice ¨ between profiling and tracing ¨ of metrics (i. e. , time, HW Counter (PAPI)) Uses Program Database Toolkit (PDT) for C, C++, Fortran source code instrumentation Supports ¨ Languages: C, C++, Fortran 77/90, HPF, HPC++, Java, Python ¨ Threads: pthreads, Tulip, SMARTS, Java, Win 32, Open. MP ¨ Systems: same as KOJAK + Windows + Mac. OS + … http: //tau. uoregon. edu/ http: //www. cs. uoregon. edu/research/pdt/ II-41

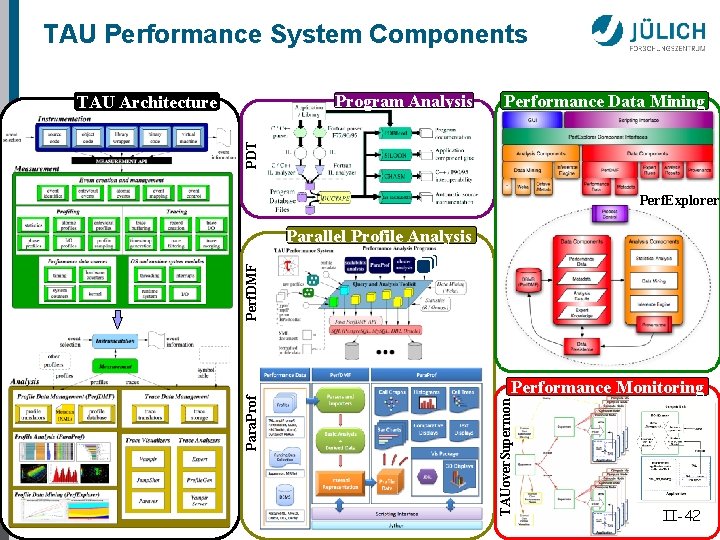
TAU Performance System Components Program Analysis Performance Data Mining PDT TAU Architecture Perf. Explorer Performance Monitoring TAUover. Supermon Para. Prof Perf. DMF Parallel Profile Analysis II-42

TAU Instrumentation n Flexible instrumentation mechanisms at multiple levels ¨ Source code n manual n automatic ¨ C, C++, F 77/90/95 (Program Database Toolkit (PDT)) ¨ Open. MP (directive rewriting with Opari) ¨ Object code n pre-instrumented libraries (e. g. , MPI using PMPI) n statically-linked and dynamically-loaded (e. g. , Python) ¨ Executable code n dynamic instrumentation (pre-execution) (Dyn. Inst, MAQAO) n virtual machine instrumentation (e. g. , Java using JVMPI) Support for performance mapping Support for object-oriented and generic programming II-43

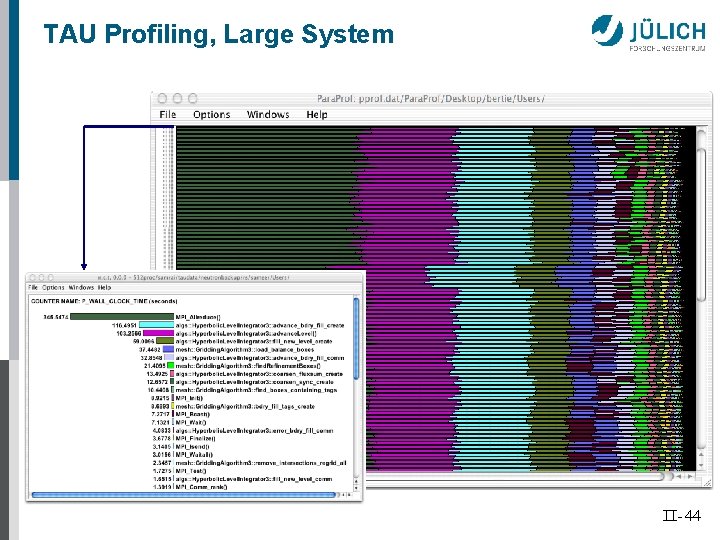
TAU Profiling, Large System II-44

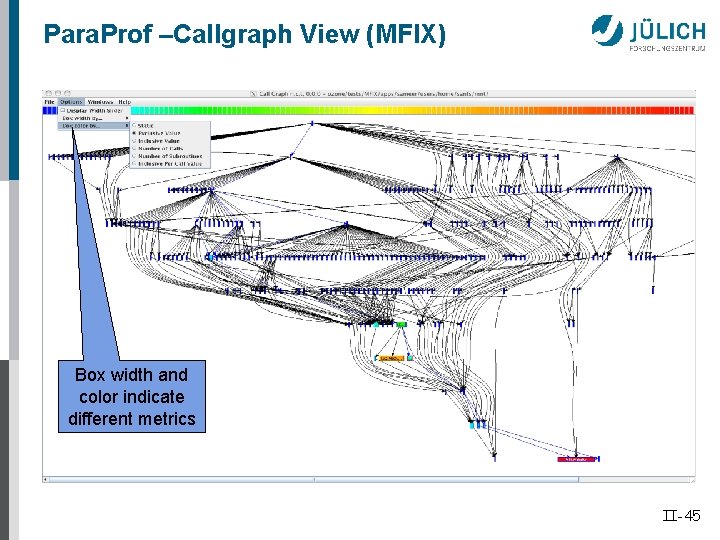
Para. Prof –Callgraph View (MFIX) Box width and color indicate different metrics II-45

TAU Usage n Usage: ¨ Specify programming model by setting TAU_MAKEFILE to one of $<TAU_ROOT>/<arch>/lib/Makefile. tau-* Examples from Linux cluster with Intel compiler and PAPI: n n n MPI: Makefile. tau-icpc-papi-mpi-pdt OMP: Makefile. tau-icpc-papi-pdt-openmp-opari OMPI: Makefile. tau-icpc-papi-mpi-pdt-openmp-opari ¨ Compile and link with n tau_cc. sh file. c. . . n tau_cxx. sh file. cxx. . . n tau_f 90. sh file. f 90. . . ¨ Execute with real input data Environment variables control measurement mode n TAU_PROFILE, TAU_TRACE, TAU_CALLPATH, … ¨ Examine results with paraprof II-46

Vampirtrace MPI Tracing Tool n Library for Tracing of MPI and Application Events ¨ Records MPI-1 point-to-point and collective communication ¨ Records MPI– 2 I/O operations and RMA operations ¨ Records user subroutines n Uses the standard MPI profiling interface n Usage: ¨ Compile and link with n vtcc -vt: cc mpicc file. c. . . n vtcxx -vt: cxx mpi. CC file. cxx. . . n vtf 90 -vt: f 90 mpif 90 file. f 90. . . ¨ Execute with real input data ( generates <exe>. otf) II-47

Vampirtrace MPI Tracing Tool n n Versions up to 4. 0 until 2003 were commercially distributed by PALLAS as Vampir. Trace Current status ¨ Commercially distributed by Intel n Version 5 and up distributed as Intel Trace Collector n For Intel based platforms only n http: //software. intel. com/en-us/articles/intel-cluster-toolkit/ ¨ New open-source Vampir. Trace version 5 distributed by Technical University Dresden n Based on KOJAK’s measurement system with OTF backend n http: //www. tu-dresden. de/zih/vampirtrace/ n Is also distributed as part of Open MPI II-48

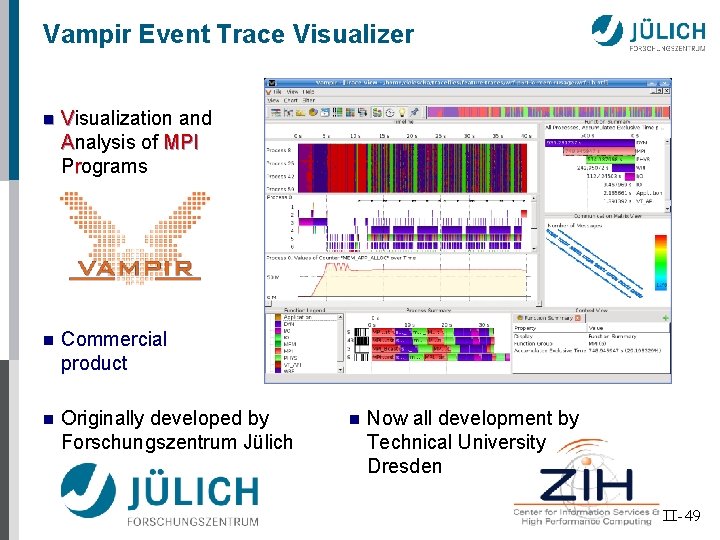
Vampir Event Trace Visualizer n Visualization and Analysis of MPI Programs n Commercial product n Originally developed by Forschungszentrum Jülich n Now all development by Technical University Dresden II-49

Vampir Event Trace Visualizer n n Versions up to 4. 0 until 2003 were commercially distributed by PALLAS as Vampir Current status ¨ Commercially distributed by Intel n Version 4 distributed as Intel Trace Analyzer n For Intel based platforms only n Intel meanwhile released own new version (ITA V 6 and up) n http: //software. intel. com/en-us/articles/intel-cluster-toolkit/ ¨ Original Vampir (and new VNG) commercially distributed by Technical University Dresden n http: //www. vampir. eu II-50

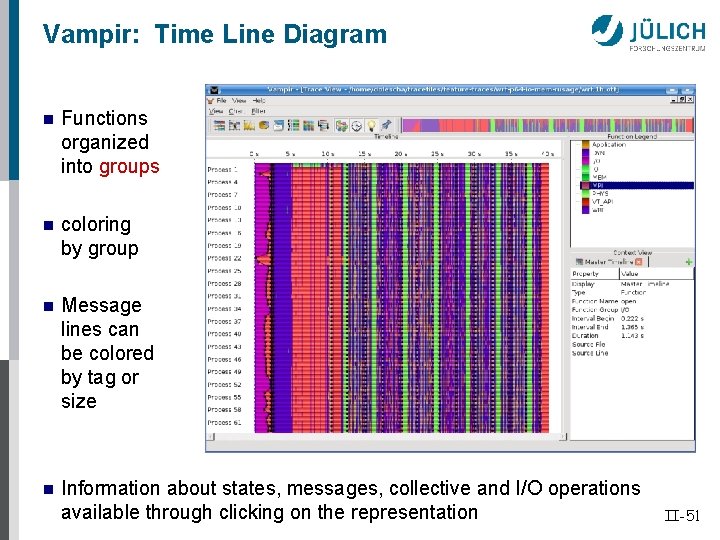
Vampir: Time Line Diagram n Functions organized into groups n coloring by group n Message lines can be colored by tag or size n Information about states, messages, collective and I/O operations available through clicking on the representation II-51

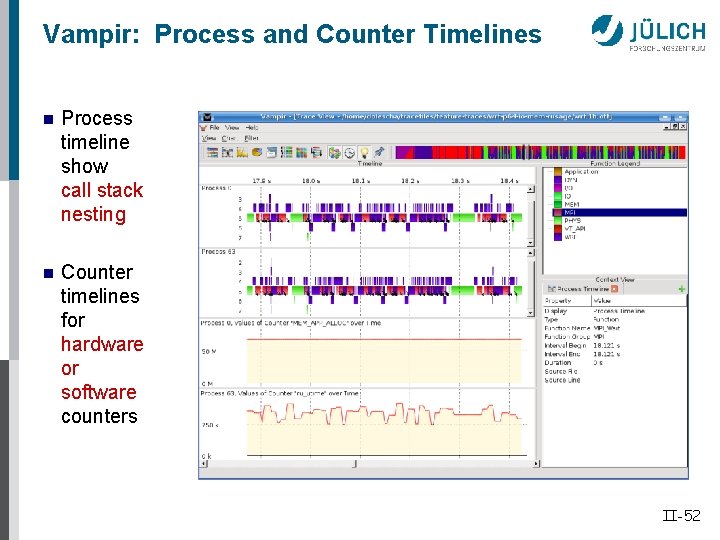
Vampir: Process and Counter Timelines n Process timeline show call stack nesting n Counter timelines for hardware or software counters II-52

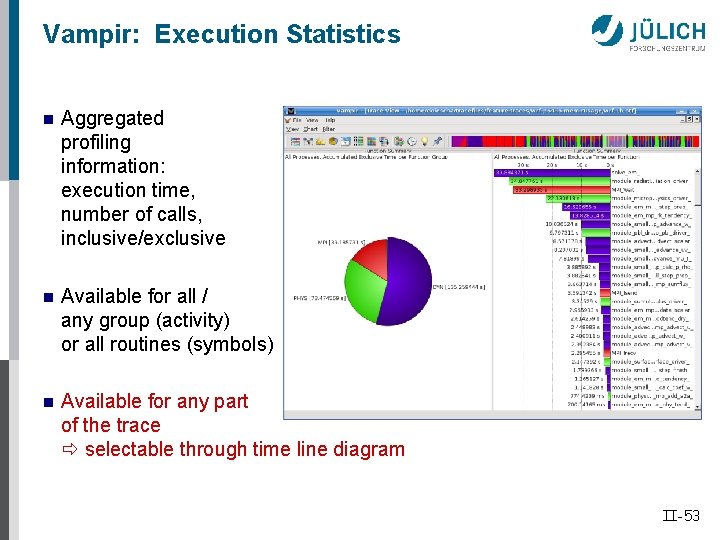
Vampir: Execution Statistics n Aggregated profiling information: execution time, number of calls, inclusive/exclusive n Available for all / any group (activity) or all routines (symbols) n Available for any part of the trace selectable through time line diagram II-53

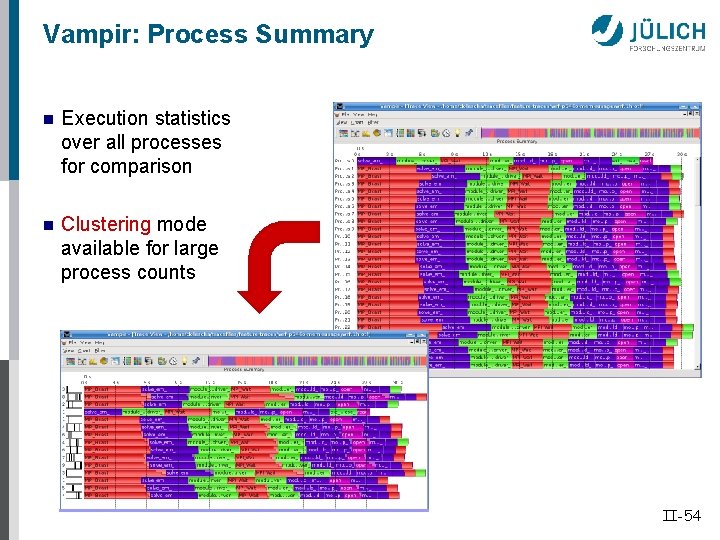
Vampir: Process Summary n Execution statistics over all processes for comparison n Clustering mode available for large process counts II-54

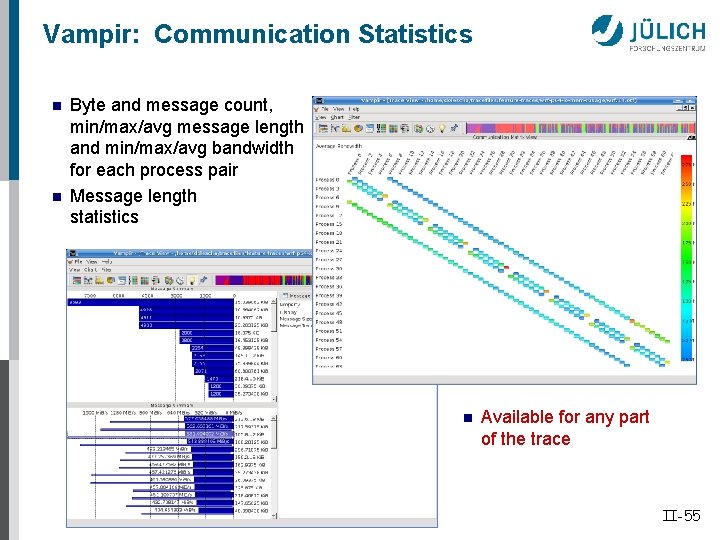
Vampir: Communication Statistics n n Byte and message count, min/max/avg message length and min/max/avg bandwidth for each process pair Message length statistics n Available for any part of the trace II-55

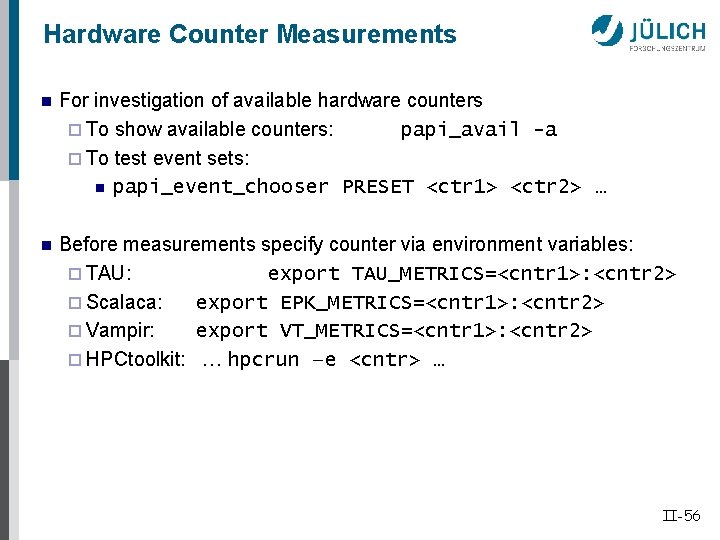
Hardware Counter Measurements n For investigation of available hardware counters ¨ To show available counters: papi_avail -a ¨ To test event sets: n papi_event_chooser PRESET <ctr 1> <ctr 2> … n Before measurements specify counter via environment variables: ¨ TAU: export TAU_METRICS=<cntr 1>: <cntr 2> ¨ Scalaca: export EPK_METRICS=<cntr 1>: <cntr 2> ¨ Vampir: export VT_METRICS=<cntr 1>: <cntr 2> ¨ HPCtoolkit: … hpcrun –e <cntr> … II-56

Other Profiling Tools n gprof ¨ Available on many systems ¨ Compiler instrumentation (invoked via –g –pg) n Thread. Spotter (Rogue Wave) [commercial product] ¨ http: //www. roguewave. com/products/threadspotter. aspx ¨ Sampling-based memory and thread performance analyzer ¨ Works on un-modified, optimized executables n omp. P (UC Berkeley) ¨ http: //www. ompp-tool. com ¨ Open. MP profiler (invoked via OPARI source instrumentation) n Open|Speed. Shop (Krell Insitute with support of LANL, SNL, LLNL) ¨ http: //www. openspeedshop. org ¨ Comprehensive performance analysis environment ¨ Uses binary instrumentation (via Dyn. Inst) II-57

Other Tracing Tools n MPE / Jumpshot (ANL) ¨ Part of MPICH 2 ¨ Invoked via re-linking ¨ Only supports MPI P 2 P and collectives; SLOG 2 trace format n Extrae / Paraver (BSC/UPC) ¨ http: //www. bsc. es/paraver ¨ Measurement system (Extrae) and visualizer (Paraver) ¨ Powerful filter and summarization features ¨ Very configurable visualization II-58

CONTENT § § Fall-back • Simple timers • Hardware counter measurements Overview of some performance tools Practical Performance Analysis and Tuning Challenges and open problems in performance optimization • Heterogeneous systems • Automatic performance analysis: KOJAK/Scalasca • Beyond execution time and flops • Extremely large HPC systems • Tool integration

Practical Performance Analysis and Tuning n Successful tuning is combination of ¨ Right algorithm and libraries ¨ Compiler flags and pragmas / directives (Learn and use them) ¨ THINKING n Measurement is better than reasoning / intuition (= guessing) ¨ To determine performance problems ¨ To validate tuning decisions / optimizations (after each step!) II-60

Practical Performance Analysis and Tuning n It is easier to optimize a slow correct program than to debug a fast incorrect one Debugging before Tuning Nobody really cares how fast you can compute the wrong answer n The 80/20 rule ¨ Program spents 80% time in 20% of code ¨ Programmer spends 20% effort to get 80% of the total speedup possible in the code Know when to stop! n Don’t optimize what doesn’t matter Make the common case fast II-61

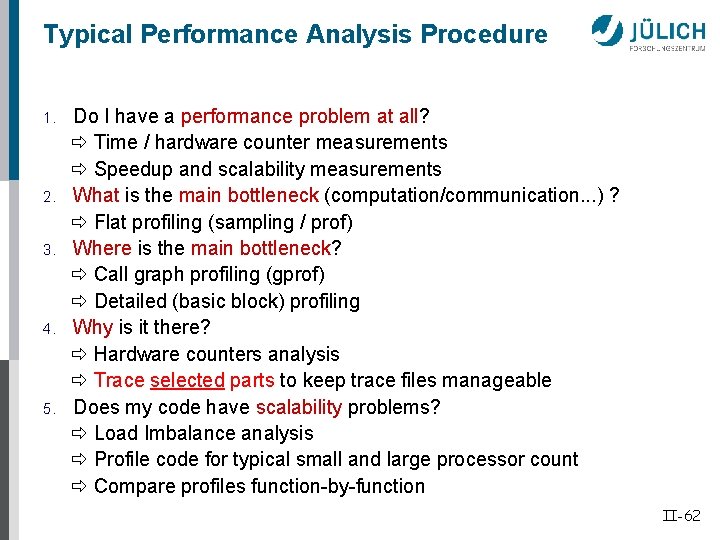
Typical Performance Analysis Procedure 1. 2. 3. 4. 5. Do I have a performance problem at all? Time / hardware counter measurements Speedup and scalability measurements What is the main bottleneck (computation/communication. . . ) ? Flat profiling (sampling / prof) Where is the main bottleneck? Call graph profiling (gprof) Detailed (basic block) profiling Why is it there? Hardware counters analysis Trace selected parts to keep trace files manageable Does my code have scalability problems? Load Imbalance analysis Profile code for typical small and large processor count Compare profiles function-by-function II-62

IMPORTANT: Limit Trace File Size n Tracing without careful preparation only results in huge un-analyzable trace files (only if you have large enough disks / quota)!! n Use smallest number of processors possible Use smallest input data set (e. g. number of time steps) Limit trace file size ¨ By environment variables / API functions / config files? Trace only selected parts by using control functions to switch tracing on/off ¨ Select important parts only ¨ For iterative programs: trace some iterations only Trace only important events ¨ No MPI administrative funcs and/or MPI collective funcs ¨ Only user function in call tree level 1 or 2 ¨ Never functions called in (inner) loops n n II-63

CONTENT § § Fall-back • Simple timers • Hardware counter measurements Overview of some performance tools Practical Performance Analysis and Tuning Challenges and open problems in performance optimization • Heterogeneous systems • Automatic performance analysis: KOJAK/Scalasca • Beyond execution time and flops • Extremely large HPC systems • Tool integration

Heterogenous Systems n Current trend to use hardware acceleration to speedup calculations ¨ IBM Cell (dead) ¨ FPGA-based acceleration ¨ GPU-based acceleration ¨ Manycore (e. g. Intel MIC) acceleration n In the long run: new programming models needed Very little to not existing tool support Tool research opportunities! n II-65

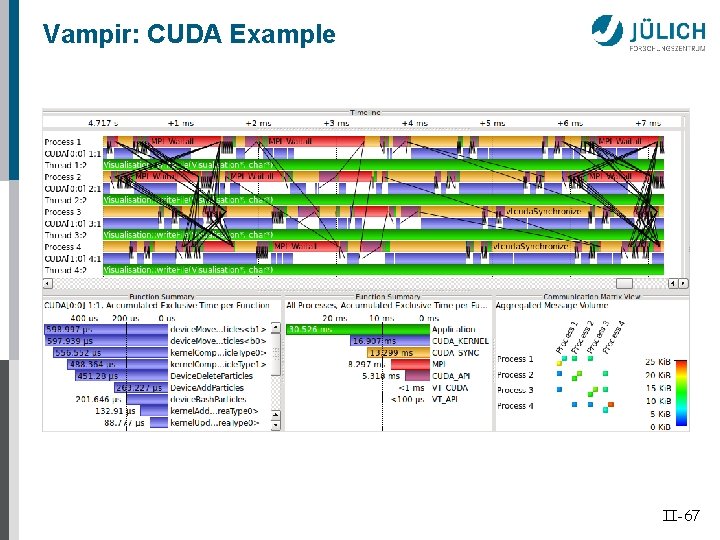
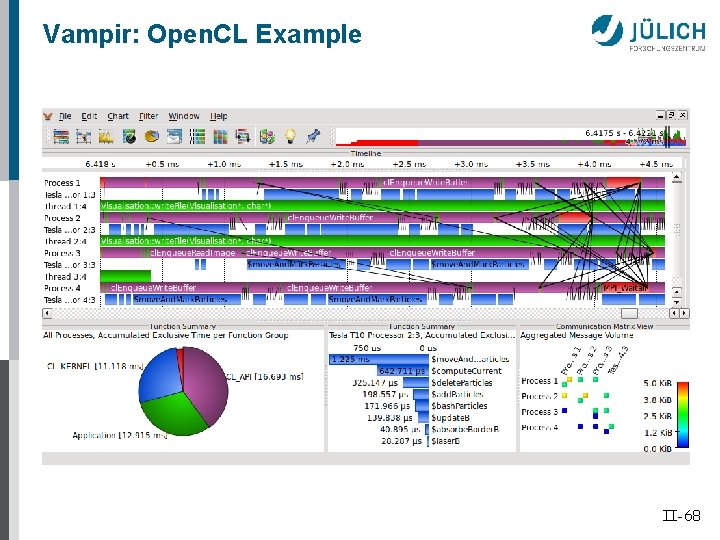
GPU Performance Tools n CUDA profiler n NVIDIA Parallel Nsight (for Microsoft Visual Studio) n TAU ¨ Tracking of CUDA runtime API, CUDA driver API and Open. CL API calls, kernels and data transfers between host and accelerator ¨ Support for CUDA tracing via CUPTI callbacks and activities n Vampir. Trace ¨ Tracking of CUDA runtime API, CUDA driver API and Open. CL API calls, kernels and data transfers between host and accelerator ¨ Support for CUDA tracing via CUPTI callbacks and activities ¨ Support for NVML counters (CUDA 4. 0 and newer) ¨ Support for tracing of CUDA driver API with CUPTI callbacks II-66

Vampir: CUDA Example II-67

Vampir: Open. CL Example II-68

Current Related Projects n Hybrid Programming for Heterogeneous Architectures ¨ EU //H 4 H ITEA 2 funded project 2010 – 2013 ¨ Successor of successful Par. MA project ¨ 25 partners for France, Germany, Spain, Sweden including Bull, TUD, BSC, USQV, JSC, Acumem ¨ Develop programming models and tools ¨ Evaluation with large set of industrial codes II-69

CONTENT § § Fall-back • Simple timers • Hardware counter measurements Overview of some performance tools Practical Performance Analysis and Tuning Challenges and open problems in performance optimization • Heterogeneous systems • Automatic performance analysis: KOJAK/Scalasca • Beyond execution time and flops • Extremely large HPC systems • Tool integration

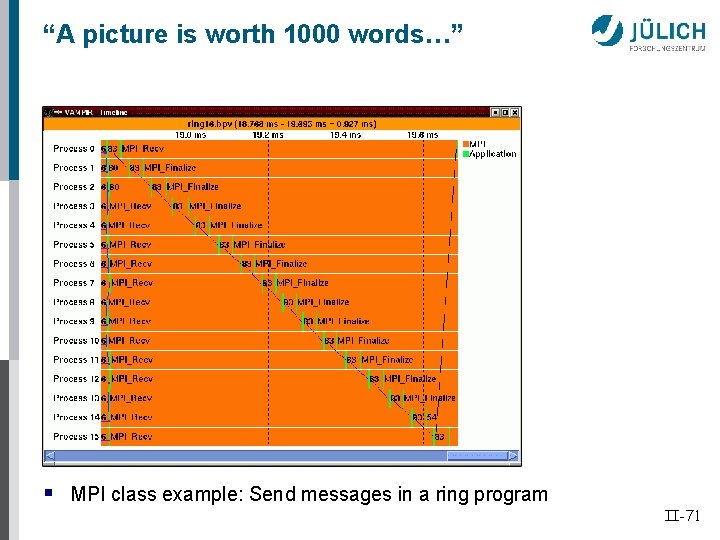
“A picture is worth 1000 words…” § MPI class example: Send messages in a ring program II-71

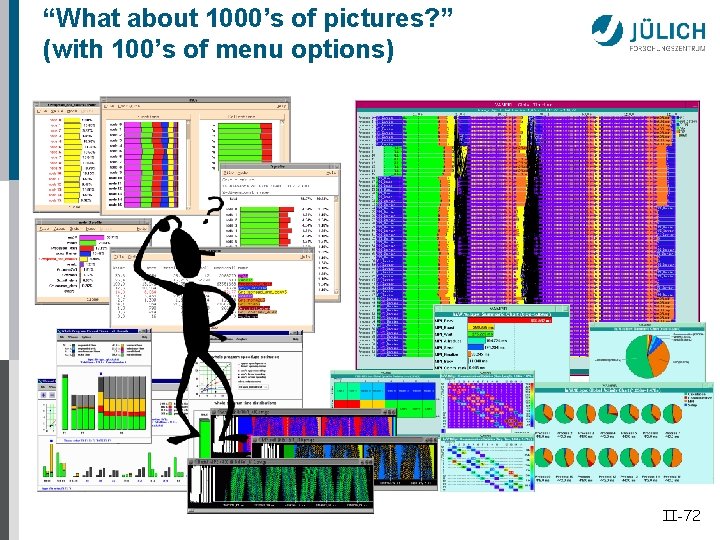
“What about 1000’s of pictures? ” (with 100’s of menu options) II-72

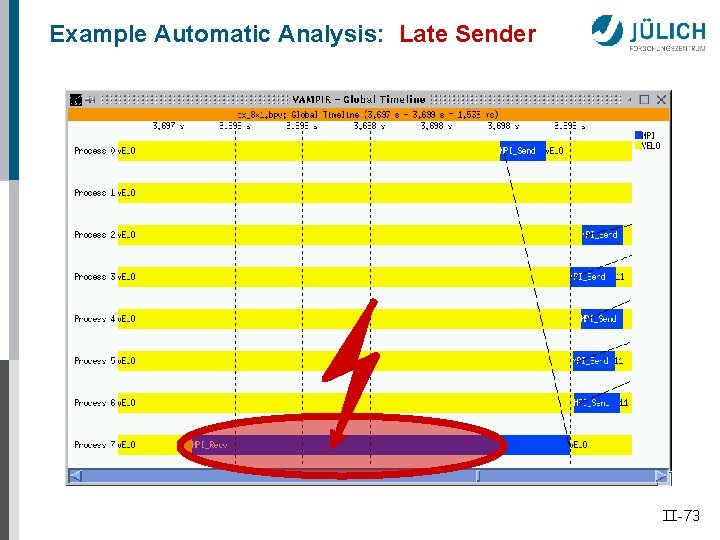
Example Automatic Analysis: Late Sender II-73

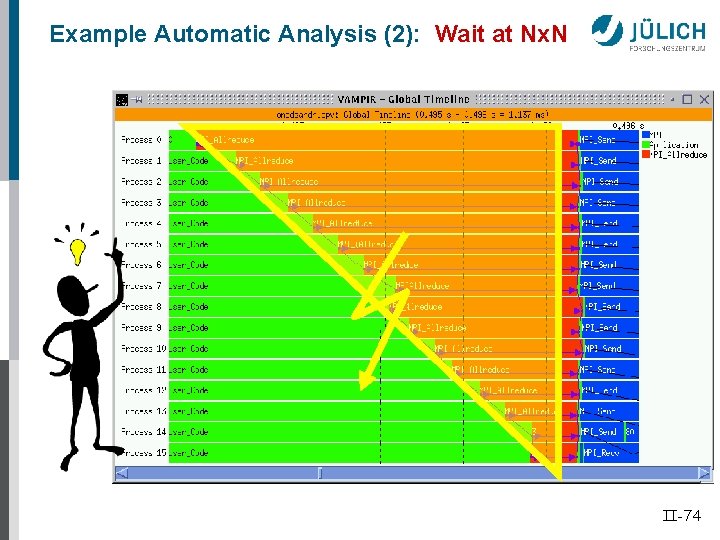
Example Automatic Analysis (2): Wait at Nx. N II-74

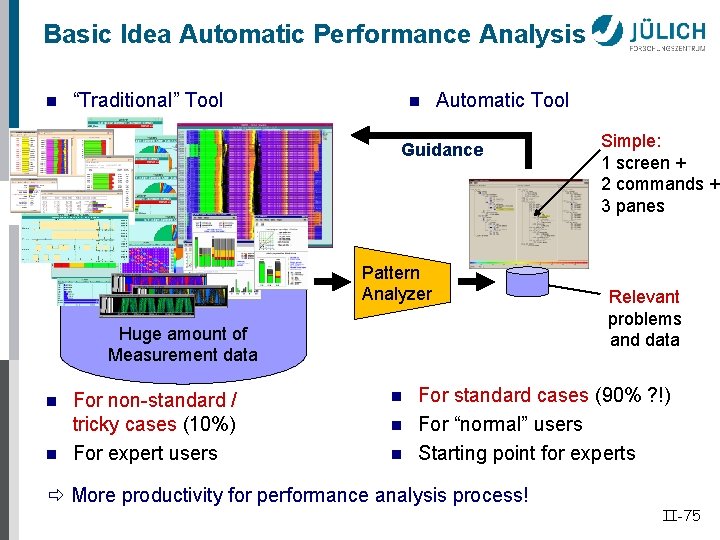
Basic Idea Automatic Performance Analysis n “Traditional” Tool n Automatic Tool Guidance Pattern Analyzer Huge amount of Measurement data n n For non-standard / tricky cases (10%) For expert users n n n Simple: 1 screen + 2 commands + 3 panes Relevant problems and data For standard cases (90% ? !) For “normal” users Starting point for experts More productivity for performance analysis process! II-75

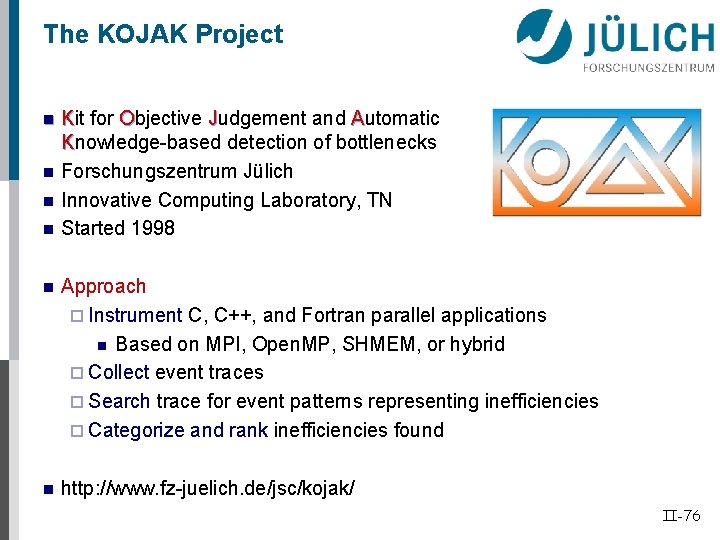
The KOJAK Project n n Kit for Objective Judgement and Automatic Knowledge-based detection of bottlenecks Forschungszentrum Jülich Innovative Computing Laboratory, TN Started 1998 n Approach ¨ Instrument C, C++, and Fortran parallel applications n Based on MPI, Open. MP, SHMEM, or hybrid ¨ Collect event traces ¨ Search trace for event patterns representing inefficiencies ¨ Categorize and rank inefficiencies found n http: //www. fz-juelich. de/jsc/kojak/ II-76

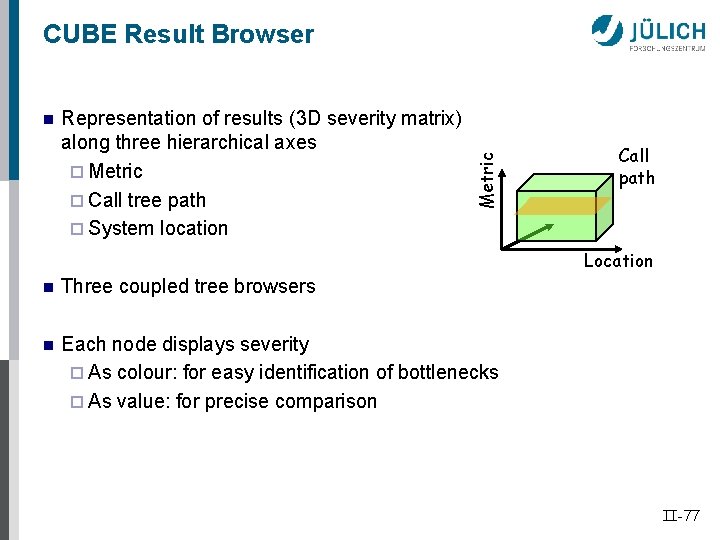
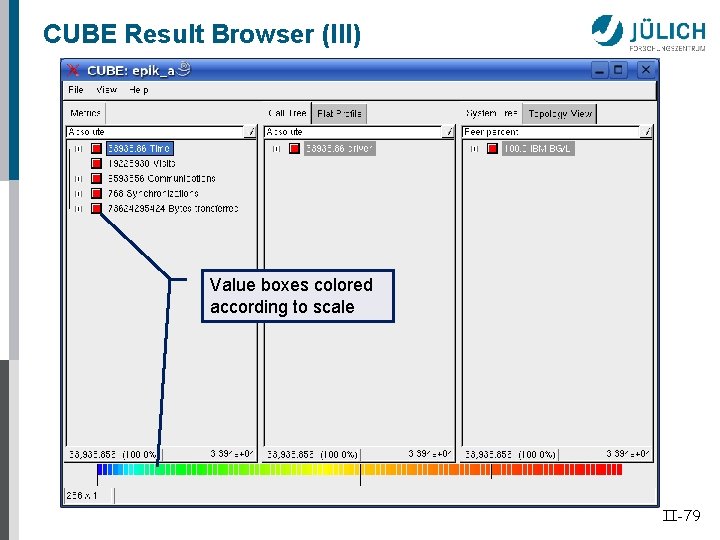
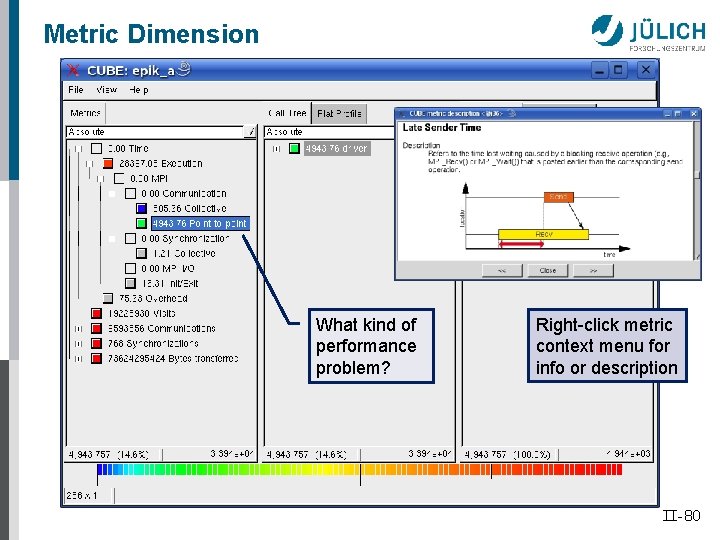
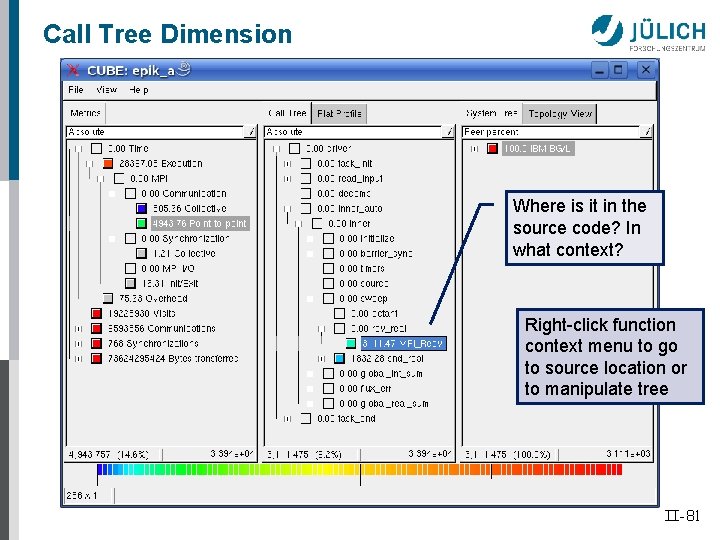
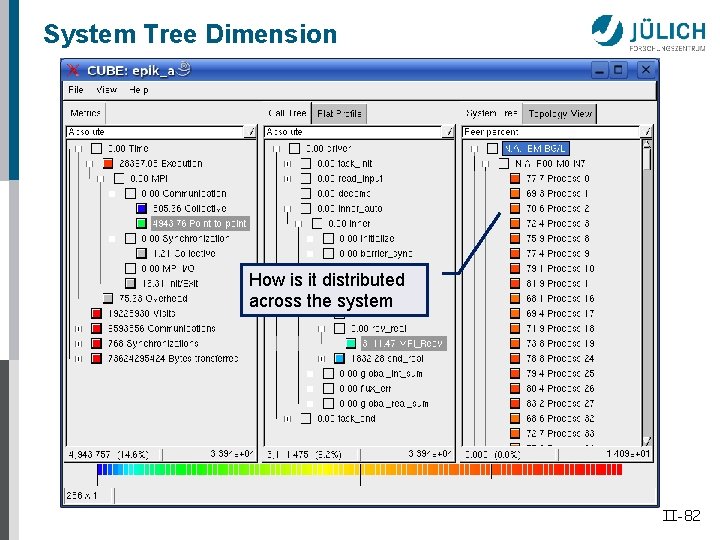
n Representation of results (3 D severity matrix) along three hierarchical axes ¨ Metric ¨ Call tree path ¨ System location Metric CUBE Result Browser Call path Location n Three coupled tree browsers n Each node displays severity ¨ As colour: for easy identification of bottlenecks ¨ As value: for precise comparison II-77

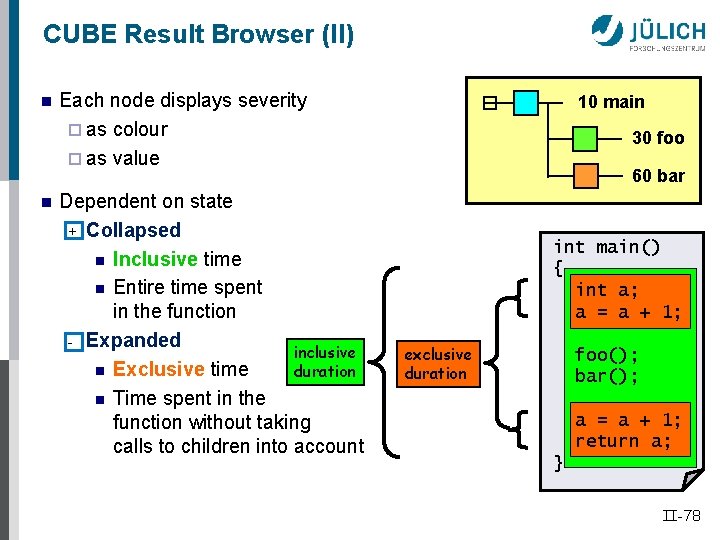
CUBE Result Browser (II) n n Each node displays severity ¨ as colour ¨ as value Dependent on state + Collapsed n Inclusive time n Entire time spent in the function - Expanded inclusive n Exclusive time duration n Time spent in the function without taking calls to children into account 10 main 100 main 30 foo 60 bar int main() { int a; a = a + 1; exclusive duration foo(); bar(); a = a + 1; return a; } II-78

CUBE Result Browser (III) Value boxes colored according to scale II-79

Metric Dimension What kind of performance problem? Right-click metric context menu for info or description II-80

Call Tree Dimension Where is it in the source code? In what context? Right-click function context menu to go to source location or to manipulate tree II-81

System Tree Dimension How is it distributed across the system II-82

CONTENT § § Fall-back • Simple timers • Hardware counter measurements Overview of some performance tools Practical Performance Analysis and Tuning Challenges and open problems in performance optimization • Heterogeneous systems • Automatic performance analysis: KOJAK/Scalasca • Beyond execution time and flops • Extremely large HPC systems • Tool Integration

Beyond Execution Time and Flops n High performance on today’s architectures requires extremely effective use of the cache and memory hierarchy of the system ¨ Very complex designs ¨ Will get “worse” with advanced multi- and many core chips tools for memory performance analysis needed ¨ Current approach: n Measure cache, memory, TLB events (per execution unit) n Rarely tell what data object(s) are cause of the problem ¨ Main problem: n if cause known, what is the fix? n Or worse, what is the portable fix? Should be really better left to the compiler! II-84

Beyond Execution Time and Flops II n Do we need tools for I/O performance analysis? ¨ Currently only very few tools available (Cray. Pat, Pablo I/O, …) ¨ Perhaps scientific programmers only need training in parallel I/0 facilities already available today? n Tools for new programming paradigms? ¨ Obvious next candidate: one-sided communication n SHMEM, MPI-2 RMA, ARMCI, … ¨ “Easy” to monitor; intercept calls e. g. , using wrapper funcs n CAF, UPC ¨ “Harder”; probably need compiler support ¨ Other candidates? II-85

Beyond Execution Time and Flops III n Tool (sets and environments) must be able to handle “hybrid” cases! ¨ Message passing (MPI) ¨ Multi-threading (Open. MP, pthreads, …) ¨ One-sided communication ¨ (Parallel) I/O ¨… n BIGGEST challenge: ¨ Many tools for instrumentation, measurement, analysis, and visualization ¨ What about (automatic) optimization tools? II-86

CONTENT § § Fall-back • Simple timers • Hardware counter measurements Overview of some performance tools Practical Performance Analysis and Tuning Challenges and open problems in performance optimization • Heterogeneous systems • Automatic performance analysis: KOJAK/Scalasca • Beyond execution time and flops • Extremely large HPC systems • Tool integration

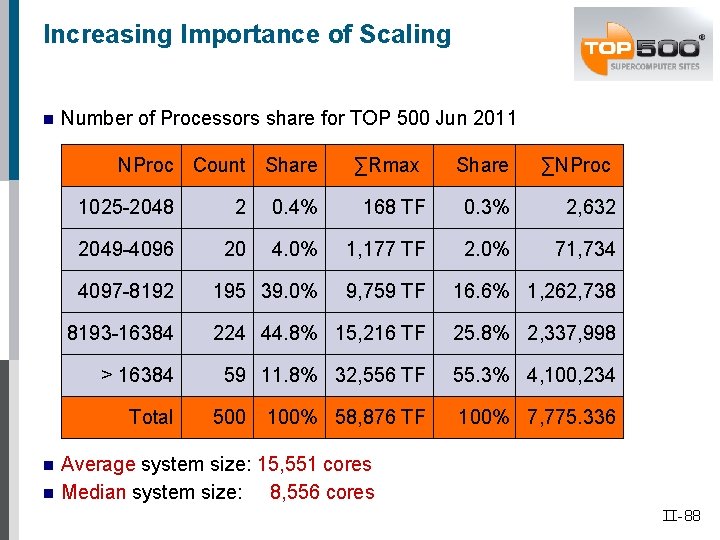
Increasing Importance of Scaling n Number of Processors share for TOP 500 Jun 2011 NProc Count Share ∑NProc 2 0. 4% 168 TF 0. 3% 2, 632 2049 -4096 20 4. 0% 1, 177 TF 2. 0% 71, 734 195 39. 0% 9, 759 TF 16. 6% 1, 262, 738 8193 -16384 224 44. 8% 15, 216 TF 25. 8% 2, 337, 998 > 16384 59 11. 8% 32, 556 TF 55. 3% 4, 100, 234 Total n Share 1025 -2048 4097 -8192 n ∑Rmax 500 100% 58, 876 TF 100% 7, 775. 336 Average system size: 15, 551 cores Median system size: 8, 556 cores II-88

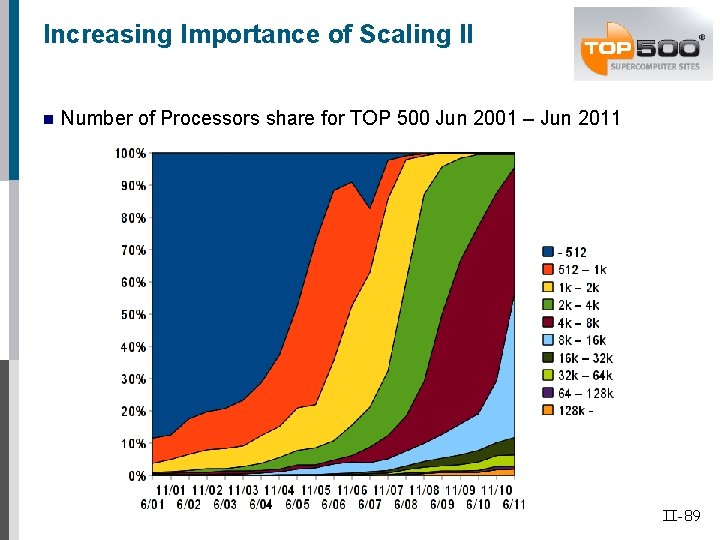
Increasing Importance of Scaling II n Number of Processors share for TOP 500 Jun 2001 – Jun 2011 II-89

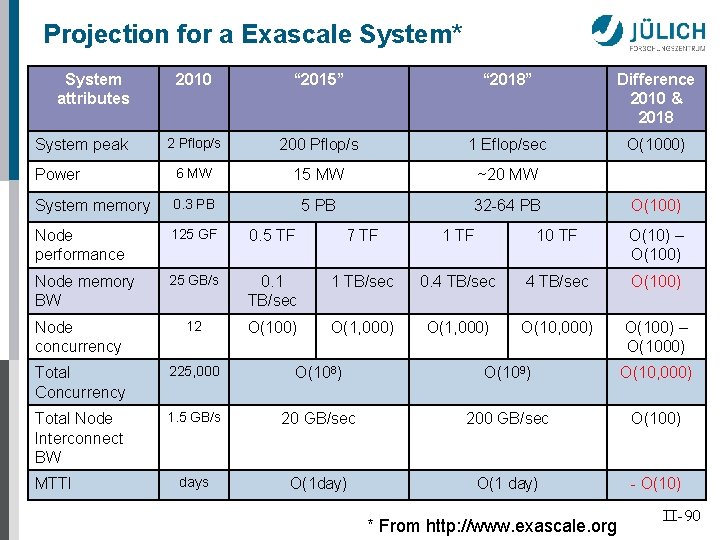
Projection for a Exascale System* System attributes 2010 “ 2015” “ 2018” Difference 2010 & 2018 2 Pflop/s 200 Pflop/s 1 Eflop/sec O(1000) Power 6 MW 15 MW ~20 MW System memory 0. 3 PB 5 PB 32 -64 PB Node performance 125 GF 0. 5 TF 7 TF 10 TF O(10) – O(100) Node memory BW 25 GB/s 0. 1 TB/sec 0. 4 TB/sec O(100) Node concurrency 12 O(100) O(1, 000) O(10, 000) O(100) – O(1000) Total Concurrency 225, 000 O(108) O(109) O(10, 000) Total Node Interconnect BW 1. 5 GB/s 20 GB/sec 200 GB/sec O(100) days O(1 day) O(1 day) - O(10) System peak MTTI * From http: //www. exascale. org O(100) II-90

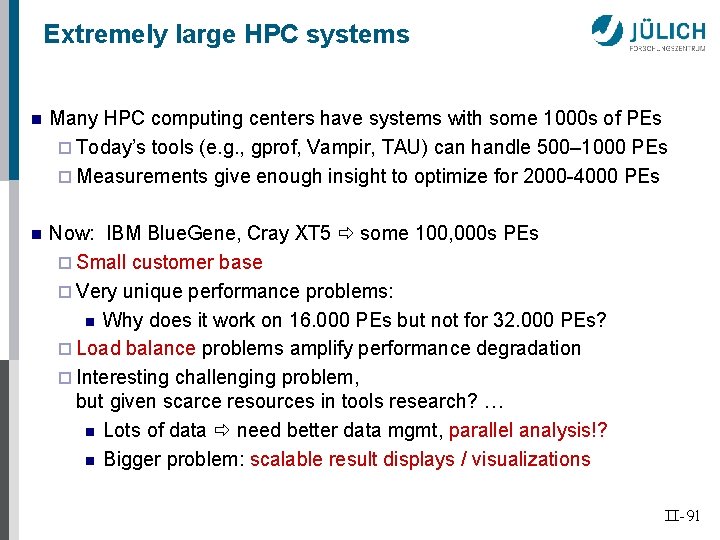
Extremely large HPC systems n Many HPC computing centers have systems with some 1000 s of PEs ¨ Today’s tools (e. g. , gprof, Vampir, TAU) can handle 500– 1000 PEs ¨ Measurements give enough insight to optimize for 2000 -4000 PEs n Now: IBM Blue. Gene, Cray XT 5 some 100, 000 s PEs ¨ Small customer base ¨ Very unique performance problems: n Why does it work on 16. 000 PEs but not for 32. 000 PEs? ¨ Load balance problems amplify performance degradation ¨ Interesting challenging problem, but given scarce resources in tools research? … n Lots of data need better data mgmt, parallel analysis!? n Bigger problem: scalable result displays / visualizations II-91

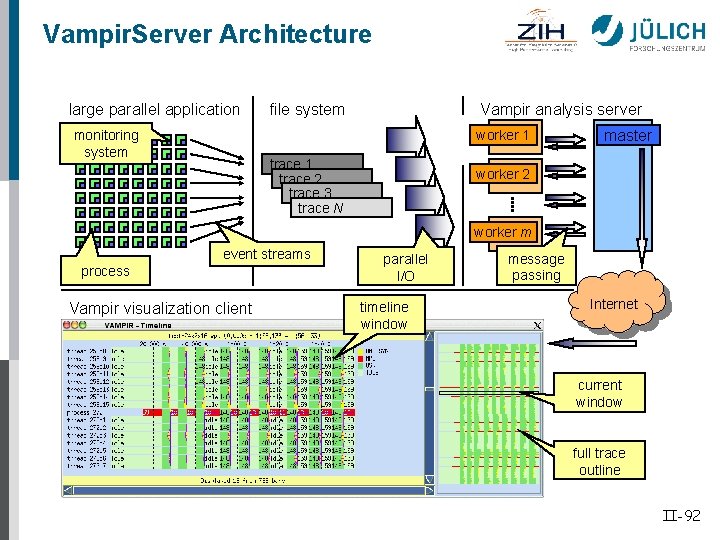
Vampir. Server Architecture large parallel application monitoring system file system trace 1 trace 2 trace 3 trace N Vampir analysis server Merged traces master worker 1 traditional: worker 2 § monolithic § sequential worker m event streams process Vampir visualization client parallel I/O timeline window message passing Internet current window full trace outline II-92

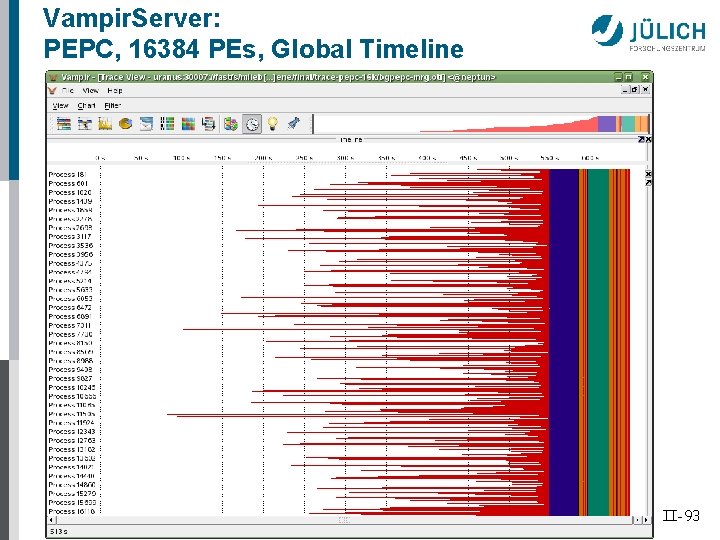
Vampir. Server: PEPC, 16384 PEs, Global Timeline II-93

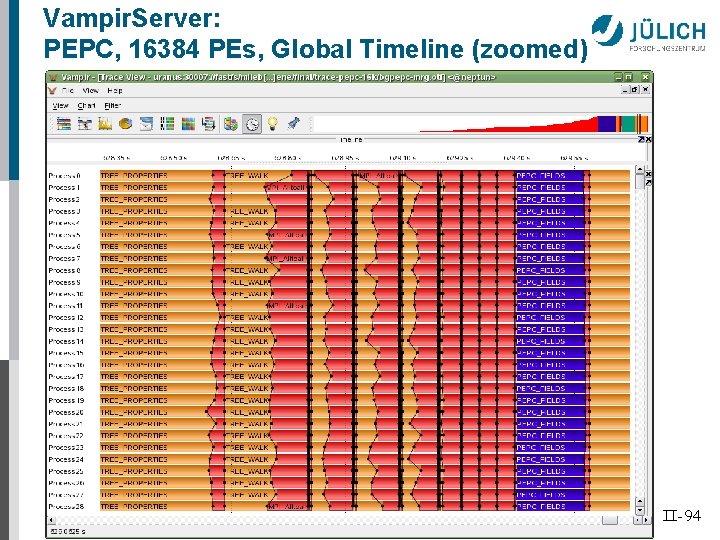
Vampir. Server: PEPC, 16384 PEs, Global Timeline (zoomed) II-94

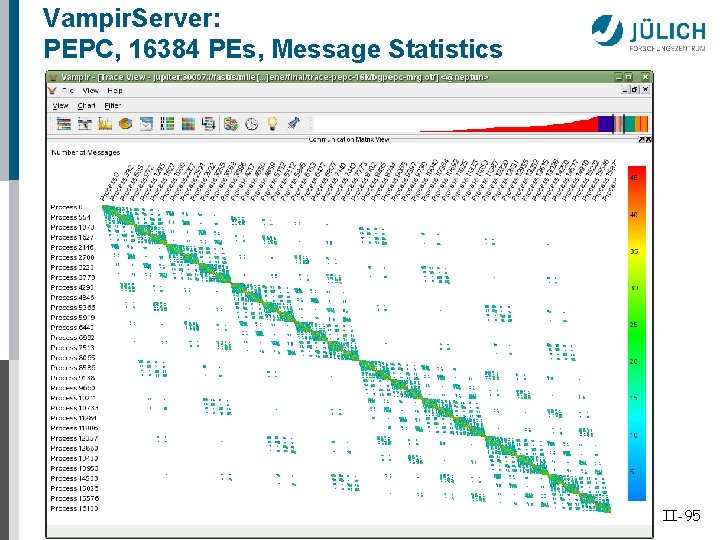
Vampir. Server: PEPC, 16384 PEs, Message Statistics II-95

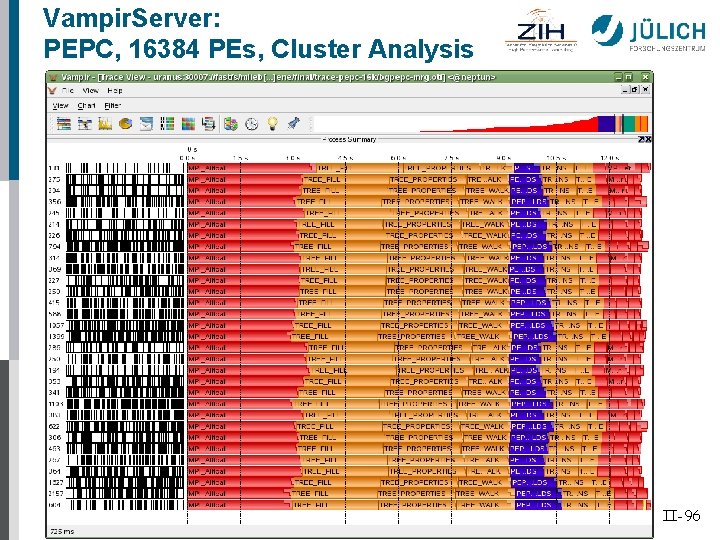
Vampir. Server: PEPC, 16384 PEs, Cluster Analysis II-96

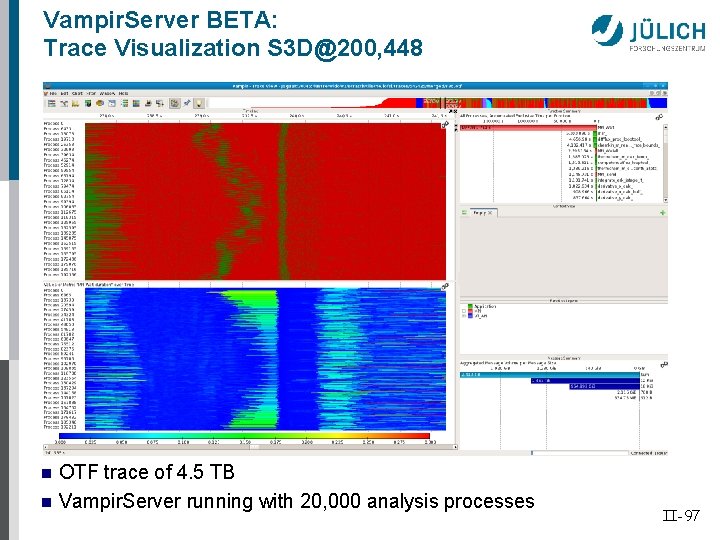
Vampir. Server BETA: Trace Visualization S 3 D@200, 448 n n OTF trace of 4. 5 TB Vampir. Server running with 20, 000 analysis processes II-97

Vampirserver n Parallel client/server version of Vampir ¨ Can handle much larger trace files ¨ Remote visualization possible n Usage ¨ Start Vampir. Server daemon n vampirserver start smp –n <t> # on frontend: <t> threads n vampirserver start mpi –n <p> # cluster: <p> processes ¨ Start the Vampir visualizer (vampir) n on local system if available n on frontend in 2 nd shell then connect client to server, load analyze trace file <exe>. otf n finally: vampirserver stop II-98

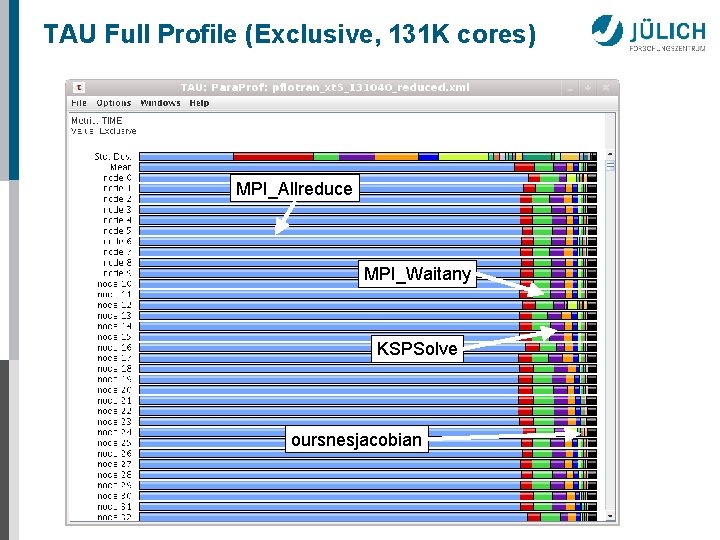
TAU Full Profile (Exclusive, 131 K cores) MPI_Allreduce MPI_Waitany KSPSolve oursnesjacobian

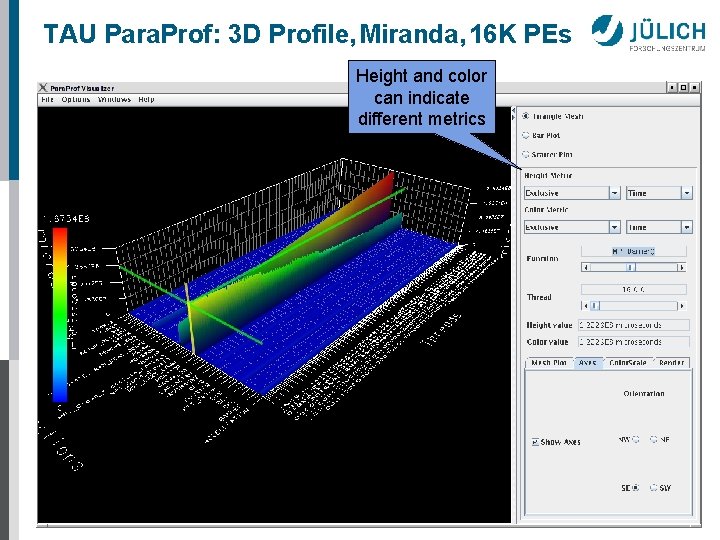
TAU Para. Prof: 3 D Profile, Miranda, 16 K PEs Height and color can indicate different metrics II-100

The Scalasca Project n n Scalable Analysis of Sc Large Scale Applications La Sc Follow-up project to KOJAK http: //www. scalasca. org/ n Approach ¨ Instrument C, C++, and Fortran parallel applications n Based on MPI, Open. MP, SHMEM, or hybrid ¨ Option 1: scalable call-path profiling ¨ Option 2: scalable event trace analysis n Collect event traces n Search trace for event patterns representing inefficiencies n Categorize and rank inefficiencies found n Supports MPI 2. 2 and basic Open. MP

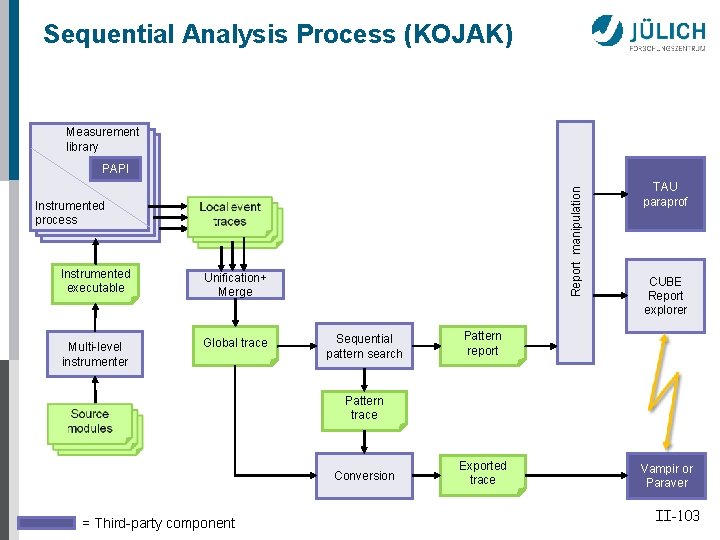
Sequential Analysis Process (KOJAK) Measurement library Report manipulation PAPI Instrumented process Instrumented executable Unification+ Merge Multi-level instrumenter Global trace Sequential pattern search TAU paraprof CUBE Report explorer Pattern report Pattern trace Conversion = Third-party component Exported trace Vampir or Paraver II-103

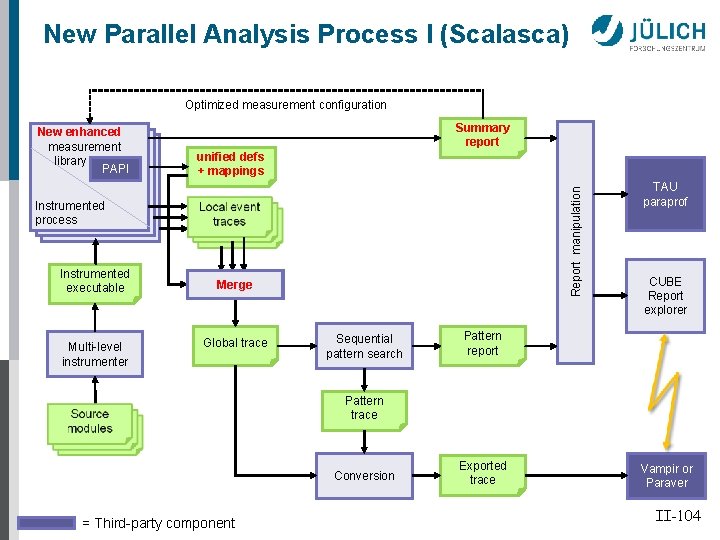
New Parallel Analysis Process I (Scalasca) Optimized measurement configuration Summary report unified defs + mappings Report manipulation New enhanced measurement library PAPI Instrumented process Instrumented executable Unification + Merge Multi-level instrumenter Global trace Sequential pattern search TAU paraprof CUBE Report explorer Pattern report Pattern trace Conversion = Third-party component Exported trace Vampir or Paraver II-104

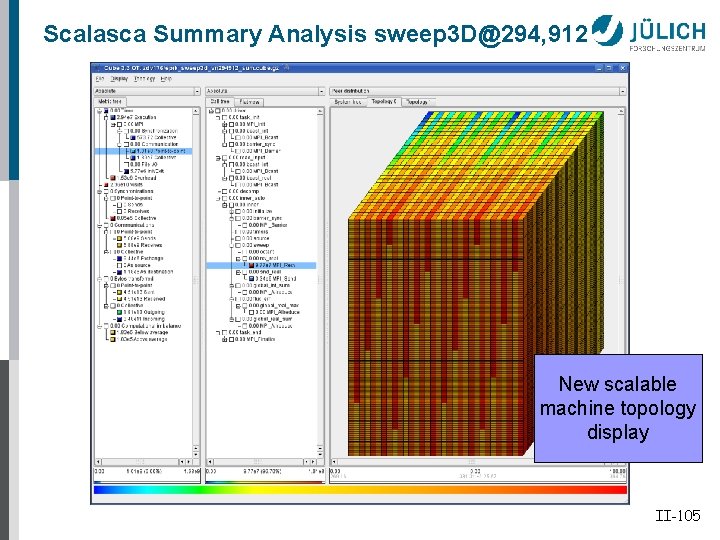
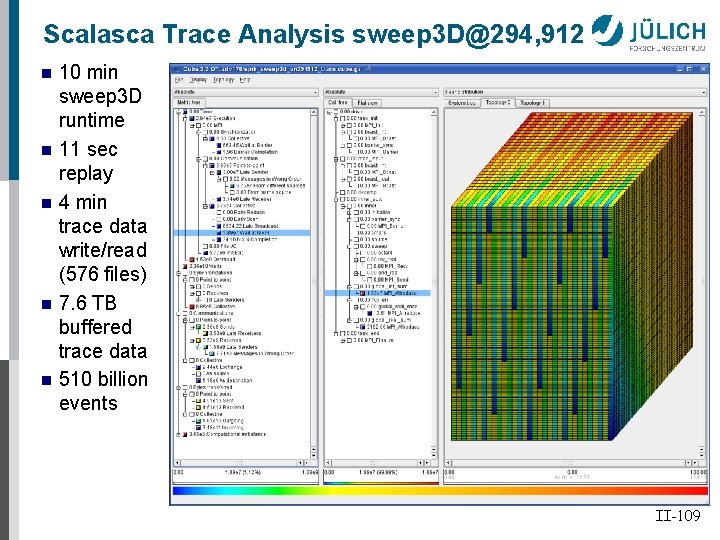
Scalasca Summary Analysis sweep 3 D@294, 912 New scalable machine topology display II-105

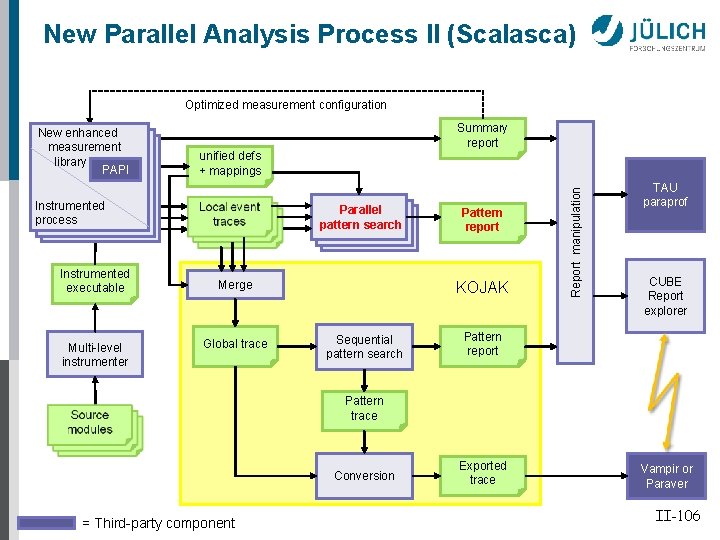
New Parallel Analysis Process II (Scalasca) Optimized measurement configuration Summary report unified defs + mappings Instrumented process Instrumented executable Multi-level instrumenter Parallel pattern search KOJAK Merge Global trace Pattern report Sequential pattern search Report manipulation New enhanced measurement library PAPI TAU paraprof CUBE Report explorer Pattern report Pattern trace Conversion = Third-party component Exported trace Vampir or Paraver II-106

Scalable Automatic Trace Analysis n n n Parallel pattern search to address wide traces ¨ As many processes / threads as used to run the application Can run in same batch job!! ¨ Each process / thread responsible for its “own” local trace data Idea: “parallel replay” of application ¨ Analysis uses communication mechanism that is being analyzed ¨ Use MPI P 2 P operation to analyze MPI P 2 P communication, use MPI collective operation to analyze MPI collectives, . . . ¨ Communication requirements not significantly higher and (often lower) than requirements of target application In-memory trace analysis ¨ Available memory scales with number of processors used ¨ Local memory usually large enough to hold local trace II-107

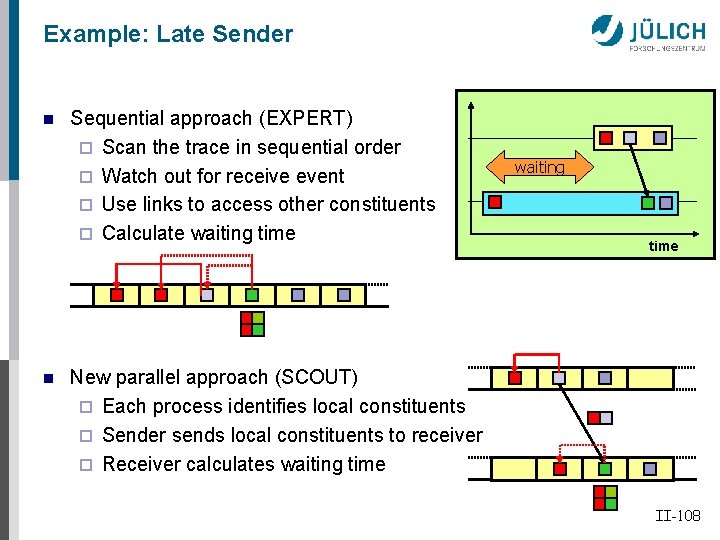
Example: Late Sender n n Sequential approach (EXPERT) ¨ Scan the trace in sequential order ¨ Watch out for receive event ¨ Use links to access other constituents ¨ Calculate waiting time New parallel approach (SCOUT) ¨ Each process identifies local constituents ¨ Sender sends local constituents to receiver ¨ Receiver calculates waiting time II-108

Scalasca Trace Analysis sweep 3 D@294, 912 n n n 10 min sweep 3 D runtime 11 sec replay 4 min trace data write/read (576 files) 7. 6 TB buffered trace data 510 billion events II-109

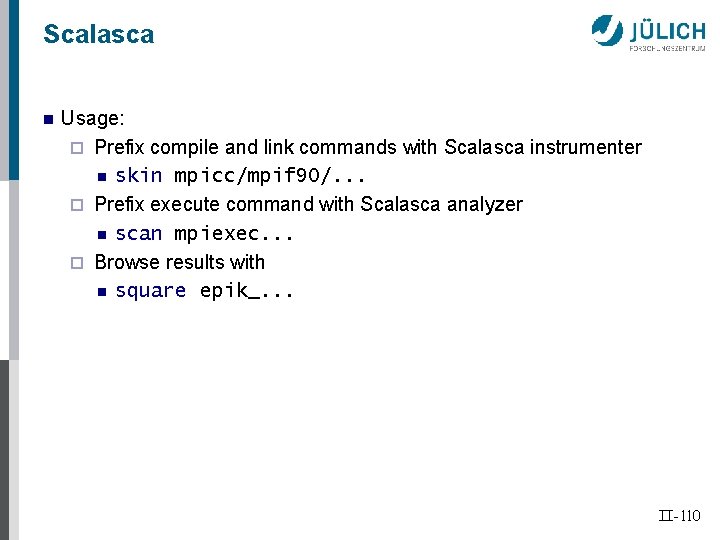
Scalasca n Usage: ¨ Prefix compile and link commands with Scalasca instrumenter n skin mpicc/mpif 90/. . . ¨ Prefix execute command with Scalasca analyzer n scan mpiexec. . . ¨ Browse results with n square epik_. . . II-110

CONTENT § § Fall-back • Simple timers • Hardware counter measurements Overview of some performance tools Practical Performance Analysis and Tuning Challenges and open problems in performance optimization • Heterogeneous systems • Automatic performance analysis: KOJAK/Scalasca • Beyond execution time and flops • Extremely large HPC systems • Tool integration

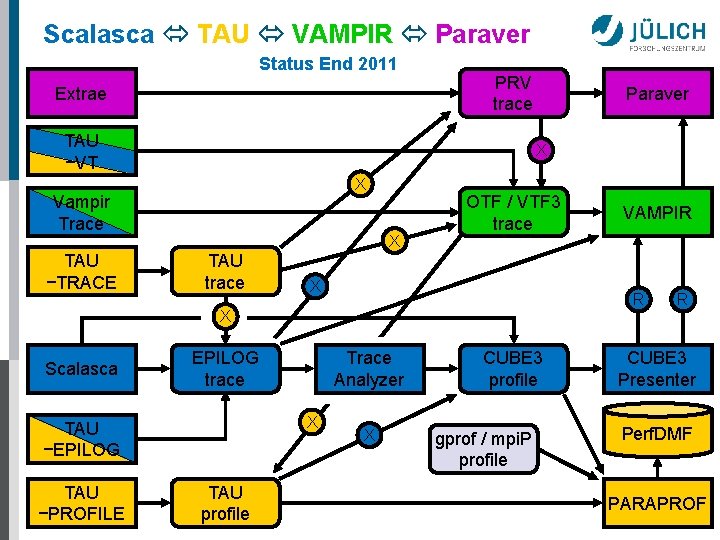
Scalasca TAU VAMPIR Paraver Status End 2011 Extrae PRV trace TAU −VT X X Vampir Trace TAU −TRACE Paraver X TAU trace OTF / VTF 3 trace X R X Scalasca EPILOG trace TAU −PROFILE Trace Analyzer X TAU −EPILOG TAU profile VAMPIR X CUBE 3 profile gprof / mpi. P profile R CUBE 3 Presenter Perf. DMF PARAPROF

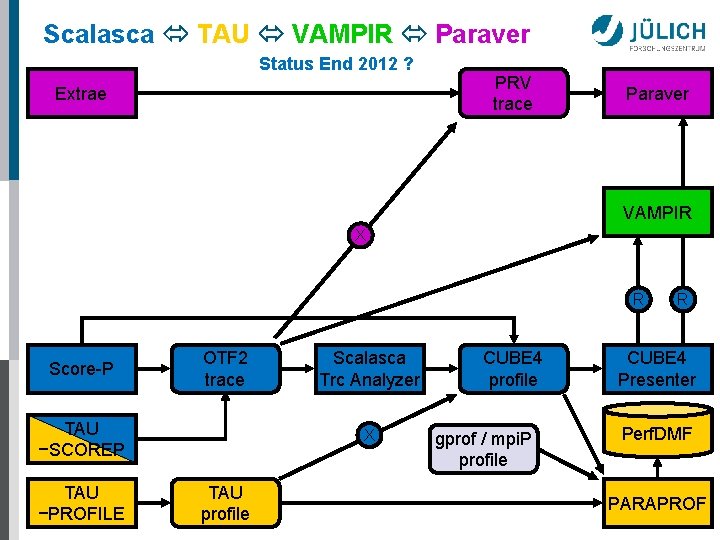
Scalasca TAU VAMPIR Paraver Status End 2012 ? Extrae PRV trace Paraver VAMPIR X R Score-P OTF 2 trace TAU −SCOREP TAU −PROFILE Scalasca Trc Analyzer X TAU profile CUBE 4 profile gprof / mpi. P profile R CUBE 4 Presenter Perf. DMF PARAPROF

Score-P Objectives n n Make common part of Periscope, Scalasca, TAU, and Vampir a community effort ¨ Score-P measurement system Save manpower by sharing resources Invest this manpower in analysis functionality ¨ Allow tools to differentiate faster according to their specific strengths ¨ Increased benefit for users Avoid the pitfalls of earlier community efforts ¨ Start with small group of partners ¨ Build on extensive history of collaboration II-114

Score-P Design Goals n n Functional requirements ¨ Performance data: profiles, traces ¨ Initially direct instrumentation, later also sampling ¨ Offline and online access ¨ Metrics: time, communication metrics and hardware counters ¨ Initially MPI 2 and Open. MP 3, later also CUDA and Open. CL Non-functional requirements ¨ Portability: all major HPC platforms ¨ Scalability: petascale ¨ Low measurement overhead ¨ Easy installation through UNITE framework ¨ Robustness ¨ Open source: New BSD license II-115

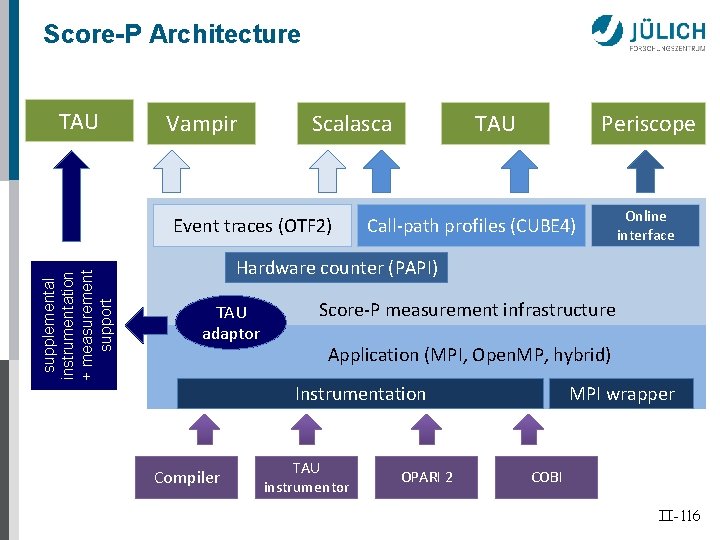
Score-P Architecture TAU Vampir Scalasca supplemental instrumentation + measurement support Event traces (OTF 2) TAU Periscope Call-path profiles (CUBE 4) Online interface Hardware counter (PAPI) TAU adaptor Score-P measurement infrastructure Application (MPI, Open. MP, hybrid) Instrumentation Compiler TAU instrumentor OPARI 2 MPI wrapper COBI II-116

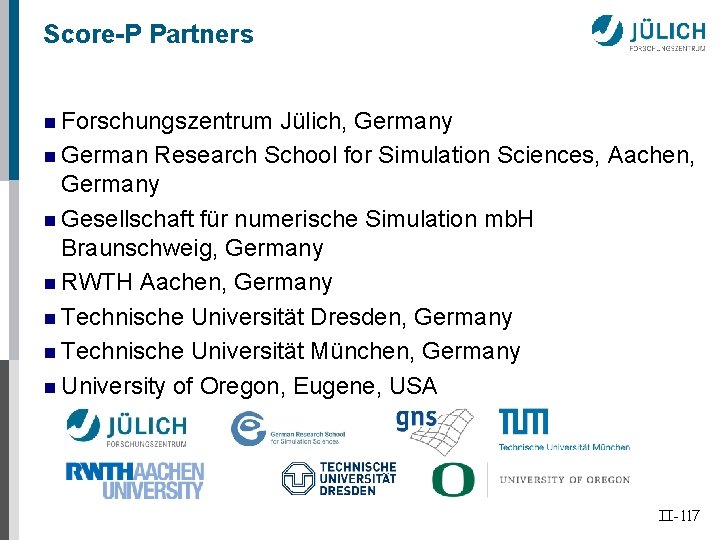
Score-P Partners n Forschungszentrum Jülich, Germany n German Research School for Simulation Sciences, Aachen, Germany n Gesellschaft für numerische Simulation mb. H Braunschweig, Germany n RWTH Aachen, Germany n Technische Universität Dresden, Germany n Technische Universität München, Germany n University of Oregon, Eugene, USA II-117

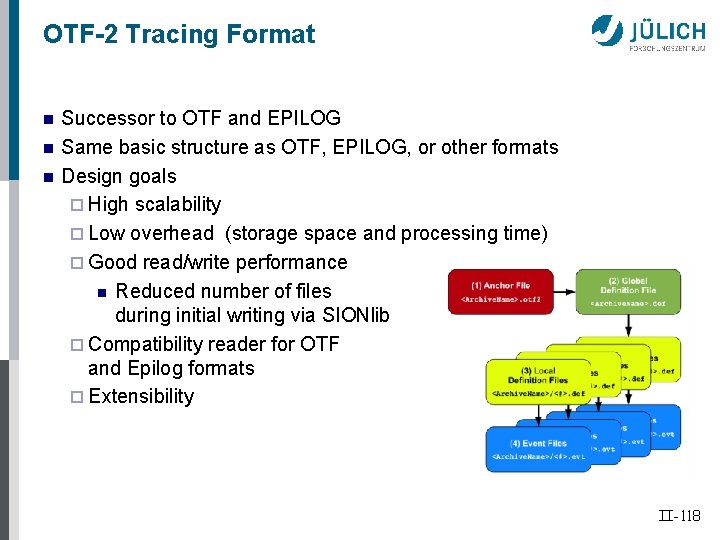
OTF-2 Tracing Format n n n Successor to OTF and EPILOG Same basic structure as OTF, EPILOG, or other formats Design goals ¨ High scalability ¨ Low overhead (storage space and processing time) ¨ Good read/write performance n Reduced number of files during initial writing via SIONlib ¨ Compatibility reader for OTF and Epilog formats ¨ Extensibility II-118

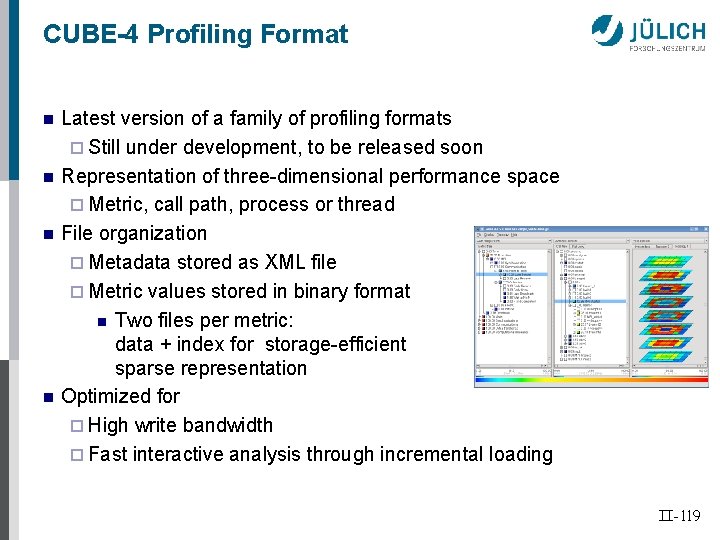
CUBE-4 Profiling Format n n Latest version of a family of profiling formats ¨ Still under development, to be released soon Representation of three-dimensional performance space ¨ Metric, call path, process or thread File organization ¨ Metadata stored as XML file ¨ Metric values stored in binary format n Two files per metric: data + index for storage-efficient sparse representation Optimized for ¨ High write bandwidth ¨ Fast interactive analysis through incremental loading II-119

Summary: The Need for Integration n Successful performance analysis requires to use the right tool for the right purpose ¨ We need well-defined performance analysis workflows ¨ We need tightly integrated tool sets n Score-P Status and Future Plans ¨ Release of beta version at SC 11 n http: //www. score-p. org/ ¨ Future extensions n Heterogeneous computing (EU ITEA 2 H 4 H project) n Time-series profiling (EU HOPSA + BMBF LMAC projects) n Sampling (BMBF LMAC project) II-120

Performance Tuning: Still a Problem? ols To rial to Tu [ Slide left intentionally blank ] II-121

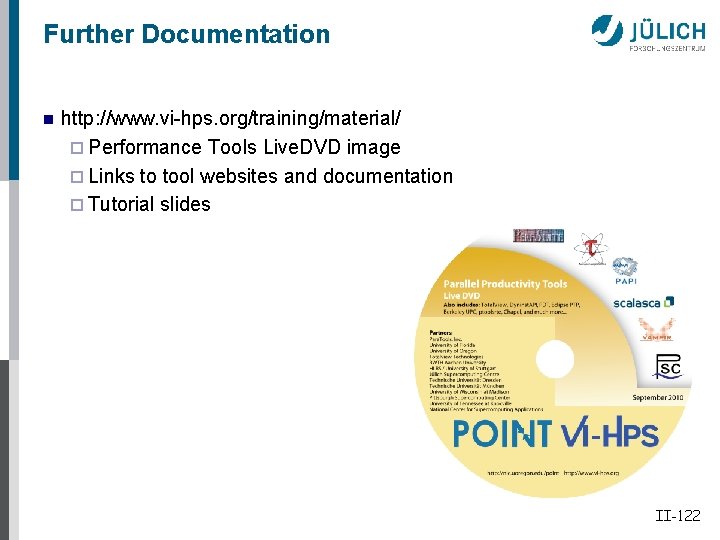
Further Documentation n http: //www. vi-hps. org/training/material/ ¨ Performance Tools Live. DVD image ¨ Links to tool websites and documentation ¨ Tutorial slides II-122