International Symposium On Smart Aging 2011 Presentation 1


 National Institute")


 National Institute of Population")


![(Ten thousand Units) Owned Rental Total Floor Size Data) Housing and Land Survey [MIC],](https://slidetodoc.com/presentation_image/03c6bc06922865c9eadfa1056331f697/image-21.jpg "(Ten thousand Units) Owned Rental Total Floor Size Data) Housing and Land Survey [MIC],")


 Goal (2020) Basic Level of")


")


 International Symposium On Smart Aging 2011")


 Baby Boom Before Baby")


 PIR (Price to income ratio) & RIR(Rent to income ratio) the 5. 6")

 Before Baby Generation Boom")
 Measures to Plan Living Expenses for Post-Retirement pension as the most effective method")
 After Baby Boom Category Move to Other Houses Generation Before Baby")


 Living Cost (B) Housing Cost (C) C/A C/B Self-own 339. 0")


- Slides: 129
International Symposium On Smart Aging 2011 Presentation 1 Aging and housing policies for Baby boomers in Japan 일본 베이비부머 세대의 고령화와 주택정책 주거분야 Akashi, Tatsuo Director, City Planning Research Division, National Institute for Land Infrastructure Management, (NILIM), MLIT, Government of Japan 1
Tatsuo Akashi 明石達生 International Symposium On Smart Aging 2011 Aging of Baby Boomer Generation & Housing Policy in Japan My presentation consists of … 1. Characteristic of Aging of Society in Japan, in relation to Baby Boomer Generation 2. How the Housing Policy is Changing recently, in relation to Aging of Society in Japan 3
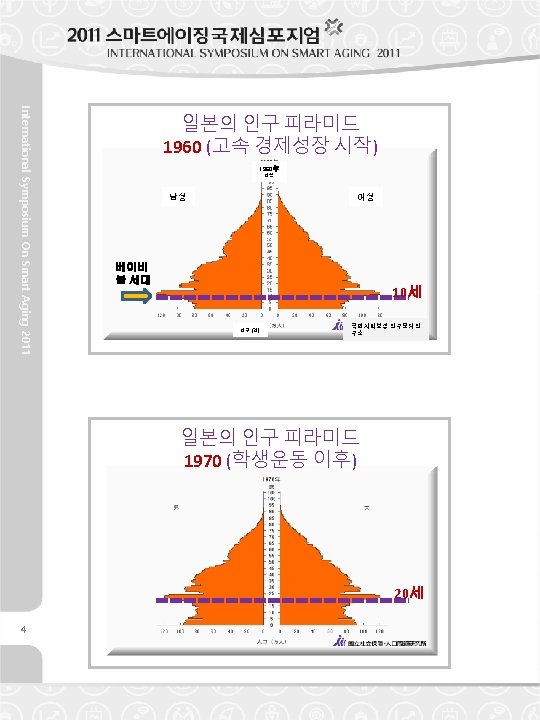
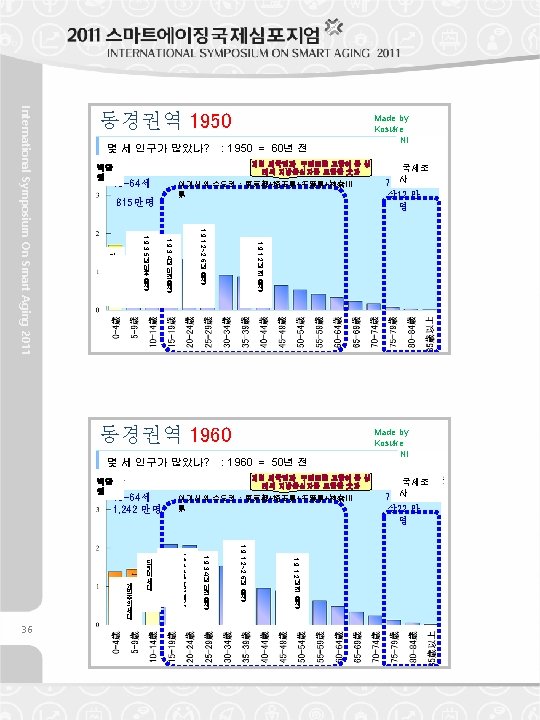
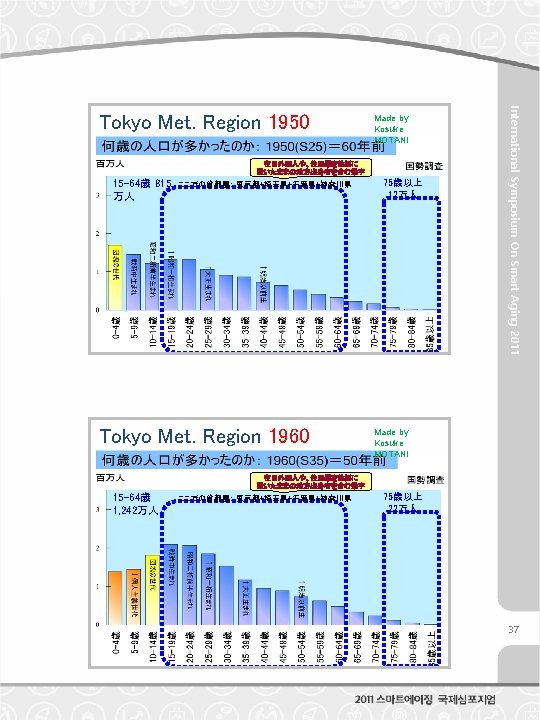
1960年 Age Male Female Baby Boomer s Age 10 Population (ten thousand) National Institute of Population and Social Security Research International Symposium On Smart Aging 2011 Population Pyramid of Japan 1960 (High Economic Growth Started) Population Pyramid of Japan 1970 (after Student Movements) Age 20 5
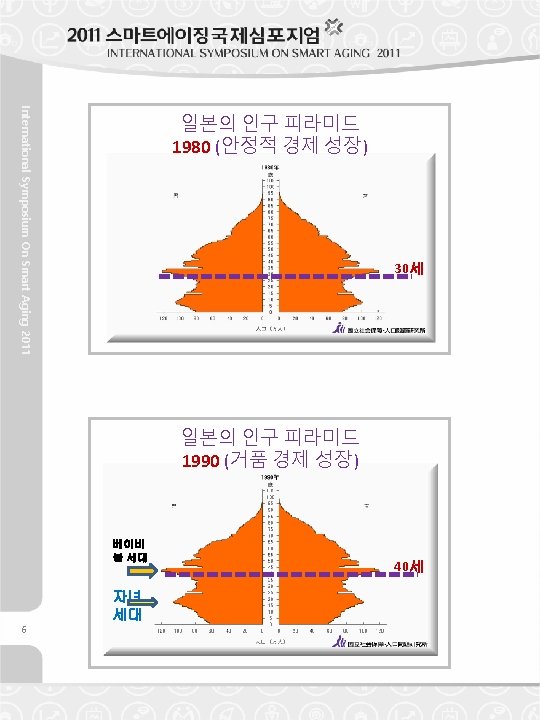
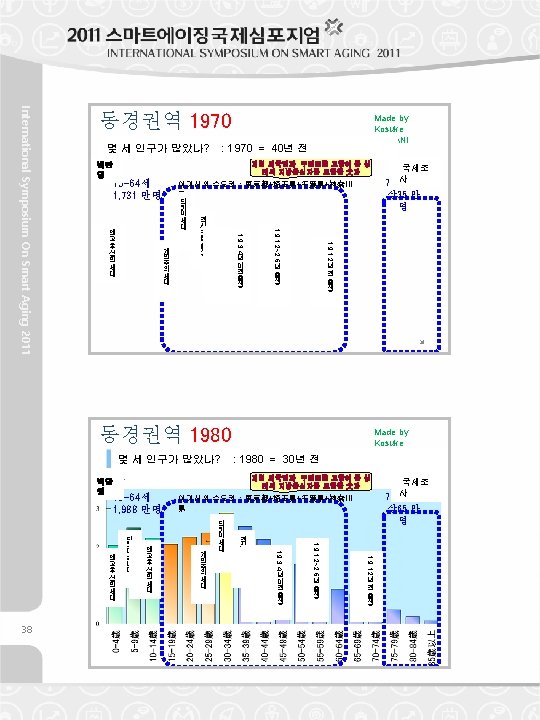
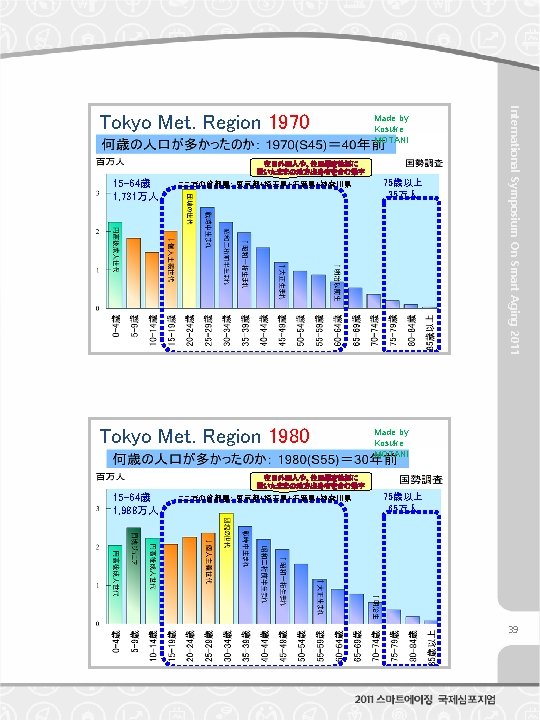
Age 30 International Symposium On Smart Aging 2011 Population Pyramid of Japan 1980 (Stable Economic Growth) Population Pyramid of Japan 1990 (Bubble Economic Booming) Baby Boomer s B. B. J r. Age 40 7
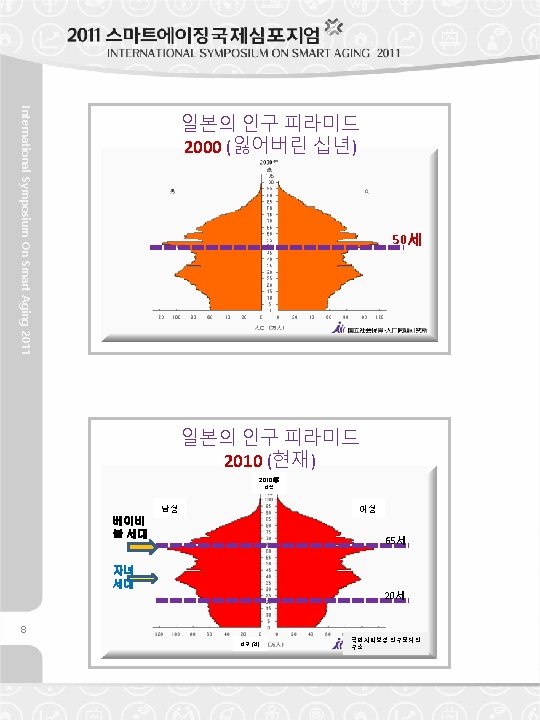
Age 50 International Symposium On Smart Aging 2011 Population Pyramid of Japan 2000 (Lost Decades) Population Pyramid of Japan 2010 (Current) 2010年 Age Baby Boomer s Male Female Age 65 B. B. Jr. Age 20 9 Population (ten thousand) National Institute of Population and Social Security Research
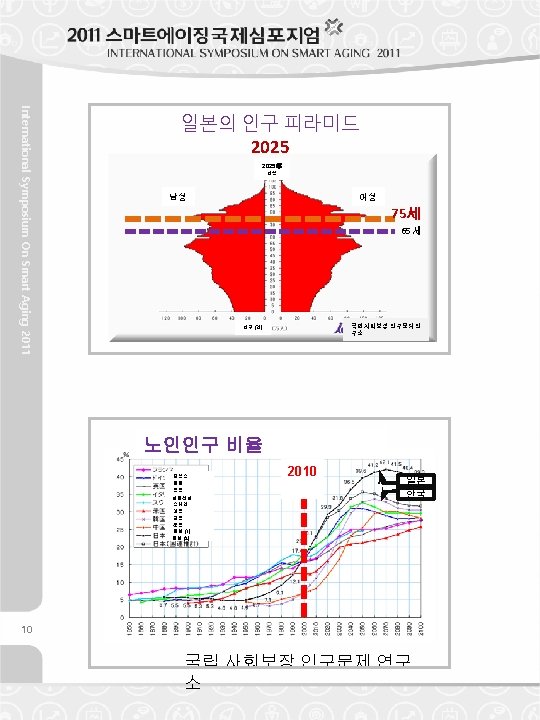
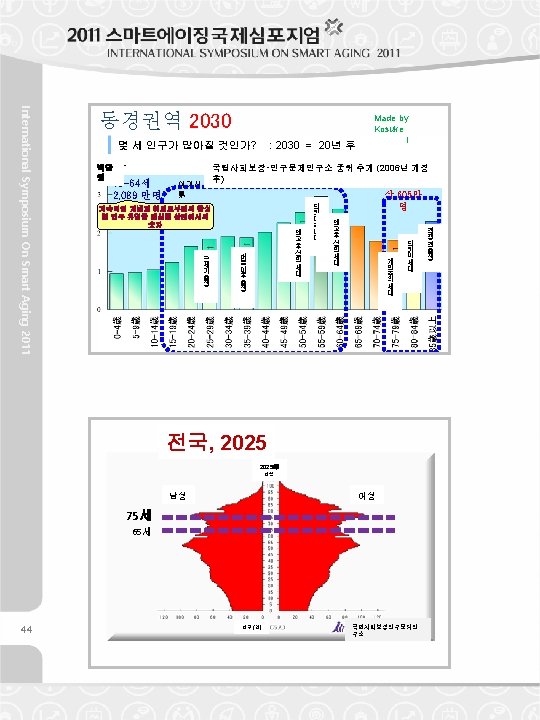
2025年 Age Male Female Age 75 65 Population (ten thousand) National Institute of Population and Social Security Research International Symposium On Smart Aging 2011 Population Pyramid of Japan 2025 Aged Population Rates France Germany United Kingdom Italy Sweden USA Korea China Japan (1) Japan (2) 2010 Japa n Kore a 11 By National Institute of Population and Social Security Research
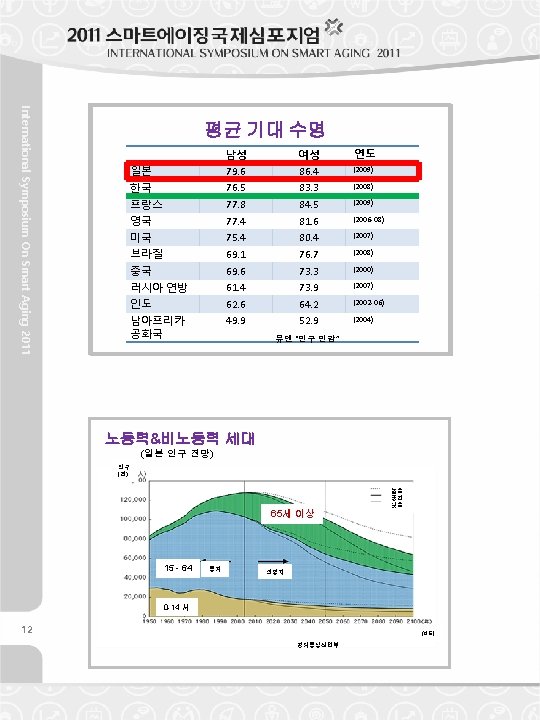
International Symposium On Smart Aging 2011 Average Life Expectancies Male Female Year Japan 79. 6 86. 4 (2009) Korea 76. 5 83. 3 (2008) France 77. 8 84. 5 (2009) U. K. 77. 4 81. 6 (2006 -08) U. S. 75. 4 80. 4 (2007) Brazil 69. 1 76. 7 (2008) China 69. 6 73. 3 (2000) Russian Fed. 61. 4 73. 9 (2007) India 62. 6 64. 2 (2002 -06) South Africa 49. 9 52. 9 (2004) UN ‘Demographic Yearbook’ Labor Force & Non Labor Force Generations (Perspective of Population in Japan) Population (Thousand) More than 65 15 - 64 Statistics High Middl e Low Estimate 0 -14 Years Old (Year) by Ministry of Economy, Trade and Industry 13
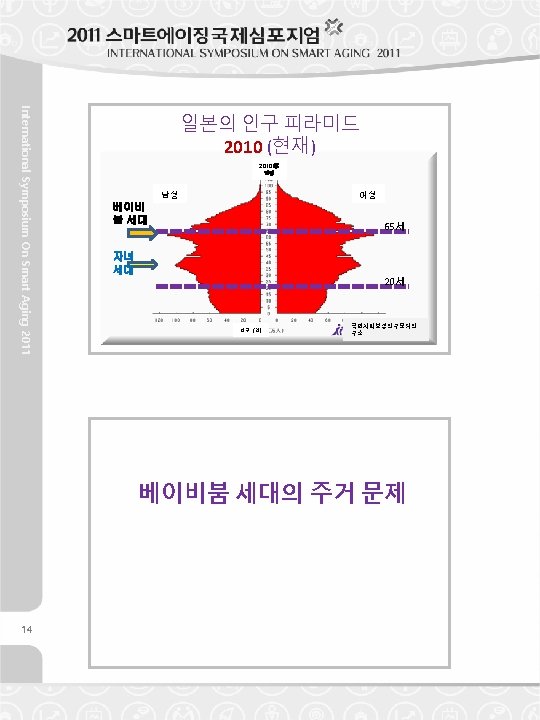
2010年 Age Baby Boomer s Male Female Age 65 B. B. Jr. Age 20 Population (ten thousand) National Institute of Population and Social Security Research International Symposium On Smart Aging 2011 Population Pyramid of Japan 2010 (Current) Housing Issues of Baby Boomer Generation 15
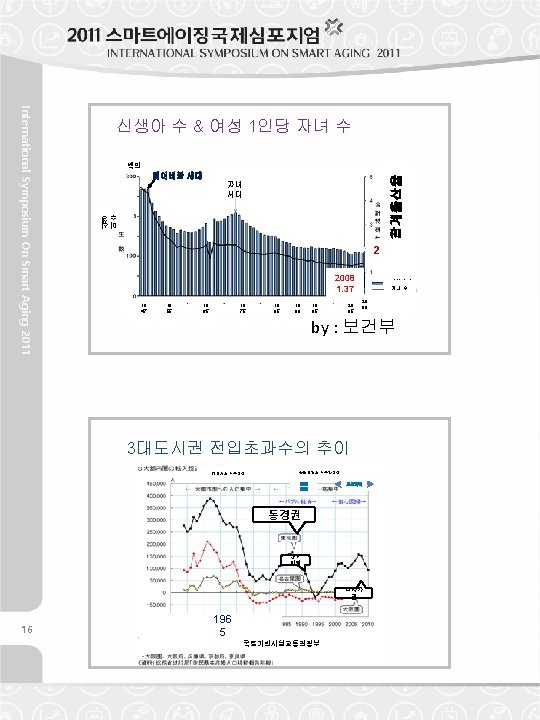
Million Total Fertility Rates B. B. Jr. Number of Births Baby Boomers 2 2008 1. 37 19 47 19 55 19 65 19 75 19 85 19 90 19 95 20 05 Birth Pop. Num. of Children 20 08 by : Ministry of Health International Symposium On Smart Aging 2011 Birth Population & Number of Children by One Woman Exceed Immigrants into Metropolitan Regions Overconcentration in Tokyo area Concentration of population in metropolitan Bubbl e econo my Regressi on city Tokyo Met. Nagoy a Met. Osaka Met. 196 5 17 by : Ministry of Land, Infrastructure, Transport and Tourism
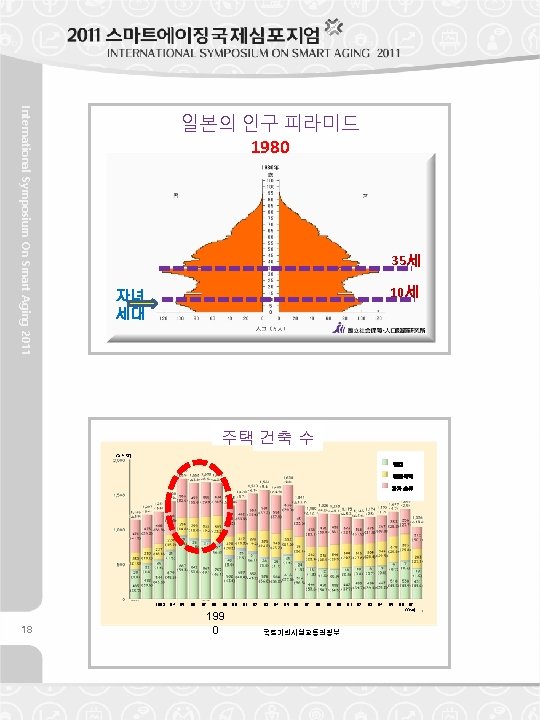
Age 35 Age 10 B. B. J r. International Symposium On Smart Aging 2011 Population Pyramid of Japan 1980 Number of Constructed Housing Units (Thousand Units) Rental Built to sell Owned 1983 ‘ 84 ‘ 85 ‘ 86 ‘ 87 ‘ 88 ’ 89 199 0 ‘ 90 ’ 91 ‘ 92 ‘ 93 ‘ 94 ‘ 95 ‘ 96 ‘ 97 ‘ 98 ‘ 99 ‘ 00 ‘ 01 ‘ 02 ‘ 03 ‘ 04 ‘ 05 ‘ 06 ’ 07 (Year) by : Ministry of Land, Infrastructure, Transport and Tourism 19
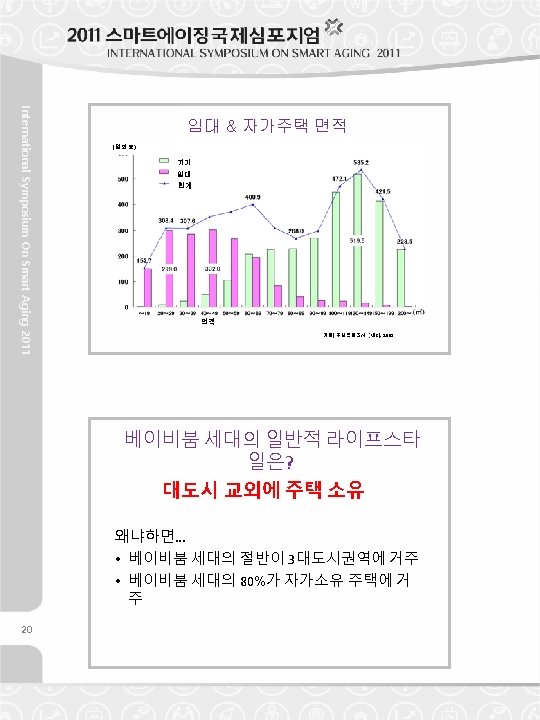
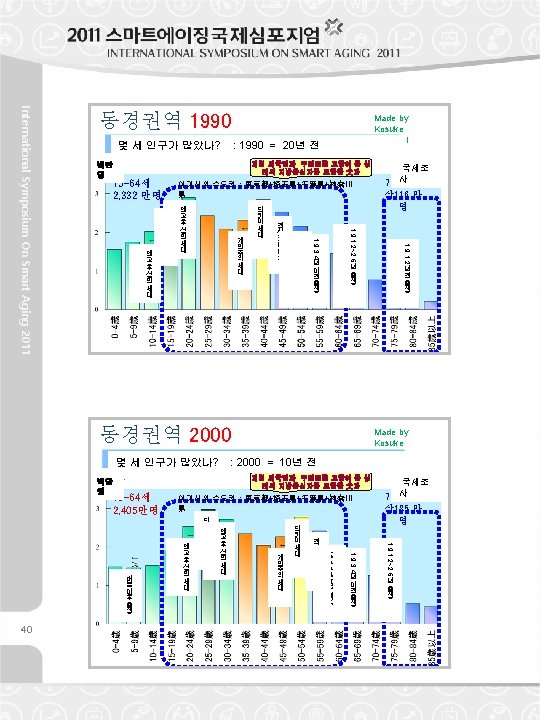
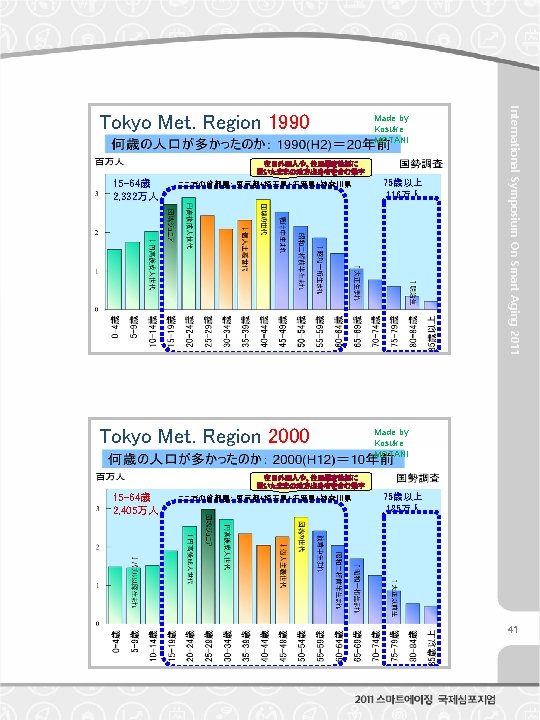
(Ten thousand Units) Owned Rental Total Floor Size Data) Housing and Land Survey [MIC], 2003 International Symposium On Smart Aging 2011 Floor Size of Rental & Owned Housing What’s the Typical Lifestyle of Baby Boomers? Owned House in the Suburbs of Met. Because… • Half of the Baby Boomers are living in the three Metropolitan Regions. • About 80% of Baby Boomers are living in their ownership house. 21
22 International Symposium On Smart Aging 2011 22 대도시 교외 자가주택의 예 구도시가 된 예전 신도시들
23 International Symposium On Smart Aging 2011 Example of Owned House in the Suburbs of Met. Former NEW TOWNS as OLD TOWNS 23
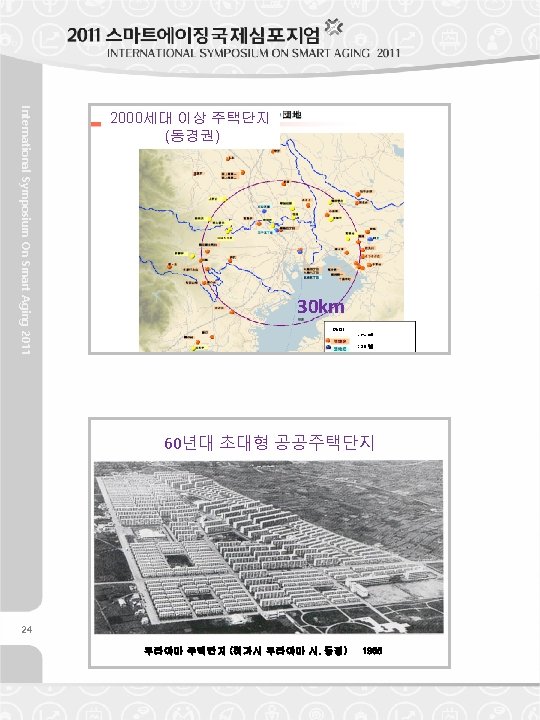
30 km 【Legend】 : 50 Years Old : 40 Years Old : 30 Years Old International Symposium On Smart Aging 2011 Housing Estates with more than 2, 000 Units (Tokyo Met. Region) Mega sized public housing estate in 1960 s 25 Murayama housing (Higashi Murayama city Tokyo met. ) 1965
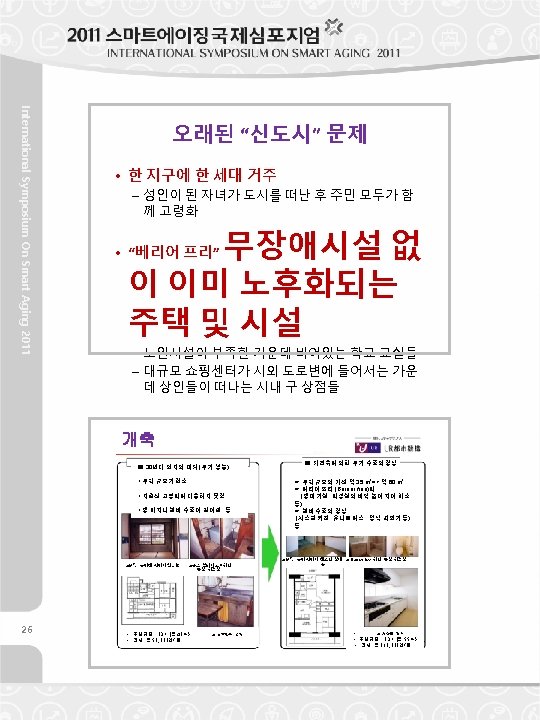
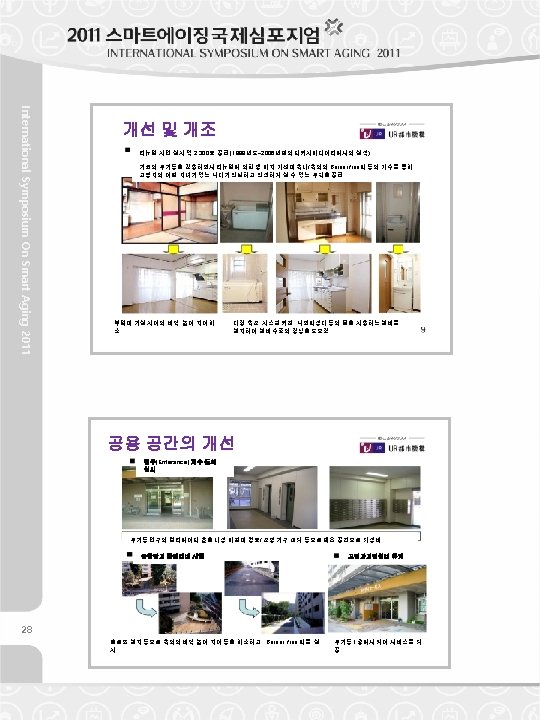
• Same Generation in the Same District – All the Residents goes on Aging at the same time, after grown up children had gone out of the town • Houses & Facilities are getting Old as well, without “Barrier Freed” – Schools got Empty Rooms, while Facilities for Elders are Not Sufficient – Old Shops become Vacant, while New Large Stores build Out of Town Roadsides International Symposium On Smart Aging 2011 Old “New Town” Issues Rebuilding 27
International Symposium On Smart Aging 2011 Renewal & Refurbishment Renewal in Common Spaces 29
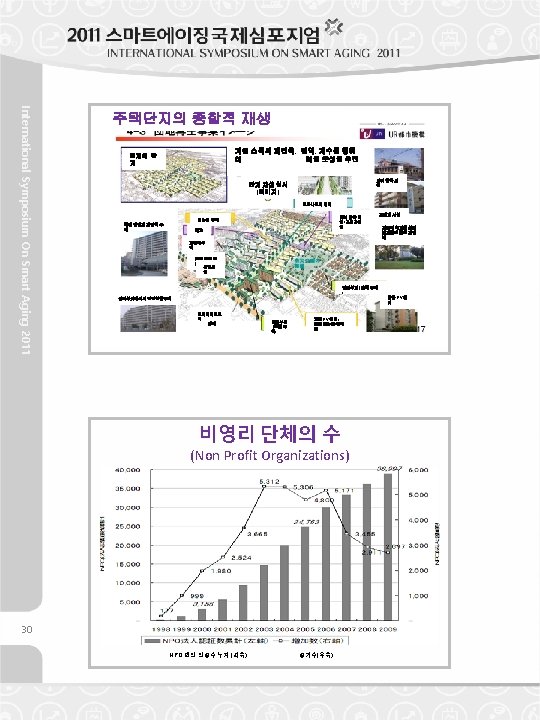
International Symposium On Smart Aging 2011 Comprehensive Regeneration of Housing Estates Number of NPOs (Non Profit Organizations) 31
International Symposium On Smart Aging 2011 Housing Policy & coming Super Aged Society Housing Standards of Japan p Minimum Housing Standard: – 10㎡ × household members +10㎡ • Singles: 25㎡ p Desirable Housing Standard (Urban) : – 20㎡ × household members +15㎡ • Singles: 40㎡ p Desirable Housing Standard (General) : – 25㎡ × household members +25㎡ • Singles: 55㎡ 33
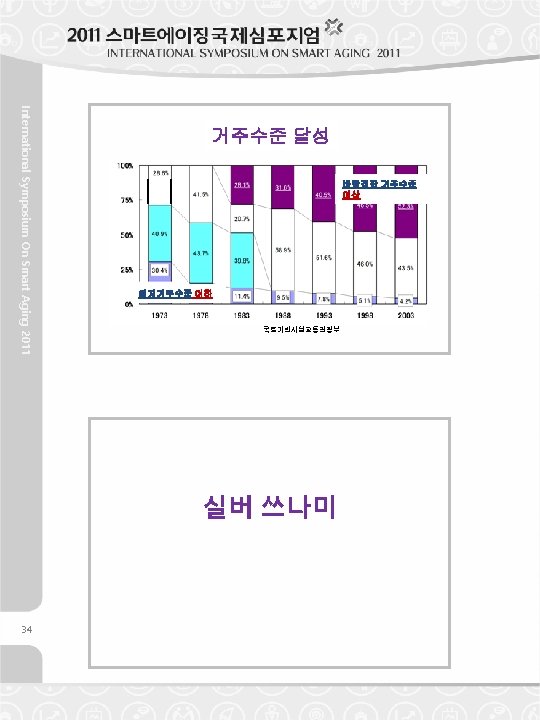
More than Desirable Housing Standard Less than Minimum Housing Standard by : Ministry of Land, Infrastructure, Transport and Tourism International Symposium On Smart Aging 2011 Achievement of Housing Standard SILVER TSUNAMI 35
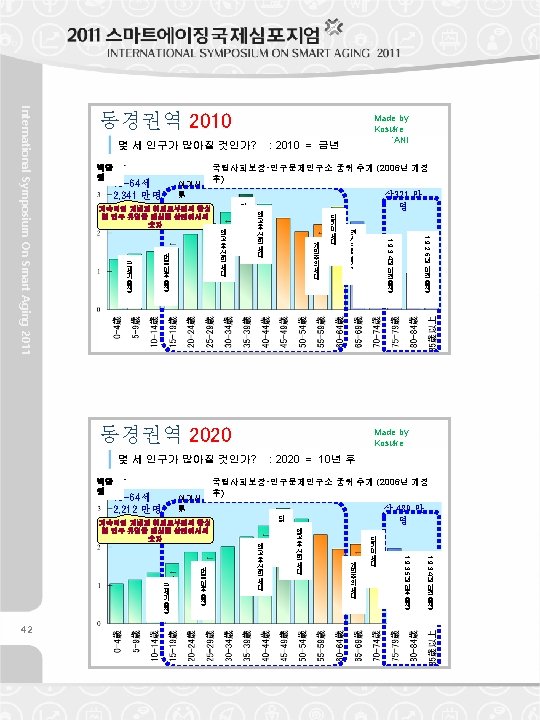
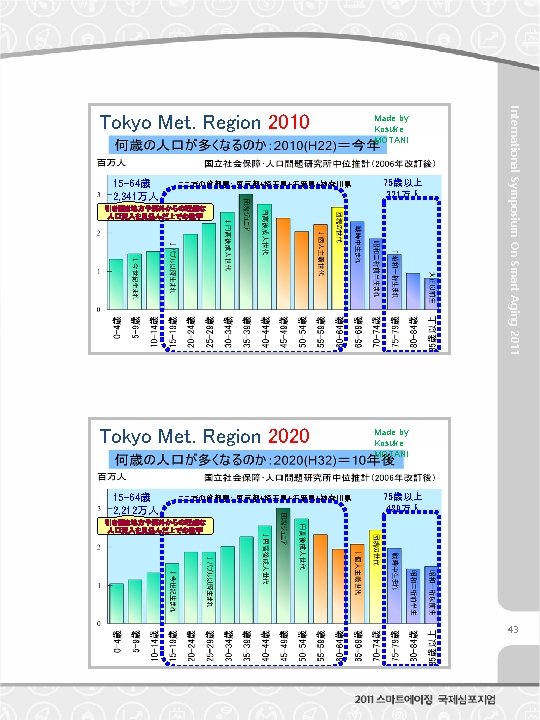
15 -64歳 2, 089万人 Made by Kosuke MOTANI ここでの首都圏: 東京都+埼玉県+千葉県+神奈川県 75歳以上 605万人 引き続き地方や海外からの旺盛な 人口流入を見込んだ上での数字 45 International Symposium On Smart Aging 2011 Tokyo Met. Region 2030 the Whole Nation, 2025年 Age Male Female Age 75 65 Population (ten thousand) National Institute of Population and Social Security Research 45
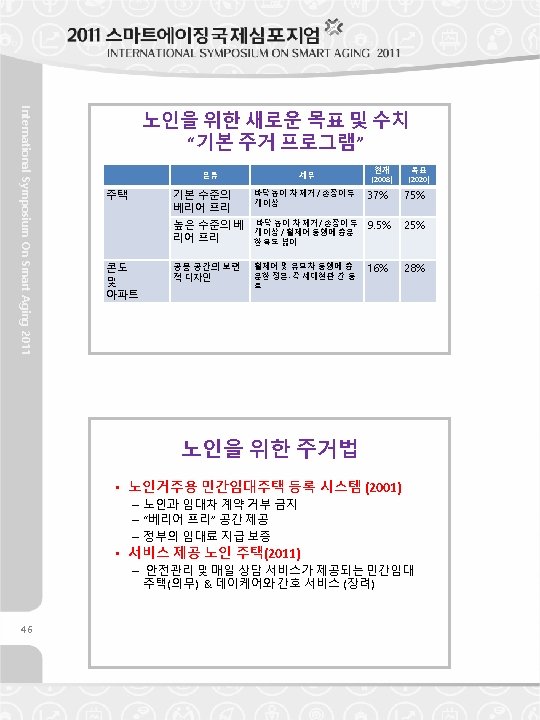
Categories Housing Units Condominiums & Apartments Detail Current (2008) Goal (2020) Basic Level of Barrier-Freed with no difference level of floor or with more than two handrails 37% 75% Higher Level of Barrier-Freed with no difference level of floor, with more than two handrails and width of corridor that available to a wheelchair 9. 5% 25% Universal Design in Common Spaces with sequentially passage available for a wheelchair and a baby buggy from road front entrance to unit entrance 16% 28% International Symposium On Smart Aging 2011 New Goals & Indicators for Elders “Basic Program for Housing” Housing Law for Elderly People • Registration System of Private Rental Housing for Elders (2001) – Not Refuse the Rental Contract with Aged People – With Barrier Freed Rooms – Rent Guarantee by Government is Available • Housing for Elders with Supportive Services (2011) – Private Rental Housing with Safety Watch & Daily Consultation (obliged), & with Day Care or Nursing Service (facilitated) 47
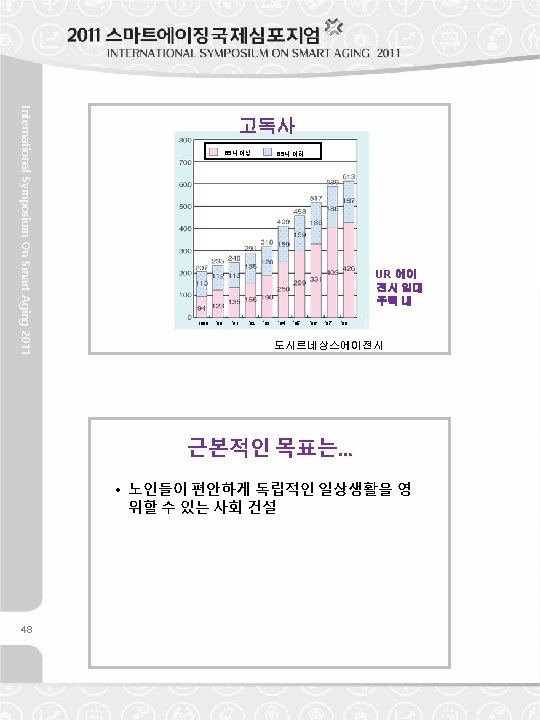
Over 65 years Under 65 years in UR Agency Rental Housing 1999 ’ 00 ‘ 01 ‘ 02 ‘ 03 ‘ 04 ‘ 05 ‘ 06 ‘ 07 ‘ 08 by Urban Renaissance Agency International Symposium On Smart Aging 2011 Solitude Death The Fundamental Goal would be… • to build a society that aged people is able to enjoy their own daily life independently with comfort 49
International Symposium On Smart Aging 2011 50 감사합니다!
International Symposium On Smart Aging 2011 Thank you! 51
International Symposium On Smart Aging 2011 Memo 52 Memo
Memo International Symposium On Smart Aging 2011 Memo 53
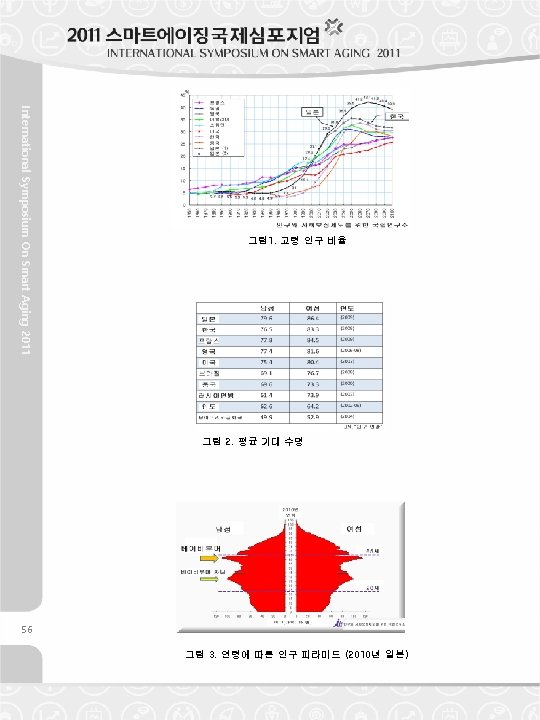
International Symposium On Smart Aging 2011 Aging of Baby Boomers and Housing Policy in Japan Tatsuo AKASHI (Institute for Land Infrastructure Management, Japan) 1. Transition of Aged Population Rate in Japan In Japan, Aged Population Rate, which means the rate of more than 65 years old people, have reached up to 23. 1% in 2010. This is the highest rate in the world, as much as approximately double of Korean Another outstanding characteristic of Japan’s aging is its fast speed. Average approximately 0. 6% per year is the fastest speed that was never seen before in the human history. However, Korea is soon expected to experience same fast speed as Japan This rapid increase has been and will be sure to lead the society change that is not returnable. Aging in Japan has one of the highest records in the world, which is average life expectancy. According to Ministry of Health, Labour and Welfare of Japan (MHLW), it is estimated as 79. 6 years for male and 86. 4 years for female in 2009, which is the world longest. However, Korea is also enjoying long life, whose average life expectancy is 76. 5 years for male and 83. 3 for female in 2008. I’m glad this is quite amazing and happy fact for both countries. Although aging issues are important, I suppose that more significant change of Japan’s economy in near future is the decrease of work force population, or labor age generation. Number of baby boomer generation is 2, 250 thousand per year, while number of young generation around 20 years old is only 1, 200 thousand per year. So that it is simply estimated by subtraction that decreasing of labor force generation would be reached approximately one million, and as much non labor force generation would be increased. Therefore, it may be supposed that telling the small stable number of the unemployment rate in Japan does not make much sense. It should be paid more attention to the potential problem that expected decrease of large amount of labor force generation and much more increase of non labor force generation. This fact is more essential and significant, I suppose. 55
International Symposium On Smart Aging 2011 Fig. 1: Aged Population Rates Fig. 2: Average Life Expectancies 57 Fig. 3: Population Pyramid by Ages (Japan, 2010)
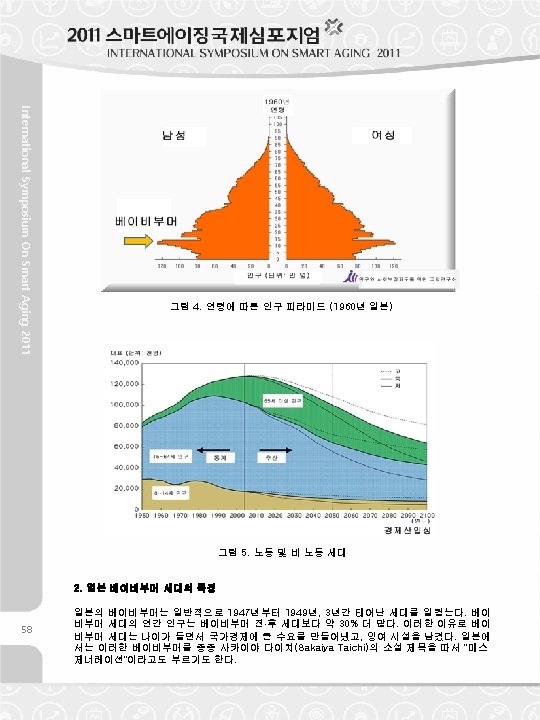
International Symposium On Smart Aging 2011 Fig. 4: Population Pyramid by Ages (Japan, 1960) Fig. 5: Labor Force & Non Labor Force Generation 2. Characteristics of Baby Boomer Generation in Japan In Japan, baby boomers mean the generation who bone during three years from 1947 to 1949 in general. The baby boomer generation has approximately 30% extra population per year than the nearby generations, and that is why they always have been producing large amount of demand to the national economy as they grew older, as well as leaving surplus facilities after they passed. The baby boomers are often called in Japan as “the Mass Generation”, according to the title of a novel written by Taichi Sakaiya. 59
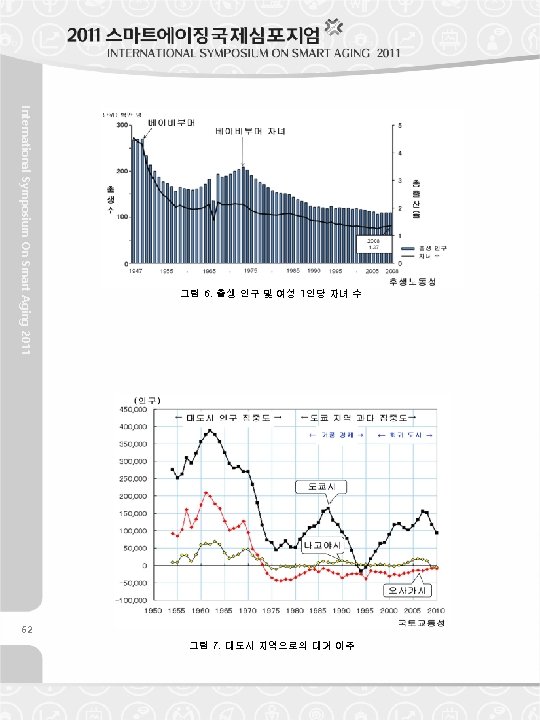
International Symposium On Smart Aging 2011 There are some other interesting characteristics on baby boomers, other than the amount of population. Firstly, they have large number of brothers and sisters. Seeing the transition of total fertility rate, which means average number of babies that a woman give birth to through her life, it was more than 4 babies in the years when baby boomers were bone. Thinking of the fact simply, they have four brothers or sisters in average. The number exceeds the number of their parents so that it can be said that they naturally had potential demand of new housing. Secondly, we should pay attention to the fact that coincidently the years when they were young and the years when the huge immigration into cities from countries were approximately same. When the age that baby boomers were in their childhood, larger amount of people were lived in countryside. High economic growth which stated since 1960 s developed and expanded the metropolitan urban areas where factories, offices and educations are concentrated, and they absorbed huge amount of young population into there. Being excess population in the countryside, they left their hometowns to take the opportunity of getting a job or admission of school, moved to the metropolises. Actually, about half of baby boomer population has been stayed in the three major metropolitan regions until now. Thirdly, the generation of baby boomer juniors was produced by them. The junior generation, which was born around from 1971 to 1974, also forms a population peak, though a little smaller than their parent generation. Currently, they are in their latter half of 30 s. Concerning to housing demand, in the latter half of 1980 s, when the junior generation was in their adolescent of high teen age and required their own bedrooms, there occurred a housing construction boom. Housing market in Japan has a interesting characteristics that there are distinctive floor size gap between rental housing and owned housing. As the result of that, large number of baby boomer families in the metropolitan regions bought their larger house in the suburbs. Currently, half of the baby boomers are living in the three major metropolitan regions, and approximately 80% of them are in their owned house. It could be said that “living in their owned house in the suburb of metropolis” is one of typical lifestyle of the baby boomers. However, and importantly, the junior generation has not produced their babies, which is different fo their parent generation. Recently, total fertility rate in Japan has been less than 1. 5. As the result, “Declining Children” emerged as a big social problem in addition to the “Aging”. The shape of population pyramid has been distorted much more. It creates inevitable social and economic problems for national policies in the long run, with long succession to the future. 61
International Symposium On Smart Aging 2011 Fig. 6: Birth Population & Number of Children by One Woman 63 Fig. 7: Exceed Immigrants into Metropolitan Regions
International Symposium On Smart Aging 2011 그림 9. 임대 및 자가 주택 면적 64 그림 8. 건설 된 주택 수
International Symposium On Smart Aging 2011 Fig. 8: Number of Constructed Housing Units Fig. 9: Floor Size of Rental & Owned Housing 65
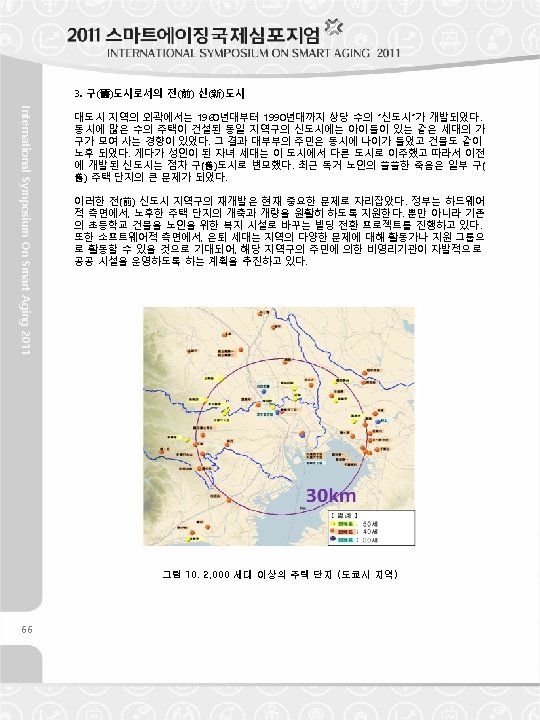
International Symposium On Smart Aging 2011 3. Former New Towns as Old Towns In suburban areas of metropolitan regions, considerable number of “New Town” was developed since 1960 s. to 1990 s. The New Towns tended to gather families of same generation with children in the same district where large amount of houses were constructed at the same time. As the result of that, most of the residents became aged at the same time, as buildings became aged as well. In addition, grown up child generation has moved out of the town so that the former New Towns has turned into the Old Towns. Recently, solitude death of single aged people has become a big problem in some of the old housing estates. Regeneration of the former New Town districts became a critical issue now. The government facilitates rebuilding and reforming of aged housing estates as hardware issues, as well as building conversion projects from former elementary schools to welfare facilities for elders are progressed. As software issues, retired generation are expected to be activists or supportive groups on various community issues so that the trials such as a nonprofit organization by the residents voluntarily commits operation of public facilities in the district are promoted. Fig. 10: Housing Estates with more than 2, 000 Units (Tokyo Met. Region) 67
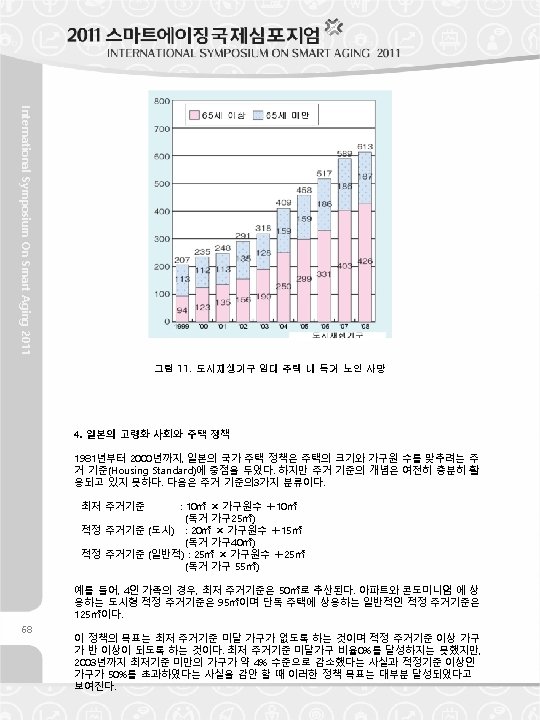
4. Aging Society and Housing Policies in Japan During the last two decades of the last century, national housing policy in Japan focused on the achievement of the Housing Standard, which aims matching both size of housing unit and family. The concept of the Housing Standard is still underused, which consists of three categories below. Minimum Housing Standard : 10㎡ × household members +10㎡ (25㎡ for singles) Desirable Housing Standard (Urban) : 20㎡ × household members +15㎡ (40㎡ for singles) Desirable Housing Standard (General) : 25㎡ × household members +25㎡ (55㎡ for singles) Calculating by a four member family for example, the Minimum Housing Standard is estimated as 50 square meters, the Desirable Housing Standard for Urban Type which corresponds to apartment and condominium units is 95 square meters, and the Desirable Housing Standard for General Type which correspond to detached housing units is 125 square meters. The goals of the policy were no family with under the Minimum Housing Standard and more than a half of families with more than the Desirable Housing Standard. The goals are considered to be mostly achieved, with the facts that families under the Minimum Standard decreased to around 4% level, though it is eternally not able to achieve complete 0%, and families over the Desirable Standard were exceeded 50% until 2003. International Symposium On Smart Aging 2011 Fig. 11: Solitude Death in UR Agency Rental Housing 69
International Symposium On Smart Aging 2011 Starting 21 century, the goals of the national housing policy has moved into diversified quality goals, in which the goals relates to aged people are to be focusing points. For example, concerning “barrier-freed” housing, which means impediment removal, the goals and indicators are established in “the Basic Program for Housing (National)” under the Basic Law for Housing, such as increase the rate of houses with the basic level of barrier-freed (which is with no difference level of floor or with more than two handrails) to more than 75% until 2020 (37% in 2008) and also increase the rate of houses with the higher level of barrier-freed (which is with no difference level of floor, with more than two handrails and width of corridor that available to a wheelchair) to more than 25% until 2020 (9. 5% in 2008). Also, as a goal rerates to universal design, it was set to increase the rate of apartment and condominium houses with sequentially passage available for a wheelchair and a baby buggy from road front entrance to unit entrance to 28% until 2020 (16% in 2008). Fundamental goal of housing policy for aged people is to build a society that aged people is able to enjoy their own daily life independently with comfort. Elderly people of single often tend to refuse to rent by private rental housing owners. Facing these problems, the Law on Stable Supply of Housing for Elderly People (Housing Law for Elderly People) was established in 2001 and started the registration system on rental houses that is not refuse aged residents with public rent guarantee. On the other hand, a concept of “Housing Safety Net” was introduced and the role of public rental housing was focusing more on socially disadvantaged people including aged families. Moreover, recent revised Housing Law for Elderly People was focused on the issue that making strong linkage between housing policy and welfare policy, each of which in charge of Ministry of Land, Infrastructure, Transport and Tourism (NLIT) and Ministry of Health, Labor and Welfare (MHLW), as well as each divisions of local governments. One of the actual measures is facilitating supply of “Housing for Elderly People with Supportive Services”, which is the kind of rental housings with physical equipments for elders such as flat floor, with daily supportive services as well such as keep in touch service for safety watching, daily consultation service (obliged) and care or nursing service (if needed). The Government facilitates to prevail the lifestyle of elders which living in their house with easily available supportive services. However, number of this sort of housing is absolutely insufficient in current situation. In 2025, it is estimated that population of more than 75 years old will be exceeded 21 million, because the baby boomer generation will join the old elderly age. Toward super aging society which is inevitable, Japanese housing policy is compelled to steady prepare for it. 71
International Symposium On Smart Aging 2011 72 그림 12. 주거 기준의 달성 그림 13. 연령에 따른 인구 피라미드 (2025년 일본)
Fig. 13: Population Pyramid by Ages (Japan, 2025) International Symposium On Smart Aging 2011 Fig. 12: Achievement of Housing Standard 73
International Symposium On Smart Aging 2011 Memo 74 Memo
Paradigm shift in housing market and housing stability of baby boomers 주택시장 패러다임 변화와 베이비부머의 주거안정 주거분야 Son, Kyoung Hwan International Symposium On Smart Aging 2011 Presentation 2 Vice President, Korea Research Institute for Human Settlements 75
Paradigm Shift in Housing Market & Kyung - Hwan Sohn 1. Background The Korean baby boom generations who were born in 1955 have reached the retirement age of 55 and their massive retirement has just started. A total of 5. 49 million people, a total of 75. 8% of the entire baby boom generation, will have retired in the next 10 years. As the baby boom generation is leaving the industry, the concerns over its ripple effect have kept rising. It might cause three kinds of social ripple effects as follows. First of all, the shortage of experienced workforce will become a problem. Secondly, the decrease of asset price due to the imbalance between supply and demand in the asset markets will be increased. Last but not least, the increased social welfare cost will put pressure on national finances. Especially, much concerns are being voiced for the case where the baby boomers want to sell their houses in order to save money for their later years as it will led to the nosedive of real estate price because of the shortterm supply increase. International Symposium On Smart Aging 2011 Housing Stability of the Baby Boom Generation There are some voices on the collapse of housing price resulted from shrinking housing demand of the people (those who between 35 ~ 54 years old) who have driven the increase of housing price for the last two decades. It seems that the housing price was decided by them and, these people mainly contributed to the increase of housing price during the period of 1980 ~ 1990. In case of the USA and Japan, the demand for real estates and land value were decreased simultaneously with the retirement of the baby boom generation. Such facts lay out a logical basis for the concerns over these matter. For Japan and USA, the fall of real estate price had a great ripple effect as the retirement of the baby boom generation occurred concurrently with the global financial crisis (USA) and long-term economic slump. And, Korea might not be an exceptional case. The paradigm shift in housing market is also required for our country and it is expected that the massive retirement of the baby boom generation will heavily affect the market. Therefore, it is required to diagnose accurately the intensity of the social spillover effect and possibilities of actualizing the negative effect caused by the retirement of the baby boom generation, etc. 77
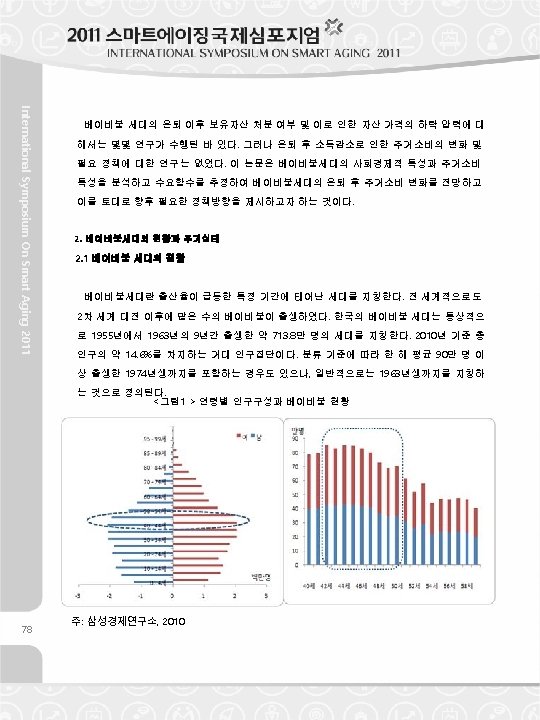
There were some studies regarding whether the baby boom generation will sell their properties after retirement or not, and how it will affect the decrease of asset value. However, there was no retirement and required policies for such issues. The purpose of this study is to analyze the social and economic characteristics of the baby boom generation and the features and trends of their housing consumption to forecast the possible changes in housing consumption after retirement of the baby boom generation and suggest required policies. 2. Current Status of the Baby Boom Generation and Housing Condition 2. 1 Current Status of the Baby Boom Generation The baby boom generation refers to those people who were born at the times of a huge demographic boom in births. Historically, there was a huge baby boom immediately after the end of the World War II. In general, the baby boom generation of Korea refers to those people who were born between 1955 and 1963, up to 7. 138 million people. According to the census taken in 2010, it takes 14. 6% of the total national population. Depending on the classification criteria, International Symposium On Smart Aging 2011 study on the changes of the housing consumption because of the reduced income after those who were born by the time of 1974 are considered as the baby boom generation. During this period, more than 0. 9 million people were born annually. However, in general, 1963 is taken as a standard for a classification of baby boom generation. <Figure 1> Composition of population by the age & current status of the baby boom generation 79 Note: Samsung Economic Research, 2010
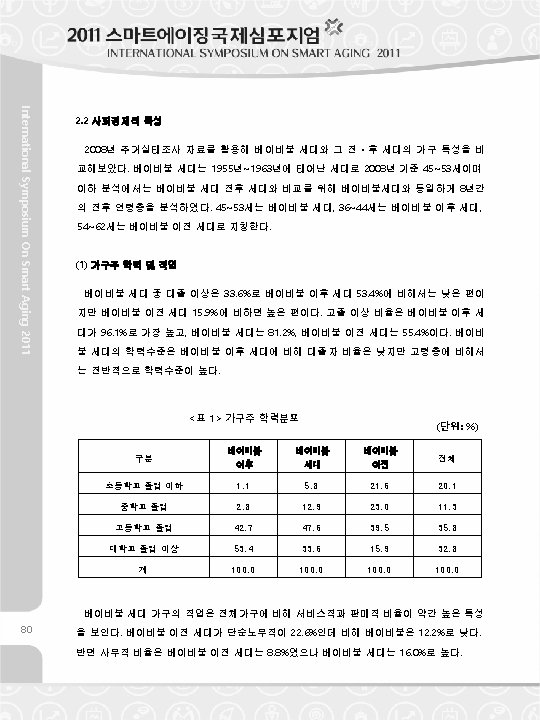
2. 2 Socio- economic Features generation and the generations before and after the baby boom generation were compared. The baby boom generation refers to those people who were born between 1955 and 1963. As of 2008, they become 45 ~ 53 years old. For the comparison the age group was classified in each eight years as follows; Those who are 45 ~ 53 years old is the baby boom generation, those who are 36~44 belong to the group before the baby boom generation and those who are 54 ~ 62 belong to the group after the baby boom generation. (1) Educational Level and Occupation of the Householder Among the baby boom generation, the number of people with educational attainments equal to and higher than those of university graduate accounts for 33. 6%, which is lower than that of the generation who were born after the baby boom generation, but higher than that of the generation who were born before the baby boom generation. In case of the number of people with educational attainments equal to and higher than those of high school graduate, the generation after the baby boom takes the highest rate as 96. 1% followed by the baby boom International Symposium On Smart Aging 2011 Using the results of 2008 Korea Housing Survey, the housing features of the baby boom generation with 81. 2% and the generation before the baby boom with 55. 4%. The baby boom generation has high educational attainments generally comparing with the old age group although the rate of university graduate is lower than that of the generation after the baby boom. <Table 1> Distribution of the Educational Level of the Householder Category Elementary School Graduate or After Baby Boom Generation (Unit : %) Before Baby Boom Total 1. 1 5. 8 21. 6 20. 1 Junior High School Graduate 2. 8 12. 9 23. 0 11. 3 High School Graduate 42. 7 47. 6 39. 5 35. 8 University Graduate 53. 4 33. 6 15. 9 32. 8 Total 100. 0 under In case of the occupation of the baby boom generation, the sales and service work accounts for the higher rate. A total of 22. 6% of the generation before the baby boom engaged in the simple labor work. However, a total of 12. 2% of the baby boom generation engaged in the simple labor work, which is lower rate than that of the generation after the baby boom. In case of the office work, the generation before the baby boom accounts for 8. 8% and the baby boom generation accounts for 16. 0%, which is higher than that of the generation before the baby boom. 81
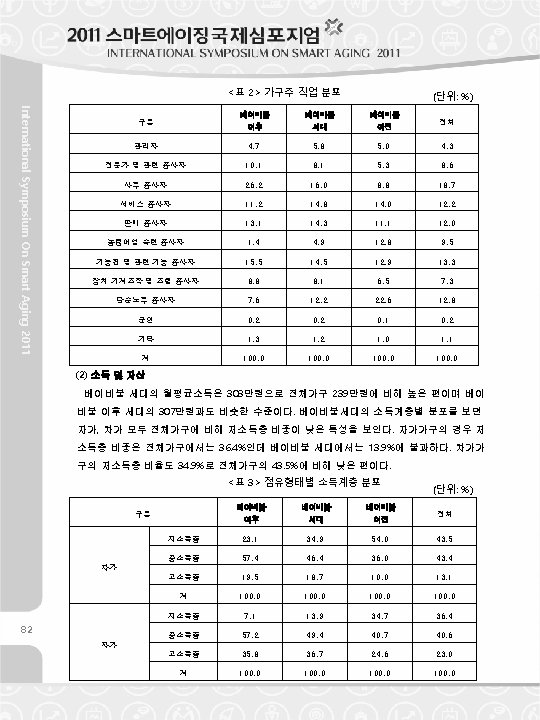
<Table 2> Occupation Distribution of the Householder (Unit : %) Baby Boom Before Baby Boom Generation Boom Manager 4. 7 5. 8 5. 0 4. 3 Professional and Relevant Occupation 10. 1 8. 1 5. 3 8. 6 Office Work 26. 2 16. 0 8. 8 18. 7 Service 11. 2 14. 8 14. 0 12. 2 Sales 13. 1 14. 3 11. 1 12. 0 Agriculture, Forestry and Fishery 1. 4 4. 9 12. 8 9. 5 Technician and Relevant Occupation 15. 5 14. 5 12. 9 13. 3 Mechanician and Assembly Work 8. 8 8. 1 6. 5 7. 3 Simple Labor Work 7. 6 12. 2 22. 6 12. 8 Soldier 0. 2 0. 1 0. 2 Others 1. 3 1. 2 1. 0 1. 1 Total 100. 0 (2) Income & Assets Total International Symposium On Smart Aging 2011 After Baby Category The average monthly income of the baby boom generation is KRW 3. 03 million, which is higher than the average of total households of KRW 23. 9 million and similar to that of the generation after the baby boom that is KRW 3. 07 million. The income level of the low income bracket of the rental household is 34. 9% and it is lower than that of entire household average of 43. 5% <Table 3> Income Level by the Housing Occupation Type After Baby Boom Category Rent Self- owned Baby Boom Generation (Unit : %) Before Baby Boom Total Low Income 23. 1 34. 9 54. 0 43. 5 Middle Income 57. 4 46. 4 36. 0 43. 4 High Income 19. 5 18. 7 10. 0 13. 1 Total 100. 0 Low Income 7. 1 13. 9 34. 7 36. 4 Middle Income 57. 2 49. 4 40. 7 40. 6 High Income 35. 8 36. 7 24. 6 23. 0 Total 100. 0 83
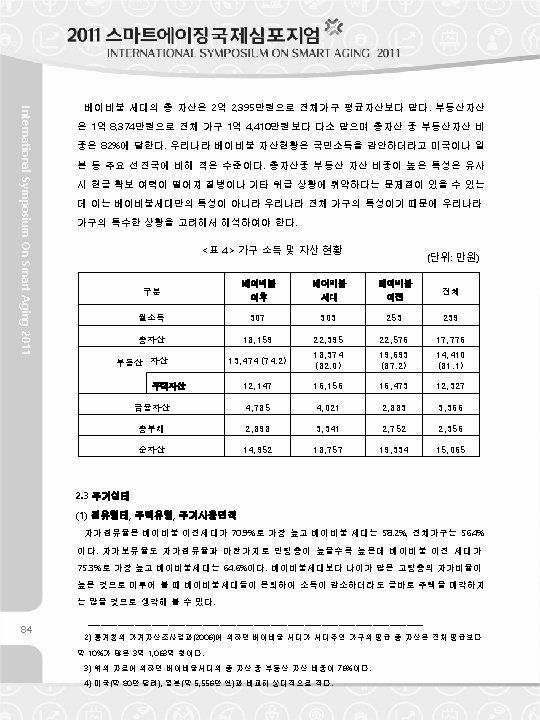
Total asset of the baby boom generation is KRW 223. 95 million which is higher than the average than KRW 144. 10 million of the average of the entire household. And the real estate asset account for 82% of the total asset. The total asset level of Korean baby boom generation is lower than other advanced countries such as Japan and USA although the GDP of Korea is considered. Since the real estate asset takes a high ratio, there might be some difficulties in liquidating the asset at times of emergency. However, it is not a problem which is only limited to the baby boom generation, but it is the general characteristics of the entire Korean household. <Table 4> Current Status of Income & Asset (Unit : KRW 10, 000) Before Baby Category After Baby Boom Generation Monthly Income 307 303 253 239 Total Asset 18, 159 22, 395 22, 576 17, 776 Asset 13, 474 (74. 2) 18, 374 (82. 0) 19, 693 (87. 2) 14, 410 (81. 1) House 12, 147 16, 156 16, 473 12, 327 Financial Asset 4, 785 4, 021 2, 883 3, 366 Total Dept 2, 898 3, 341 2, 752 2, 356 Net Asset 14, 952 18, 757 19, 334 15, 065 Real Estate Boom Total International Symposium On Smart Aging 2011 of the entire household. The real estate asset of them is about KRW 183. 74 million which is higher 2. 3 Status of Housing (1) Tenure and Housing type and Using Area The generation before the baby boom showed the highest ratio of having the self- owned houses with 70. 9% comparing with the 58. 2% of the baby boom generation and 56. 4% of the total average. The older the age, the higher the self-occupied ratio as the self-owned ratio. The generation before the baby boom showed the highest self-occupied ratio with 75. 3% comparing with the 64. 6% of the baby boom generation. Considering that the self-owned ratio is high for the older age group, it is expected that the baby boom generation might not sell their houses _________________________________________________________ immediately after the retirement although their income is deceased. _ 1) According to the Survey of Household Wealth (National Statistical Office, 2006), the average total asset of the baby boom generation's household is about 10% higher than the average of the entire household by KRW 310. 63 million. 2) According to the Survey of Household Wealth (National Statistical Office, 2006), the real estate asset of the baby boom generation's household is about 76% of the total asset. 3) Japan (about 55. 56 million Yen) and USA (about 0. 8 million Dollars) 85
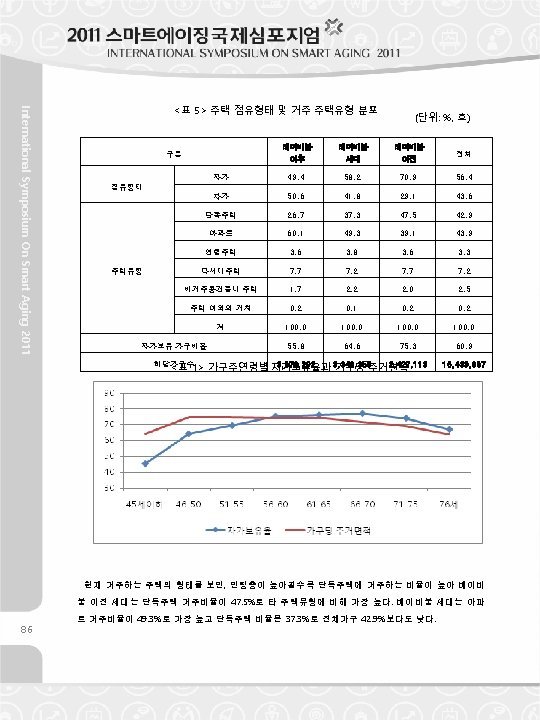
<Table 5> Type of Occupation & Type of Living in Houses (Unit : %, No. ) Baby Boom Before Baby Boom Generation Boom Self- owned 49. 4 58. 2 70. 9 56. 4 Rent 50. 6 41. 8 29. 1 43. 6 Detached House 26. 7 37. 3 47. 5 42. 9 Apartment 60. 1 49. 3 39. 1 43. 9 Row House 3. 6 3. 8 3. 6 3. 3 Multiplex House 7. 7 7. 2 1. 7 2. 2 2. 0 2. 5 0. 2 0. 1 0. 2 100. 0 Ratio of Self-owned Houses 55. 8 64. 6 75. 3 60. 9 Number of Houses 3, 670, 202 3, 346, 358 2, 427, 113 16, 439, 967 Tenure Type House Type Residing in Nonresidental Building Other Places than Houses Total International Symposium On Smart Aging 2011 After Baby Category <Figure 1> Self-owned rate and using area per household by the age of the householder Taking a look at the housing type, the ratio of living in detached house is higher in older age group. In case of the generation before the baby boom, the ratio of living in detached house is the highest as 47. 5% comparing with other type of houses. In case of the baby boom generation, the ratio of living in apartment is the highest as 49. 3%. The ratio of living in detached house is 37. 3%, which is lower than 42. 9% of the entire household. 87
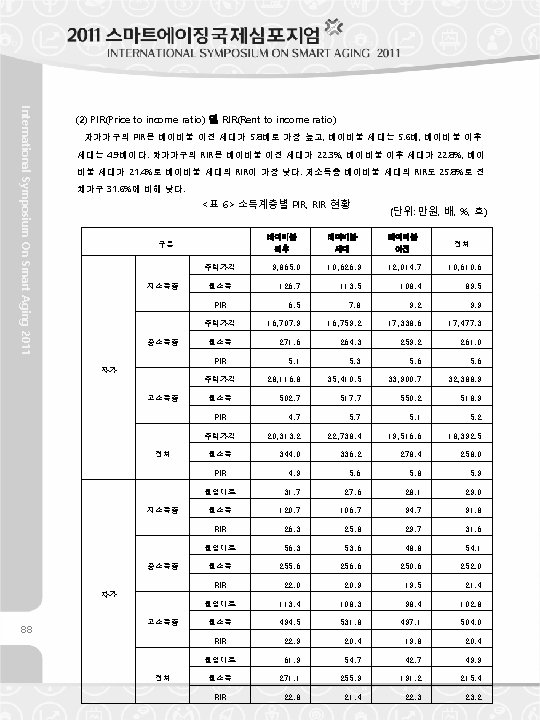
(2) PIR (Price to income ratio) & RIR(Rent to income ratio) the 5. 6 times of the baby boom generation and 4. 9 times of the generation after the baby boom. In case of the RIR(Rent to income ratio) of the rent house type, the generation before the baby boom accounts for 22. 3% and the generation after the baby boom accounts for 22. 8% comparing with 21. 4% of the RIR of the baby boom generation, the lowest among them. The RIR of the low income bracket of the baby boom generation is low as 25. 8% comparing with 31. 6% of the entire household. <Table 6> Status of the PIR & RIR by the Income Bracket (Unit : KRW 10000, Times, %, No. ) After Baby Category Boom Housing Price Baby Before Boom Baby Generation Boom Total 9, 865. 0 10, 626. 9 12, 014. 7 10, 610. 6 126. 7 113. 5 108. 4 89. 5 6. 5 7. 8 9. 2 9. 9 16, 707. 9 16, 759. 2 17, 338. 6 17, 477. 3 271. 6 264. 3 259. 2 261. 0 5. 1 5. 3 5. 6 28, 116. 8 35, 410. 5 33, 900. 7 32, 388. 9 502. 7 517. 7 550. 2 518. 9 4. 7 5. 1 5. 2 20, 313. 2 22, 738. 4 19, 516. 6 18, 392. 5 344. 0 336. 2 278. 4 258. 0 PIR 4. 9 5. 6 5. 8 5. 9 Monthly Rent 31. 7 27. 6 28. 1 29. 0 Monthly Income 120. 7 106. 7 94. 7 91. 8 RIR 26. 3 25. 8 29. 7 31. 6 Monthly Rent 56. 3 53. 6 48. 8 54. 1 Monthly Income 255. 6 256. 6 250. 6 252. 0 Self- RIR 22. 0 20. 9 19. 5 21. 4 owned Monthly Rent 113. 4 108. 3 98. 4 102. 8 Monthly Income 494. 5 531. 8 497. 1 504. 0 RIR 22. 9 20. 4 19. 8 20. 4 Monthly Rent 61. 9 54. 7 42. 7 49. 9 Monthly Income 271. 1 255. 9 191. 2 215. 4 RIR 22. 8 21. 4 22. 3 23. 2 Low Income Monthly Income PIR Housing Price Middle Income Monthly Income PIR Selfowned Housing Price High Income Monthly Income PIR Housing Price Total Low Income Middle Income High Income Total Monthly Income International Symposium On Smart Aging 2011 The PIR(Price to income ratio) of the self-own house type is higher by 5. 8 times comparing with 89
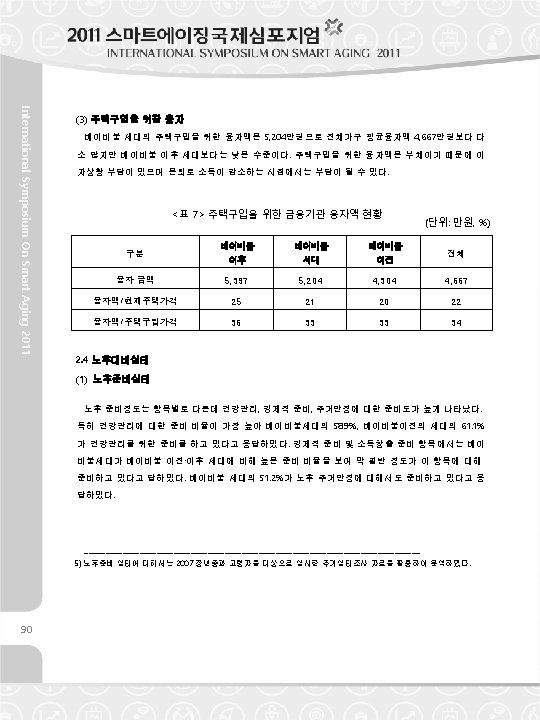
The loan size of the baby boom generation to purchase the house is up to KRW 52. 04 million which is slightly bigger than KRW 46. 67 million, the average of the entire household. However, that is certainly smaller than the loan amount for house of the generation after the baby boom. Since the loan for house is the debt, the repayment burden is existing amid the income reduction due to retirement. <Table 7> Status of the Loan Amount for Purchasing Houses (Unit : KRW 10000, %) Baby Boom Before Baby Generation Boom 5, 397 5, 204 4, 304 4, 667 Loan Amount/Current Housing Price 25 21 20 22 Loan Amount/House Purchase Price 36 33 33 34 Category After Baby Boom Loan Amount Total International Symposium On Smart Aging 2011 (3) Housing Mortgage 2. 4 Post-Retirement Preparation (1) Status of Post-Retirement Preparation The level of old life preparation is different from the category. Health care, financial preparation and housing stability, etc. are the mos well-prepared. Especially, it is shown that most of them put the highest weight on the health care as 58. 9%of the baby boom generation and 61. 1% of the generation before the baby boom are most interested in keeping good health for their old life preparation. 91 ____________________________________________ 4) 2007 Korea Housing Survey (surveyees who are in their 35's and older) are used for the analysis
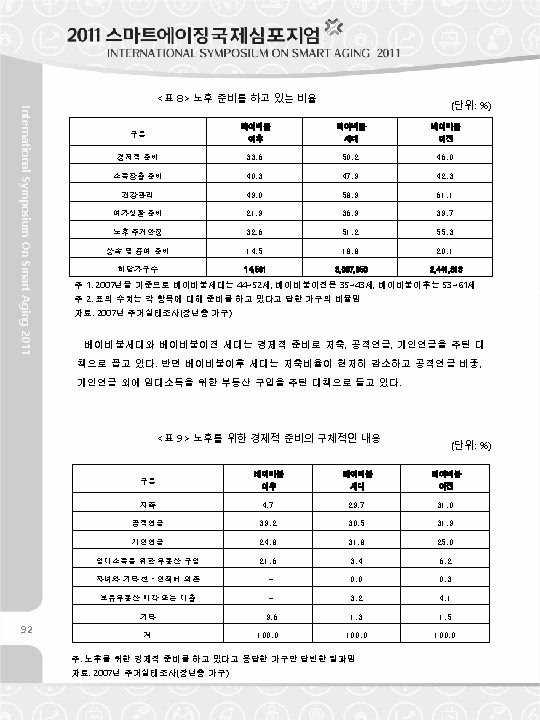
<Table 8> Rate of Preparing the Post-Retirement (Unit : %) Before Baby Generation Boom 33. 6 50. 2 46. 0 Income Creation 40. 3 47. 9 42. 3 Health Care 49. 0 58. 9 61. 1 leisure Time Preparation 21. 9 36. 9 39. 7 Housing Stability 32. 6 51. 2 55. 3 Inheritance Preparation 14. 5 18. 8 20. 1 Number of Relevant Households 14, 561 3, 087, 850 2, 441, 313 After Baby Boom Financial Preparation Note 1: As of 2007, the baby boom generation is 44~52 years old, the generation after the baby boom is 53~61 years old and the generation before the baby boom 35~43 years old. Note 2: The figure on the table is the ratio of households that answered that they are preparing for the category. Resource: 2007 Korea Housing Survey (surveyees who are in their 35's and older ) In terms of the financial preparation and income creation part, the baby boom generation is the International Symposium On Smart Aging 2011 Baby Boom Category most well prepared comparing with the generation before and after the baby boom. A total of 51. 2% of the baby boom generation is preparing for their housing stability in their old life. The baby boom generation and the generation before the baby boom put more weight on savings, public pension and private pension for the old life preparation. On the other hand, the generation after the baby boom puts much weight on purchasing real estates besides public and private pension. They don't put much weight on savings in preparing their old life. <Table 9 > Financial Planning for the Post-Retirement Baby Boom (Unit : %) Category After Baby Boom Savings 4. 7 29. 7 31. 0 Public Pension 39. 2 30. 5 31. 9 Private Pension 24. 8 31. 8 25. 0 Real Estate for Rental Income 21. 6 3. 4 6. 2 Depending on Children or Relatives - 0. 0 0. 3 Selling Real Estate Property or Loan - 3. 2 4. 1 Others 9. 6 1. 3 1. 5 Total 100. 0 Generation Before Baby Boom Note: The results only include the answers from the household answering that they are preparing the old life Resources: 2007 Korea Housing Survey (surveyees who are in their 35's and older ) 93
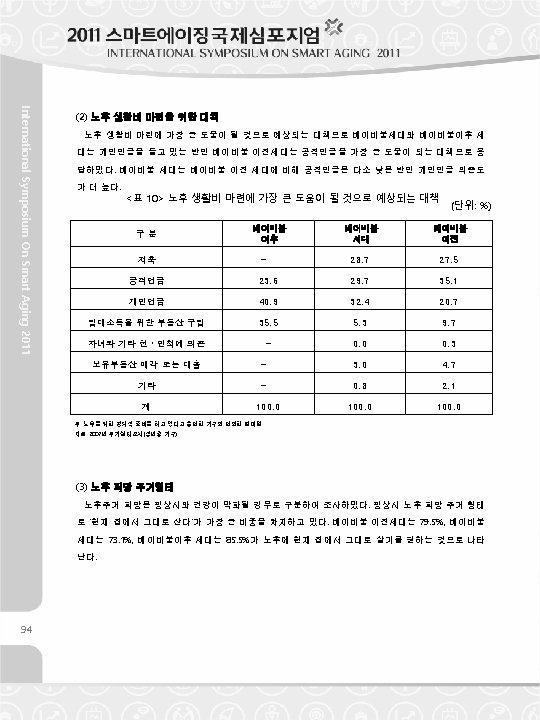
(2) Measures to Plan Living Expenses for Post-Retirement pension as the most effective method to prepare golden years. On the other hand, the generation before the baby boom said that the public pension is the most effective method. The baby boom generation depends more on the private pension than the public pension. <Table 10 > The Most Effective Method to Plan the Post-Retirement (Unit : %) Baby Boom Before Baby Generation Boom - 28. 7 27. 5 Public Pension 23. 6 29. 7 35. 1 Private Pension 40. 9 32. 4 20. 7 Real Estate for Rental Income 35. 5 5. 3 9. 7 Depending on Children or Relatives - 0. 0 0. 3 Selling Real Estate Property or Loan - 3. 0 4. 7 Others - 0. 8 2. 1 Total 100. 0 Category After Baby Boom Savings International Symposium On Smart Aging 2011 The baby boom generation and the generation after the baby boom consider the private Note: The results only include the answers from the household answering that they are preparing the old life Resources: 2007 Korea Housing Survey (surveyees who are in their 35's and older ) (3) Desired Housing Type for the Post-Retirement Life In case of the desired housing type in their golden years, surveys were done by separating the situation when they are healthy and when they are not. With no health problem, surveyees prefer to live in their current houses. A total of 79. 5% of the generation before the baby boom, 73. 1% of the baby boom generation and 85. 5% of the generation after the baby boom answered that they prefer to live in their current houses if they don't have any health problem. 95
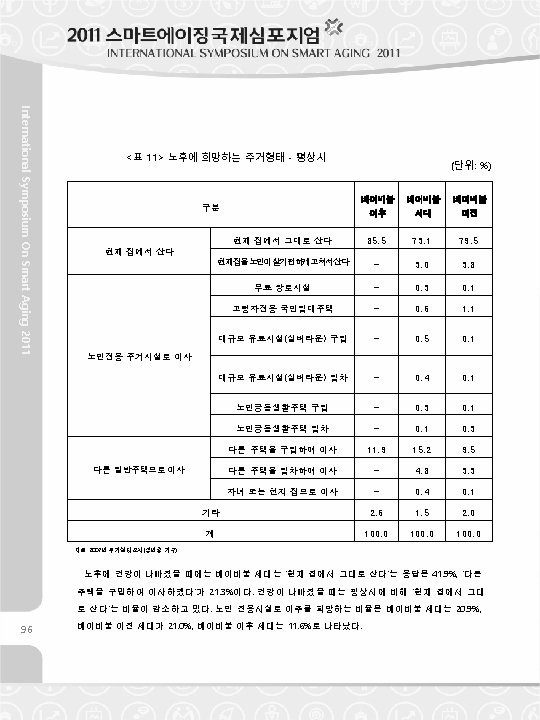
(Unit : %) After Baby Boom Category Move to Other Houses Generation Before Baby Boom Living in current house 85. 5 73. 1 79. 5 Remoden il gcurenthouseforagedfile - 3. 0 3. 8 Free institutions for the aged - 0. 3 0. 1 National rental houses for the aged - 0. 6 1. 1 Purchase the large scale silver town - 0. 5 0. 1 Rent the large scale silver town - 0. 4 0. 1 Purchase the cohabitation house for the aged - 0. 3 0. 1 Rent the cohabitation house for the aged - 0. 1 0. 3 Move to other house (purchase) 11. 9 15. 2 9. 5 Move to other house (rent) - 4. 8 3. 3 Move to the house of children or relatives - 0. 4 0. 1 Others 2. 6 1. 5 2. 0 Total 100. 0 Current House Facility for Aged Persons Baby Boom International Symposium On Smart Aging 2011 <Table 11> Desired Housing Type for the Post-Retirement Life - When Healthy Resources: 2007 Korea Housing Survey (surveyees who are in their 35's and older ) When theirs health gives way, 41. 9% of the baby boom generation answered that they would live in their current house and 21. 3% of them answered that they would move to other houses they purchase. Comparing with the case of good health, the ratio of surveyees who answered that they prefer to live in their current house decreased. The ratio of desiring to move to the exclusive facility for the aged is as follows; the baby boom generation is 20. 9%, the generation before the baby boom 21. 0%, and the generation after the baby boom is 11. 6% respectively. 97
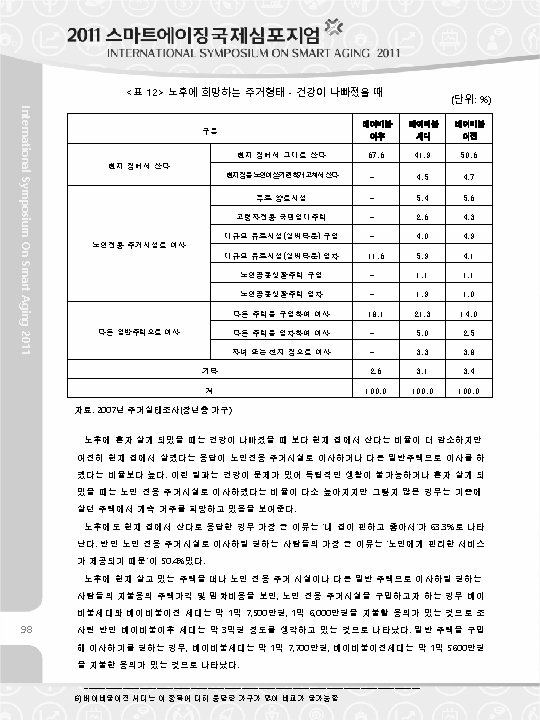
<Table 12 > Desired Housing Type for the Post-Retirement Life - Health Gives Way (Unit : %) Baby Boom Generation Living in current house 67. 6 41. 9 50. 6 Remoden il gcurenthouseforagedfile - 4. 5 4. 7 Free institutions for the aged - 5. 4 5. 6 National rental houses for the aged - 2. 6 4. 3 Purchase the large scale silver town - 4. 0 4. 9 Rent the large scale silver town 11. 6 5. 9 4. 1 - 1. 1 Rent the cohabitation house for the aged - 1. 9 1. 0 Move to other house (purchase) 18. 1 21. 3 14. 0 Move to other house (rent) - 5. 0 2. 5 Move to the house of children or relatives - 3. 3 3. 8 2. 6 3. 1 3. 4 100. 0 Current House Facility for Aged Persons Purchase the cohabitation house for the aged Move to Other Houses Others Total (surveyees who are in their 35's and older 100. 0 Resources: 2007 Korea Housing Survey ) Baby Boom International Symposium On Smart Aging 2011 Before After Baby Category The ratio of preferring to live in the current house is decreased in case where they become alone in later years. However, the ratio of preferring to live in the current house is still higher than moving to other houses or silver facilities. It means that they are wiling to move to silver facilities when they are not able to live independently, otherwise they prefer to live in the current house they live. A total of 63. 3% answered that they want to live in the house where they have been lived because it is comfortable and they like it. On the other hand, 50. 4% answered that they want to move to the silver facility since they provide convenient services for the aged people. Taking a look at the result of how much amount they are willing to afford when they move to a new house or residental facility for the old aged if they want to move to a new place, the baby boom generation and the generation before the baby boom are wiling to afford KRW 175 million and KRW 160 million respectively. In case of the generation after the baby boom, they are willing to afford up to KRW 300 million. In case of preferring to move to a new house, the baby boom generation is willing to afford KRW 177 million and the generation before the baby boom is willing to afford KRW 156 million. ____________________________________________ 5) No data for the generation after the baby boom for this category 99
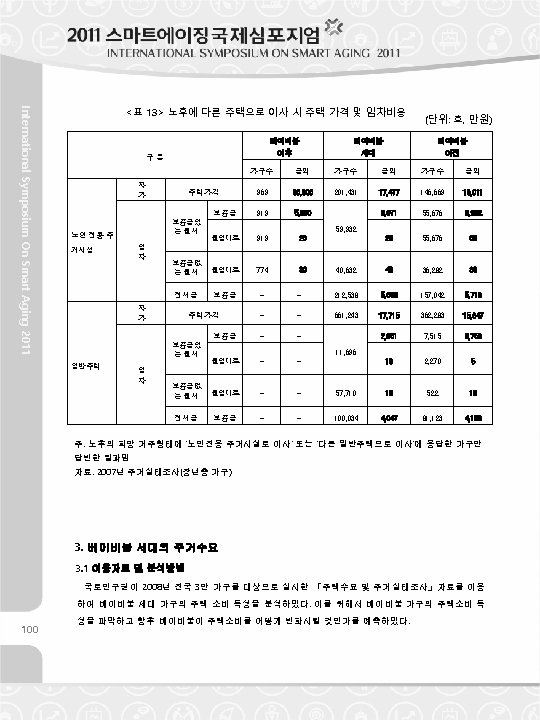
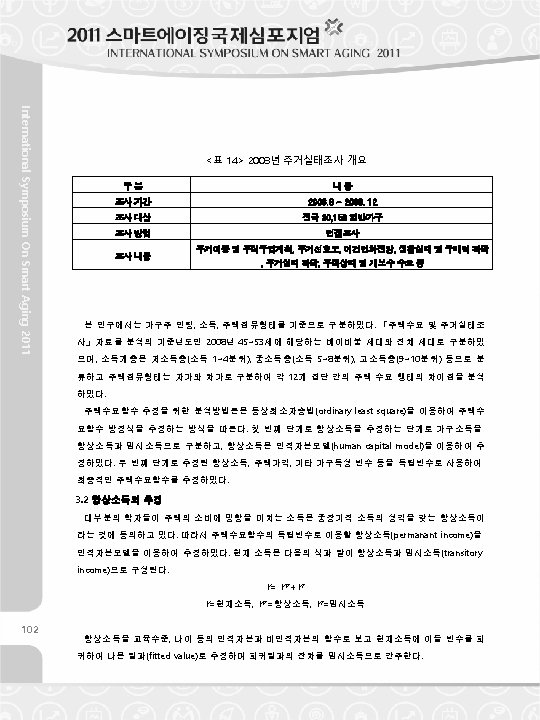
After Baby Boom Generation Before Baby Boom Category Sef-lowned House Price No. Amount 969 30, 000 201, 431 17, 477 146, 669 16, 011 919 5, 000 3, 971 55, 676 3, 292 28 55, 676 30 Securi ty Monthly rent with security deposit Depo Monthly Facility for the Rent Aged Monthly rent without security deposit 59, 932 sit Monthly Rent 919 20 774 30 40, 632 46 36, 282 36 - - 212, 538 5, 338 157, 042 5, 716 - - 661, 243 17, 715 362, 283 15, 647 - - 2, 851 7, 515 3, 756 19 2, 270 5 Securi Key money ty Depo sit Sef-lowned House Price International Symposium On Smart Aging 2011 <Table 13 > In case of moving to other place, the amount willing to afford (Unit : No. , KRW 10000) Securi ty Monthly rent with security deposit Depo Monthly General House Rent Monthly rent without security deposit 11, 696 sit Monthly Rent - - 57, 710 19 522 10 - - 100, 034 4, 047 81, 123 4, 199 Securi Key money ty Depo sit the case of answering as 'move to other house'' or 'move Note: The results of the table includes only to silver facility'. Resources: 2007 Korea Housing Survey (surveyees who are in their 35's and older ) 3. Housing Demand of the Baby Boom Generation 3. 1 Data & Methodology The characteristics of housing consumption of the baby boom generation were analyzed using the results of Korea Housing Survey by the Korea Research Institute for Human Settlements (hereinafter referred to as the KRIHS) in 2008 for 30000 households. 101
Category Details Research Period 2008. 8 ~ 2008. 12 Research Subject total 30, 156 households Research Method Research Contents Interview Migration to a new house, house purchase plan, preference, living condition, house purchase power, condition of house and necessity of renovation and repair, etc. This study was done by the criteria of age and income of the householder and tenure type. The Korea Housing Survey was done in 2008 and the baby boom generation became in 45~53 years old in that year. The income bracket was categorized in three groups such as low(1~4), middle(5~8) and high(9~10). The tenure type was differentiated by the self-owned and rent. To estimate the housing demand function, the ordinary least square was applied. At first stage, the permanent income and transitory income were differentiated. The permanent income was International Symposium On Smart Aging 2011 <Table 14> 2008 Korea Housing Survey estimated using the human capital model. At the second stage, the final housing demand function was calculated using the permanent income, housing price and other features as the independent variables 3. 2 Estimation of the permanent income Most scholars agrees to the permanent income affecting the housing consumption tendency. Therefore, the permanent income as the independent variable of the housing demand function was estimated using the human capital model. The current income was categorized as permanent income and transitory income as following equation. Y= YP +YT Y= Current Income, YP = Permanent Income, YT= Temporary Income The permanent income was regarded as a function of human capital such as educational achievement and age, etc. and non-human capital. The fitted value earned by regressing variables from the current income and the remaining difference of the regression result was regraded as the transitory income. 103
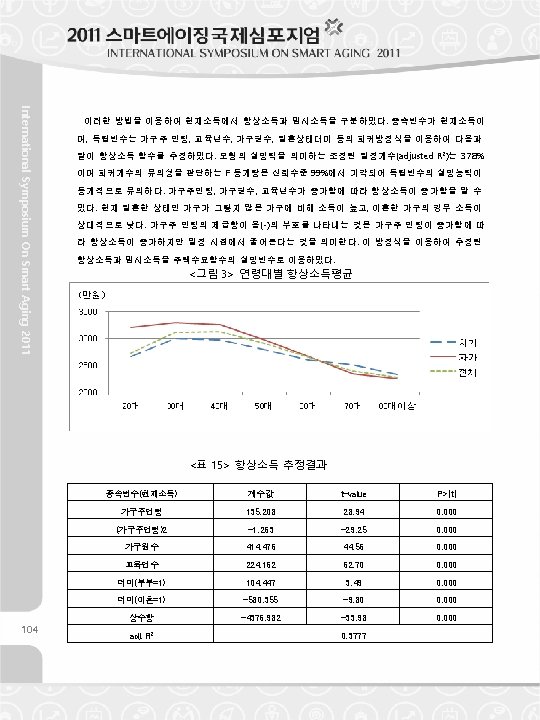
Using such method, the permanent income and transitory income were differentiated from the age, educational achievement, conjugal condition and number of family members, etc. The adjusted R 2 which decides the explanation ability of the model was 37. 8% and F statistics that decide the significance of the regression coefficient was 99% reliable. It means that the explanation ability of the independent variable was statistically significant. We can see that the permanent income is increased when the age of the householder, number of family members and years of receiving education of the householder is increased or high. The person married had higher income than divorced. The square of the age of the householder appeared as (-) sign as the permanent income is decreased from the certain point. The permanent income and transitory income estimated using this equation were applied as the explanatory variable for the housing demand function. <Figure > Average Permanent Income by the Age Group International Symposium On Smart Aging 2011 current income. The dependent variable is the current income and independent variables are the <Table 15 > Result of Estimating the Permanent Income Dependent Variable (Current Income) Coefficient Value t-value P>|t| Age of the Householder 135. 208 28. 94 0. 000 (Age of the Householder)2 -1. 263 -29. 25 0. 000 No. of Family Members 414. 476 44. 56 0. 000 Years of Receiving Education 224. 162 62. 70 0. 000 Dummy (couple =1) 104. 447 3. 49 0. 000 Dummy (divorce =1) -580. 355 -9. 80 0. 000 Constant Term -4376. 982 -33. 98 0. 000 adj. R 2 0. 3777 105
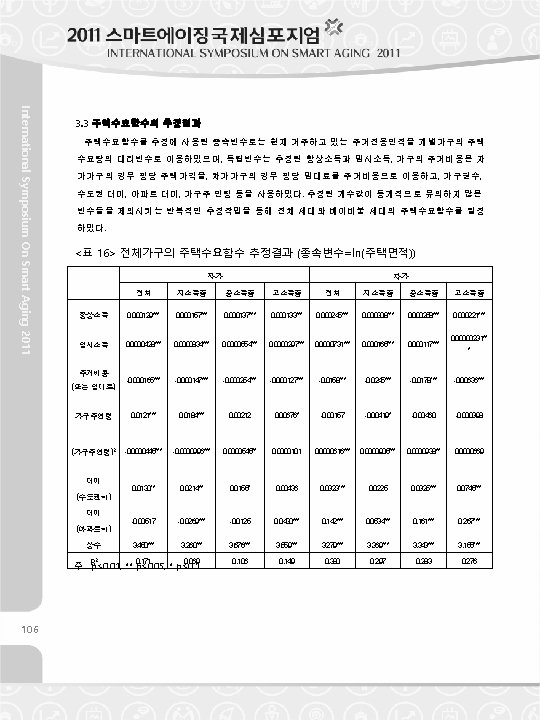
3. 3 Estimation Results of the Housing Demand Function <Table 16> Estimation Result of the Housing Demand Function of the Entire Household (Independent Variable =ln (Housing Area)) Self owned Rent Total Low. Income Middle. Income High. Income Permanent Income 0. 000129*** 0. 000157*** 0. 000133*** 0. 000245*** 0. 000308*** 0. 000258*** 0. 000221*** Transitory Income 0. 0000428*** 0. 0000834*** 0. 0000554*** 0. 0000297*** 0. 0000731*** 0. 000165*** 0. 000117*** 0. 00000231*** -0. 000165*** -0. 000147*** -0. 000254*** -0. 000127*** -0. 0158*** -0. 0245*** -0. 0178*** -0. 00636*** 0. 0121*** 0. 0184*** 0. 00212 0. 00676* -0. 00157 -0. 00419* -0. 00460 -0. 000398 -0. 0000445*** -0. 0000996*** 0. 0000545** 0. 0000101 0. 0000616*** 0. 0000905*** 0. 0000938** 0. 0000669 0. 0130** 0. 0214** 0. 0155* 0. 00436 0. 0323*** 0. 0225 0. 0325*** 0. 0745*** -0. 00517 -0. 0269*** -0. 0125 0. 0430*** 0. 142*** 0. 0534*** 0. 161*** 0. 267*** 3. 450*** 3. 260*** 3. 676*** 3. 559*** 3. 279*** 3. 369*** 3. 343*** 3. 155*** 0. 106 0. 149 0. 380 0. 297 0. 283 0. 276 Housing Cost (or Rent) Age of the Householder (Age of the Householder)2 Dummy(Metropolit an Area=1) Dummy International Symposium On Smart Aging 2011 Following independent variables were used for the housing demand function; the housing area of individual household was regarded as the proxy variable of housing demand the estimated permanent income and transitory income were regarded as the independent variables. The housing cost was calculated based on the housing price by the 3. 3 m 2 in case of self-owned houses and rent price in case of the rental house by the 3. 3 m 2. As dummy variables, the number of family members, apartment and metropolitan area were used. By repeating the estimation process to rule out insignificant variables, the housing demand function of the baby boom households and the entire households were decided. The result of estimating the housing demand function for the entire household is described by <Table 16>. The signs of all variables coincided with theoretical interpretation related to the housing demand. As the housing cost is increased, the housing demand is decreased. As the permanent income and transitory income are increased, the housing demand is increased <Table 17> is the estimation of the housing demand function of the baby boom household. As the permanent income and transitory income are increased, the housing demand is increased. The estimated coefficients of the housing cost is minus(-) and were proved as statistically significant excluding the high income bracket. (Apt. =1) Constant Term Note : p<0. 01, ** p<0. 05, 0. 069 * p<0. 171 R 2 107
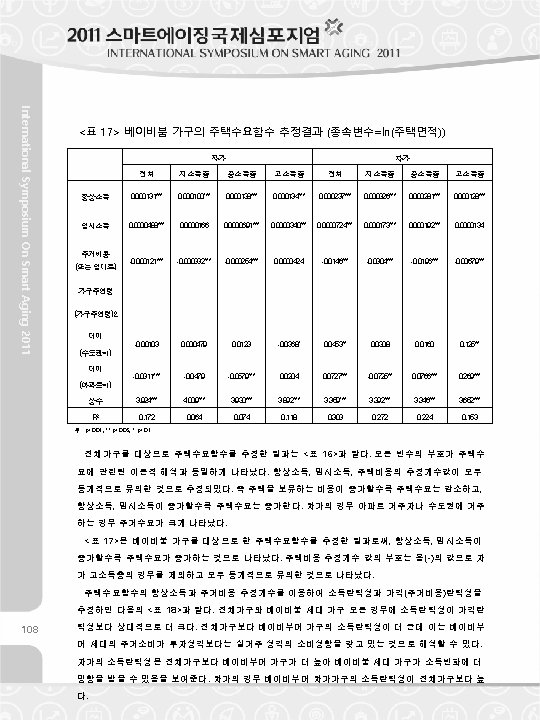
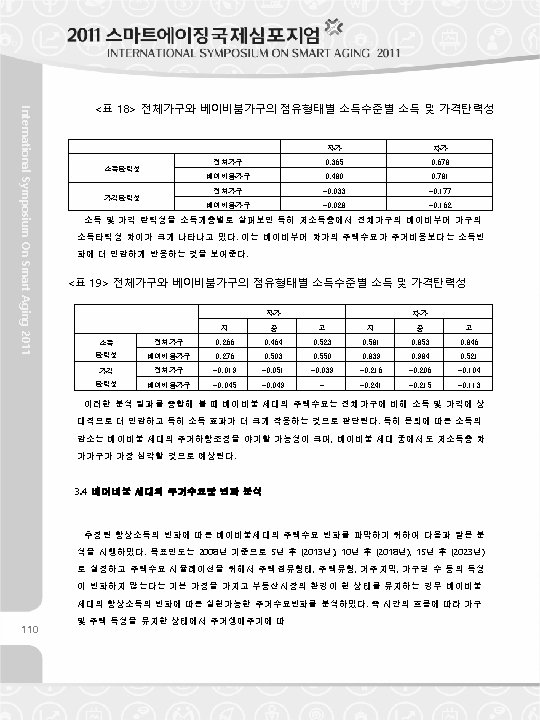
<Table 17> Estimation Result of the Housing Demand Function of the baby boom Household (Independent Variable =ln (Housing Area)) Total Low Income Permanent Income 0. 000131*** 0. 000100*** Transitory Income 0. 0000488*** -0. 000121*** Housing Cost (or Rent) Age of the Householder (Age of the Rent Middle High Income Total Low Income 0. 000138*** 0. 000134*** 0. 000237*** 0. 000326*** 0. 000281*** 0. 000128*** 0. 0000166 0. 0000691*** 0. 0000340*** 0. 0000724*** 0. 000173*** 0. 000192*** 0. 0000134 -0. 000332*** -0. 000254*** 0. 0000424 -0. 0146*** -0. 0304*** -0. 0196*** -0. 00679*** Income High Income Householder)2 Dummy(Metropolit an Area=1) Dummy -0. 00103 0. 000479 0. 0123 -0. 0368* 0. 0453** 0. 0308 0. 0160 0. 125** -0. 0311*** -0. 0479 -0. 0579*** 0. 0204 0. 0727*** -0. 0725** 0. 0766*** 0. 269*** 3. 924*** 4. 009*** 3. 930*** 3. 892*** 3. 359*** 3. 392*** 3. 346*** 3. 652*** 0. 074 0. 118 0. 303 0. 272 0. 224 0. 153 (Apt. =1) Constant Term Note. R: 2 p<0. 01, ** 0. 172 p<0. 05, * p<0. 1 0. 064 International Symposium On Smart Aging 2011 Self owned The estimation of the income elasticity and price elasticity is done by using the estimated coefficient of the permanent income and housing cost in <Table 18>. In all cases, the income elasticity is bigger than the price elasticity. Also, the income elasticity of the baby boom households is bigger than that of the entire households. It is because the baby boom generation purchase houses to live, not for investment. In case of the households having the self-own house, the baby boom generation showed bigger income elasticity, which means that the baby boom generation is much vulnerable to the income level change. In case of the household living in rental house, the baby boom generation also showed bigger income elasticity than that of entire households. 109
<Table 18> Income and Price Elasticity Rent Entire Household 0. 365 0. 678 Baby Boom Household 0. 480 0. 781 Entire Household -0. 033 -0. 177 Baby Boom Household -0. 028 -0. 162 Taking a look at the income elasticity and price elasticity by the income level, the difference between income elasticity of the entire and the baby boom households is the biggest in case of rented house and the low income bracket. It means more sensitive to the income amount changes. <Table 19> Income and Price Elasticity by the Income Level Self- owned Income Elasticity Price Elasticity Entire Household Rent Low Middle High 0. 266 0. 464 0. 523 0. 581 0. 853 0. 846 Baby Boom Household 0. 276 0. 503 0. 550 0. 839 0. 984 0. 521 Entire Household -0. 019 -0. 051 -0. 039 -0. 216 -0. 206 -0. 104 Baby Boom Household -0. 045 -0. 049 - -0. 241 -0. 215 -0. 113 The housing demand of the baby boom households is more sensitive to the income and price comparing with that of the entire household. Especially, there is possibility that the International Symposium On Smart Aging 2011 Income Elasticity Self- owned income reduction after the retirement may cause downsizing the house size. This phenomenon means that the low income and rental households will be most heavily affected by the income reduction. 3. 4 Analysis on the Housing Demand Change of the Baby Boomer Household In order to figure out the changes of housing demand of the baby boomer households with the changes of the permanent income, the following analysis was done. As of 2008, it was forecasted in every five years such as 2013 (5 years later), 2018 (10 years later), and 2023 (15 years later). For the housing demand simulation, it was assumed that the tenure type, housing type and number of family members, etc. are not changed. Under such assumption, the possible changes of the housing demand according to the changes of the permanent income of the baby boomer households were analyzed. As time goes by, 111
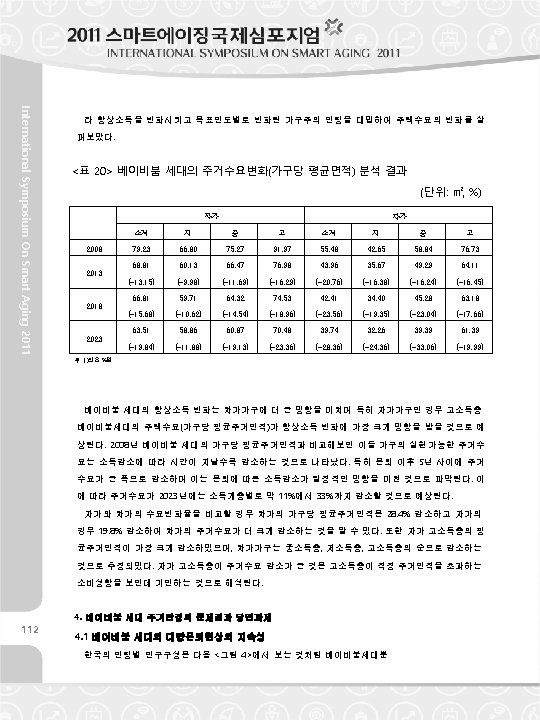
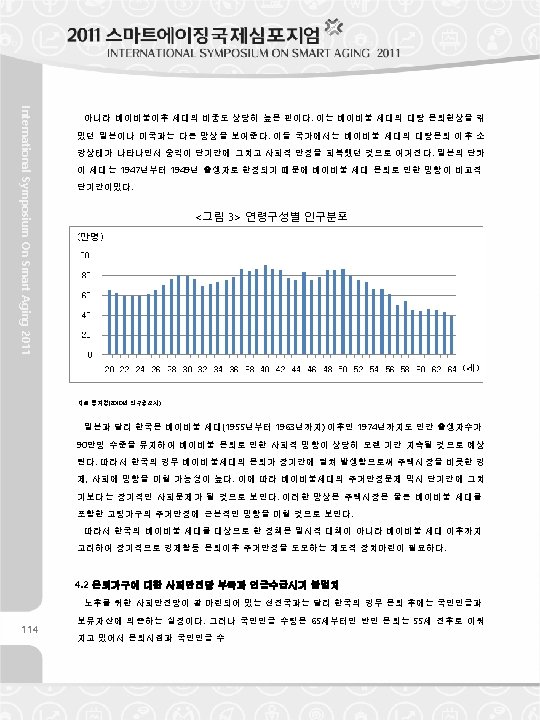
<Table 20> Housing Demand Change of the Baby Boom Generation (Average housing area by the Household) Self- owned Rent Sub- total Low Middle High 79. 23 66. 80 75. 27 91. 97 55. 48 42. 65 58. 84 76. 73 68. 81 60. 13 66. 47 76. 98 43. 96 35. 67 49. 29 64. 11 (-13. 15) (-9. 98) (-11. 69) (-16. 29) (-20. 76) (-16. 38) (-16. 24) (-16. 45) 66. 81 59. 71 64. 32 74. 53 42. 41 34. 40 45. 28 63. 18 (-15. 68) (-10. 62) (-14. 54) (-18. 96) (-23. 56) (-19. 35) (-23. 04) (-17. 66) 63. 51 58. 86 60. 87 70. 48 39. 74 32. 26 39. 39 61. 39 (-19. 84) (-11. 88) (-19. 13) (-23. 36) (-28. 36) (-24. 36) (-33. 06) (-19. 99) 2008 2013 2018 2023 Note: The content inside the ( ) is %. It is expected that the changes of the permanent income will affect more greatly to the households who are living in rental house. Especially, in case of the households who are living in their owned houses, it seems that the high income bracket of the baby boom households will be greatly affected by the changes of the income amount. If comparing the average housing area of International Symposium On Smart Aging 2011 (Unit : ㎡, %) the baby boomer households as of 2008, the feasible housing demands of such households are getting decreased. Especially, within 5 years after the retirement, the demand was decreased drastically. It looks that the income reduction after retirement affect the decrease of the housing demand. Therefore, in 2023, it is expected that the housing demand will be decreased up to 11%~ 33% by the income level bracket. If the housing demand change rate of the households living in self-own house and rental house are compared, the average housing area of the rental house is decreased up to 28. 4% and that of self-owned houses is decreased up to 19. 8%. It was analyzed that the housing demand of the households living in rental houses is decreased more than that of the households living in their own houses. 4. Problem and Issues of the Housing Settlement of the Baby Boom Generation 4. 1 Constant Massive Retirement of the Baby Boom Generation The population composition of Korea is very well- balanced as <Figure 4>. It means that Korea's condition is different from Japan and USA which went through massive retirement of the baby boom generation. In case of Japan and USA, the massive retirement of the baby boom generation affect within a limited period and soon recovered the social stability. The Danki Generation, baby boom generation, of Japan was limited to the person who was born in the period between 1947 to 1949. Therefore, their retirement did not have a big impact. 113
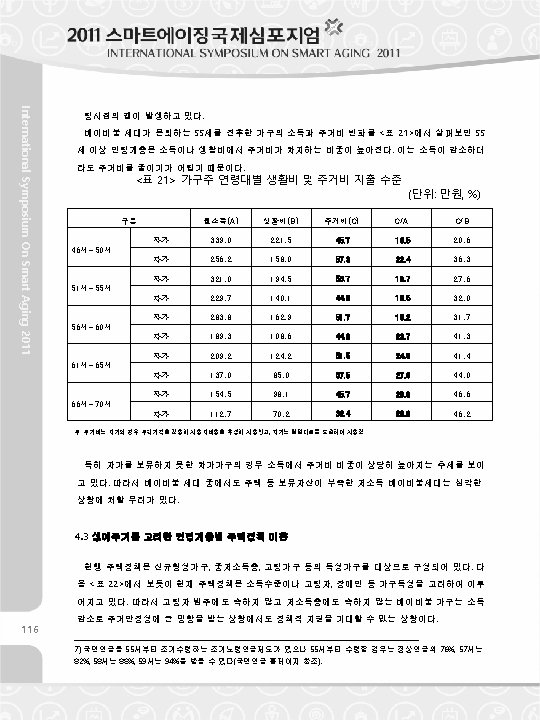
<Figure 3> Population composition by the Age Unlike Japan, Korean's baby boom generation includes those who are born from 1955 to 1963. Therefore the massive retirement of the baby boom generation is expected to affect greatly and for a long time. Since their retirement will occur over the long haul, it will have greater social impact. Such phenomenon will also have a strong influence on not only the housing market, but also the housing stability of the aged households including the baby boom generation. International Symposium On Smart Aging 2011 Resources: National Statistical Office (2010 Census) Accordingly, the plans for the baby boom generation are required to be a long- term plan that looks ahead into the future of the generations who are born after the baby boom. 4. 2 Shortage of Social Safety Net for the Retired Household & Disparity of the Pension Supply and Demand Unlike the developed countries which have well- established the social safety net, the Korean retired people depends on national pension and private assets. However, there is a big gap between the retirement age which is 55 years old and the pension ages which is 65 years old. <Table 21> describes the chances of the income and housing cost around the age of 55, the retirement age of the baby boom generation. The housing cost from the income or living cost is increased in case of the people who are older than 55. The reason is that it is hard to reduce the housing cost although their income is reduced. ___________________________________ 6) Although there is a system that provide the national pension from 55, in this case they can only receive 76%. In case of 57, 58 and 59 years old, it is 82%, 88%, and 94% respectively. (Please refer to the National Pension Homepage). 115
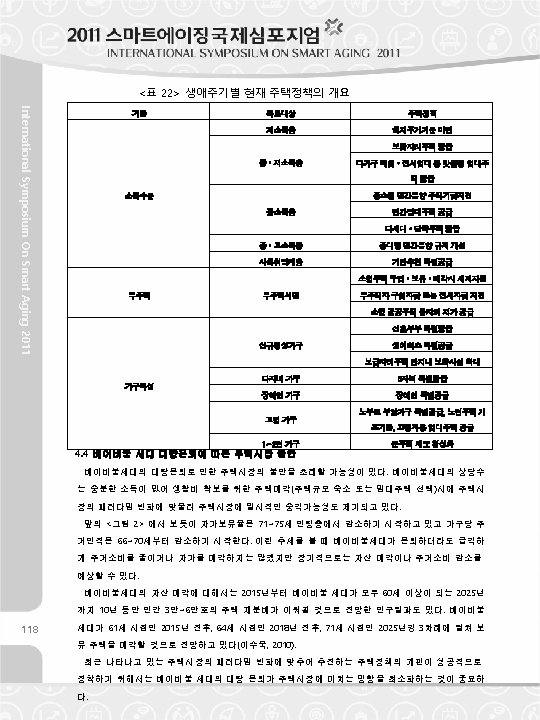
Monthly Category Income(A) Living Cost (B) Housing Cost (C) C/A C/B Self-own 339. 0 221. 5 45. 7 13. 5 20. 6 Rent 256. 2 158. 0 57. 3 22. 4 36. 3 Self-own 321. 0 194. 5 53. 7 16. 7 27. 6 Rent 229. 7 140. 1 44. 8 19. 5 32. 0 Self-own 283. 8 162. 9 51. 7 18. 2 31. 7 Rent 189. 3 108. 6 44. 8 23. 7 41. 3 Self-own 209. 2 124. 2 51. 5 24. 6 41. 4 Rent 137. 0 85. 0 37. 5 27. 3 44. 0 Self-own 154. 5 98. 1 45. 7 29. 6 46. 6 Rent 112. 7 70. 2 32. 4 28. 8 46. 2 46~50 51~55 56~60 61~65 66~70 Note: The housing cost is estimated using the user cost of the housing price in case of the self-own house owners. And, in case of the household living in rental houses, the monthly rent was used. International Symposium On Smart Aging 2011 <Table 21> Living and Housing Cost by the Age of the Householder (Unit : KRW 10000, %) Especially, the housing cost of the household living in rental houses was high. Therefore, it is likely that the low income bracket of the baby boom generation faces serious situation. 4. 3 Insufficient Housing Policy by the Age The current hosing policy is for the newly established household, low and middle income brackets and old aged households, etc. As the <Table 22>, current housing policy considers the features of the family members such as the aged and the disabled. Therefore, there is no economic support for the baby boom generation which does not fall into the category of the low income bracket or the aged although their housing stability faces in great risks because of income reduction. 117
<Table 22> Outline of the Current Housing Policy by the Life Cycle Standard Housing Policy Low Income Preparation of the minimum housing standards Providing the 'Bogeumgari House' Low/Middle Income Providing the customized rental houses Supporting the housing funds Income Level Middle Income Providing the private rental houses Providing the multiplex and detached house Middle /High Income Socially Disadvantaged Class Improving regulations on selling middle and large private houses Special provision by the recommendation Providing tax exemption in case of purchasing or selling small houses Non- homeowner Nonhouseowner Supporting the house purchasing or rental funds Providing the land for small public houses at a low price Special provision for the new couples Newly- established Family Special provision for the persons who buy the house for the first time in their life. Extending the size of the child care facility within the 'Bogeumgari House' Household Features Firmly with Many Children Special provision for the family with more than 3 children Family with the Disabled Special provision for the family with the disabled family member Aged Household 1~2 People Household Special provision for the family with the aged. Renovation of the houses of the aged people, etc International Symposium On Smart Aging 2011 Subject Activation of the quasi- house system 4. 4 Housing Market Instability due to the Massive Retirement of the Baby Boom Generation It is likely that the housing market instability is caused because of the massive retirement of the baby boom generation. Since most of the baby boom generation do not have enough income, it is very likely that they will sell their houses to accord their living cost. In such cases, it will have a serious impact on the housing market temporarily. As seen by <Figure 2>, the ratio of the households having their own houses is started to decrease from the age group of 71~ 75 and the housing area is started to decrease from 66 ~ 70. Although they might not sell their houses immediately after retirement, it is possible that they will sell their houses sometimes after the retirement in the long term. According to the some study results, the baby boom generation will sell their houses for the coming period of 10 years, from 2015 to 2025, and a total of 30, 000 ~ 60, 000 houses will be redistributed during that period. The baby boom generation becomes 61 years old in 2015, 64 in 2018 and 71 in 2025. It is expected that they will sell their houses in such three point of time. (Soo-wook Lee, 2010). In order for the housing policy is well-settled in line with the recent paradigm shift in the housing market, it is very important to minimize the effect of the massive retirement of the baby boom generation to the housing market. 119
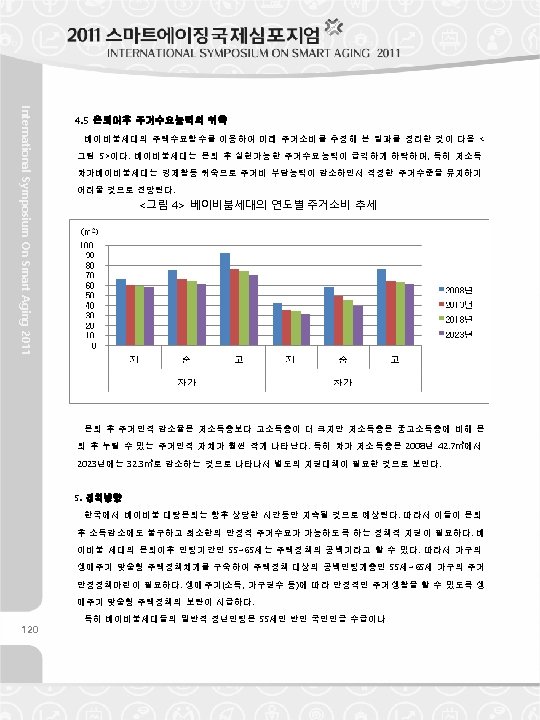
<Figure 4> Housing Demand Trend of the Baby Boom Generation By the Year International Symposium On Smart Aging 2011 4. 5 Contraction of the Housing Demand after Retirement The result of forecasting the housing consumption trend in the future is described by the <Figure 5>. The housing demand of the baby boom generation is drastically decreased after the retirement. Especially, in case of the low income households which is living in rental houses among the baby boom generation, it is expected to be difficult to maintain the appropriate living condition as their housing cost accord capacity is downsized. Although the rate of housing size reduction after retirement of the high income bracket is higher than that of low income bracket, the low income bracket use relatively small housing area after retirement comparing with the high income bracket. Especially, as the housing area of the low income bracket is expected to be decreased in 2008 to 42. 7㎡ and 2023 to 32. 3㎡ , a substantial support is highly required. 5. Direction of the Policy In Korea, the massive retirement of the baby boom generation is expected to be continued for a time being. Therefore, a practical policy to support their minimum housing stability is highly demanded as their income is decreased after retirement. There is no housing policy for the period when the baby boom generation becomes in their 55∼ 65 after retirement. So, it is required to stabilize the housing condition during such period by establishing a substantial housing policy which is customized to the life cycle (income and number of family members, etc. ) of households of baby boom generation. 121
Especially, although the general retirement age of the baby boom generation is 55, the pension income reduction for this period. Therefore, support policies such as reducing the property tax or reducing the age of reverse mortgage until they reach the age which is qualified to receive the national pension. According to the some study results, the baby boom generation will sell their houses for the coming period of 10 years, from 2015 to 2025, and a total of 30, 000 ~ 60, 000 houses will be redistributed during that period. The baby boom generation becomes 61 years old in 2015, 64 in 2018 and 71 in 2025. It is expected that they will sell their houses in such three point of time. (Soo -wook Lee, 2010). Considering that Koreans's high house ownership and status of self-owned houses, etc. , it is expected that the baby boom generation will not sell their houses immediately after retirement. However, if they face the short of living cost, it is very likely that they would sell their houses. More than anything else, the asset size and income level are to be considered in deciding the policies for the baby boom generation that are retired from their profession. Unlike the household having their own house, the households living in rental houses are likely to face serious problems. International Symposium On Smart Aging 2011 age is started from 65. For 10 years after retirement, there is no measures to supplement the For the households having their own house, it is required to improve the reverse mortgage system so that it can provide benefits to those people during the period when the gap is made between retirement age and pension age. Also, the provision of house renovation cost will be a good measure so that the households having their own house earn the rental income by subletting their houses after retirement. For the households of baby boom generation living in rental houses with low income, more proactive and substantial policies are required. Regarding the question on the most required support for the aged, most people said that the provision of the rental houses for the aged and house renovation cost support are the most required policy. In case of the matter on providing the priority right to move to public or private rental house, the baby boom generation and the generation after the baby boom feel keenly the necessity of such preference comparing with the generation before the baby boom. 123
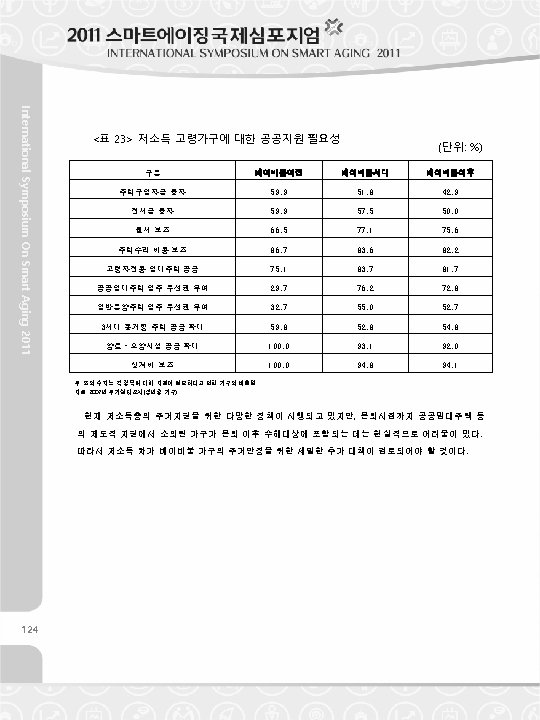
Category Before Baby Boom Generation After Baby Boom Housing Loan 59. 9 51. 8 42. 9 Key Money Loan 59. 9 57. 5 50. 0 Monthly Rent Support 66. 5 77. 1 75. 6 House Repair Cost Support 86. 7 83. 6 82. 2 75. 1 83. 7 81. 7 29. 7 76. 2 72. 8 32. 7 55. 0 52. 7 59. 8 52. 8 54. 8 Expanding the Provision of Silver Facilities 100. 0 93. 1 92. 0 Living Cost Support 100. 0 94. 8 94. 1 Provision of Exclusive Rental Houses for the Aged Providing the Priority Right to Move to the Public Rental House Providing the Priority Right to Move to the Private Rental House Expanding the Provision of the 3 - generation Cohabitation Houses International Symposium On Smart Aging 2011 <Table 23> Necessity of Public Support for the Aged Household with Low Income (Unit : %) Note: The figures of the box is the number of households that answered that the support for the category is most required. Resources: Korean Housing Survey 2007 (surveyees who are in their 35's and older ) As of now, although there are various polices to support the housing for the low income bracket, it is difficult to cover the houses that are not receiving such supports after the retirement. Therefore, it is highly demanded to consider more substantial and concrete policy for housing stability of the households of the baby boom generation living in rental houses with low income. 125
References Research Soo-재ok Lee, 2010, "Income change and housing market of the baby boomer households", Joint policy seminar of the Korea Housing Society <The aged society and forecast on the housing market in line with the retirement of the baby boom generation> Eui-chul Jeong / Sung- jin Cho, 2005, "Research on the long- term housing demand according to the chance of population composition", Land plan no. 3 of vol. 40, Korea Land City Plan Society Ho- seong Jeong et al. , 2010, Countermeasure and riffle effect of the retirement of baby boom generation, Samsung Economic Research Mun-jong Cha, 2004, Research on policies and analysis on the housing market, Korea Development Institute National Statistical Office, 2009, Factor analysis and issues of the society change for the next 10 years National Statistical Office, 2010, Yesterday, today and tomorrow of the baby boom generation reviewing by International Symposium On Smart Aging 2011 Jae-ryong Park et al. , 2010, Review on the real estate market decrease and trend, Samsung Economic the statistics Fidelity Asset Management, 2011, Fidelity Retirement White Paper, Viewpoint vol. 4 Gyu-wan Hwang / Eun-gyeong Park, 2010, "Forecast on the supply and demand of houses reviewing through the estimation of the housing demand", Real estate financing research institute of the Merits Securities. 127
International Symposium On Smart Aging 2011 Memo 128 Memo
Memo International Symposium On Smart Aging 2011 Memo 129