Heat Watch Improving 3 D NAND Flash Memory






- Slides: 68
Heat. Watch Improving 3 D NAND Flash Memory Device Reliability by Exploiting Self-Recovery and Temperature Awareness Yixin Luo Saugata Ghose Yu Cai Erich F. Haratsch Onur Mutlu
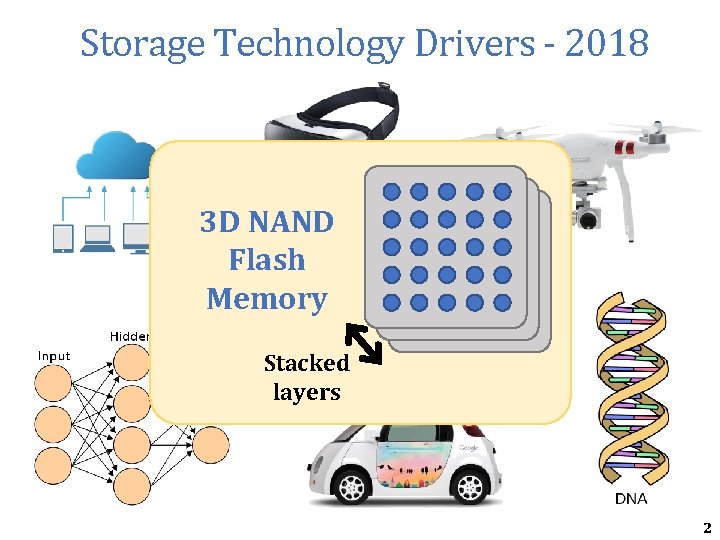
Storage Technology Drivers - 2018 3 D NAND Store large amounts Flash of data reliably Memory for months to years Stacked layers 2
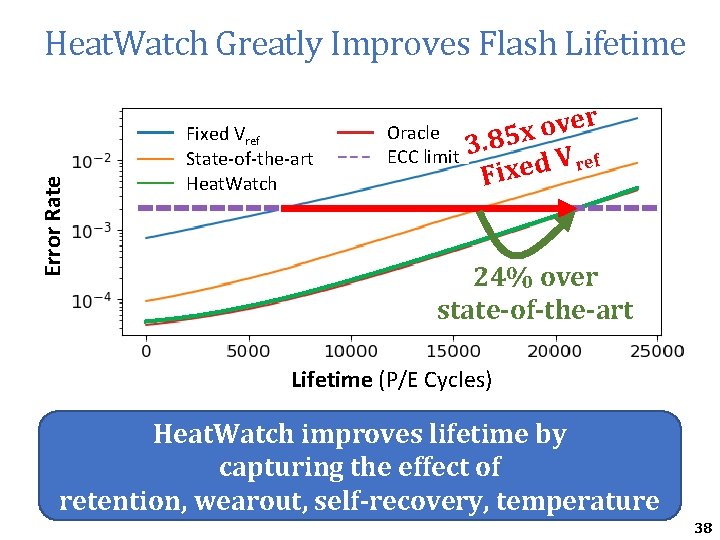
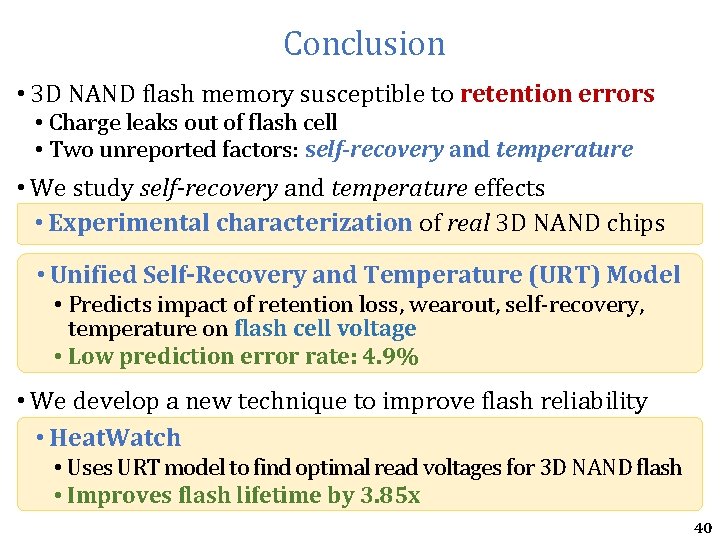
Executive Summary • 3 D NAND flash memory susceptible to retention errors • Charge leaks out of flash cell • Two unreported factors: self-recovery and temperature • We study self-recovery and temperature effects • Experimental characterization of real 3 D NAND chips • Unified Self-Recovery and Temperature (URT) Model • Predicts impact of retention loss, wearout, self-recovery, temperature on flash cell voltage • Low prediction error rate: 4. 9% • We develop a new technique to improve flash reliability • Heat. Watch • Uses URT model to find optimal read voltages for 3 D NAND flash • Improves flash lifetime by 3. 85 x 3
Outline • Executive Summary • Background on NAND Flash Reliability • Characterization of Self-Recovery and Temperature Effect on Real 3 D NAND Flash Memory Chips • URT: Unified Self-Recovery and Temperature Model • Heat. Watch Mechanism • Conclusion 4
3 D NAND Flash Memory Background Charge = Threshold Voltage 3 D NAND Flash Memory Flash Cell – – Higher Voltage State Data Value = 0 – Read Reference Voltage Lower Voltage State Data Value = 1 5
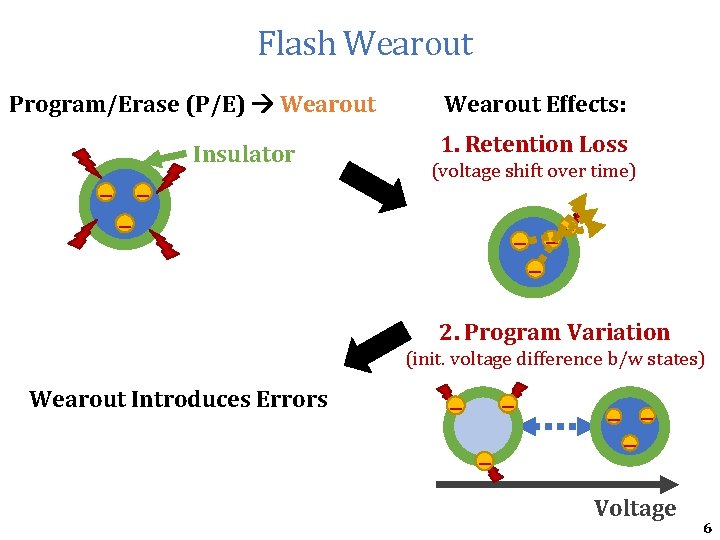
Flash Wearout Program/Erase (P/E) Wearout Insulator – – – Wearout Effects: 1. Retention Loss (voltage shift over time) – –– – 2. Program Variation (init. voltage difference b/w states) Wearout Introduces Errors – – – Voltage 6
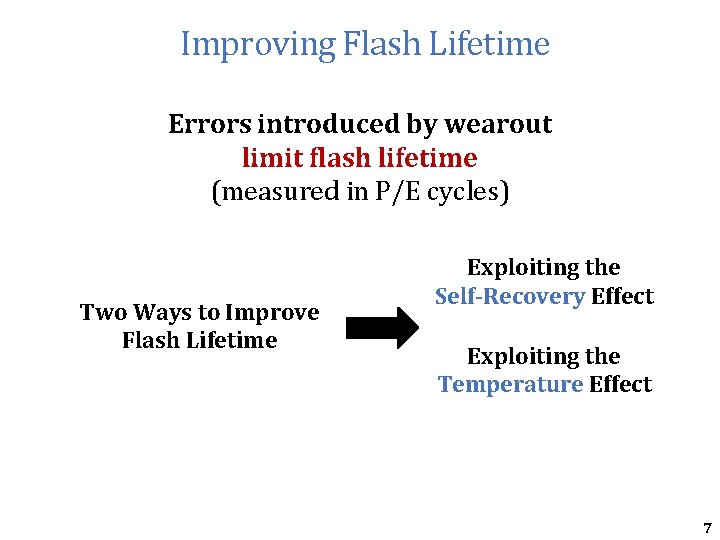
Improving Flash Lifetime Errors introduced by wearout limit flash lifetime (measured in P/E cycles) Two Ways to Improve Flash Lifetime Exploiting the Self-Recovery Effect Exploiting the Temperature Effect 7
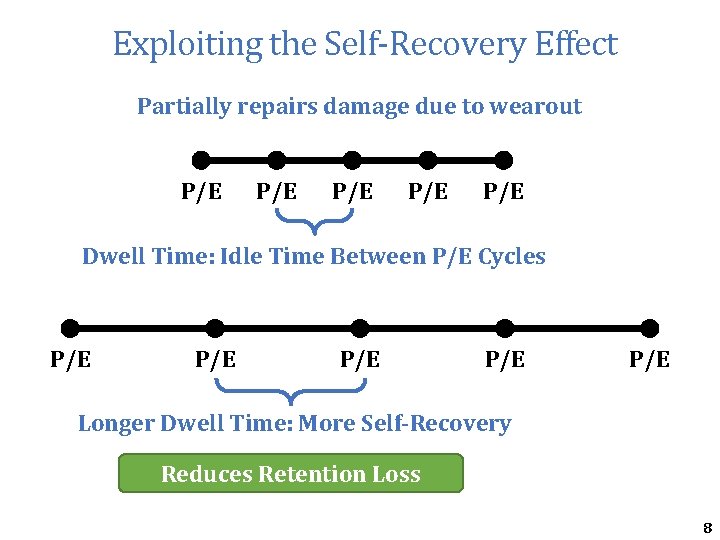
Exploiting the Self-Recovery Effect Partially repairs damage due to wearout P/E P/E P/E Dwell Time: Idle Time Between P/E Cycles P/E P/E P/E Longer Dwell Time: More Self-Recovery Reduces Retention Loss 8
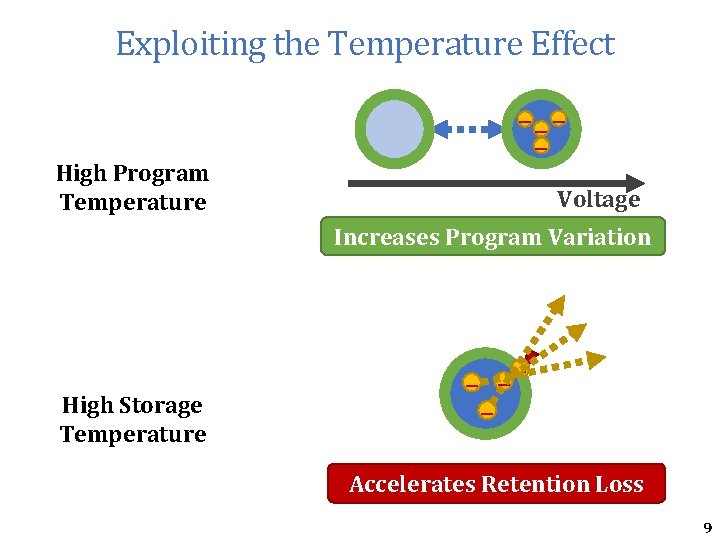
Exploiting the Temperature Effect High Program Temperature – –– – – Voltage Increases Program Variation High Storage Temperature – – Accelerates Retention Loss 9
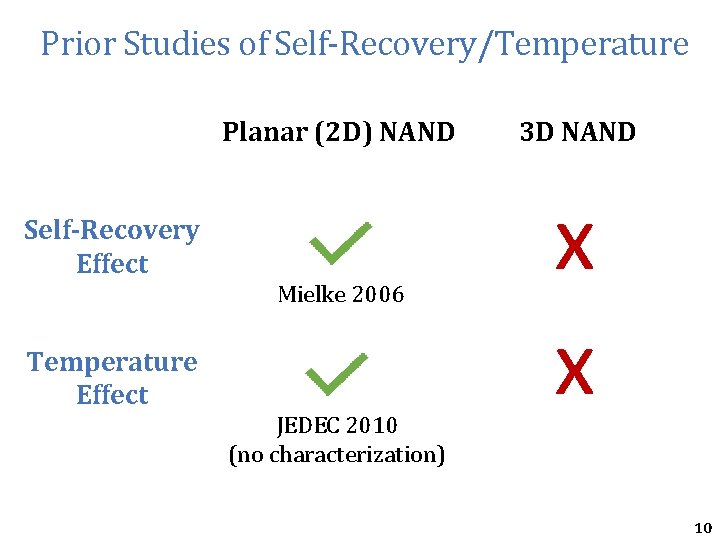
Prior Studies of Self-Recovery/Temperature Planar (2 D) NAND 3 D NAND Mielke 2006 x x Self-Recovery Effect Temperature Effect JEDEC 2010 (no characterization) 10
Outline • Executive Summary • Background on NAND Flash Reliability • Characterization of Self-Recovery and Temperature Effect on Real 3 D NAND Flash Memory Chips • URT: Unified Self-Recovery and Temperature Model • Heat. Watch Mechanism • Conclusion 11
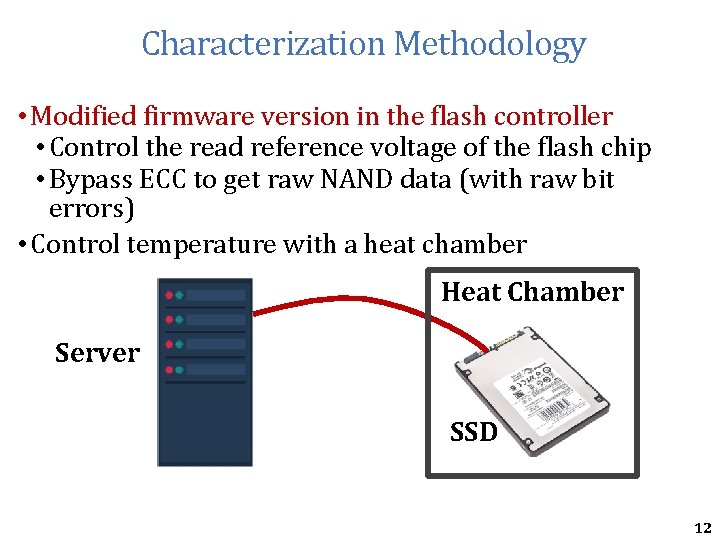
Characterization Methodology • Modified firmware version in the flash controller • Control the read reference voltage of the flash chip • Bypass ECC to get raw NAND data (with raw bit errors) • Control temperature with a heat chamber Heat Chamber Server SSD 12
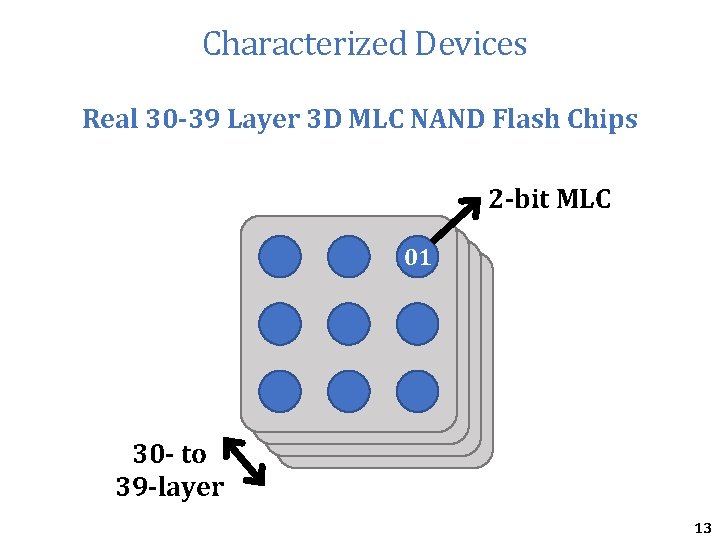
Characterized Devices Real 30 -39 Layer 3 D MLC NAND Flash Chips 2 -bit MLC 01 01 30 - to 39 -layer 13
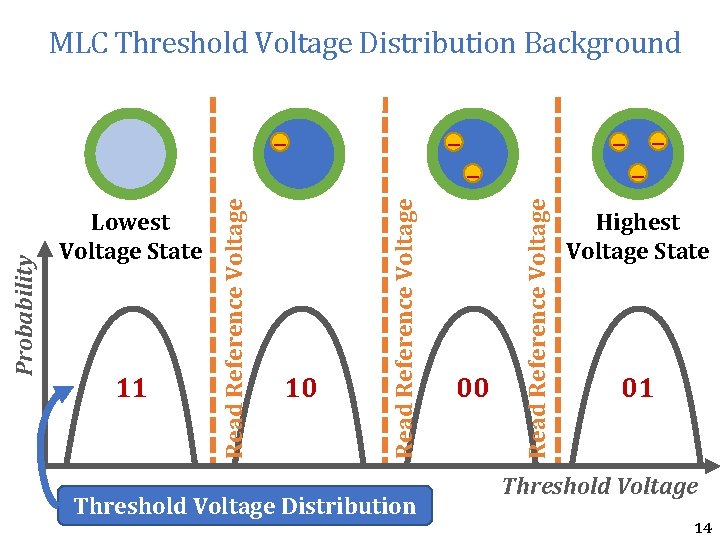
MLC Threshold Voltage Distribution Background 10 Threshold Voltage Distribution – – 00 Read Reference Voltage 11 – Read Reference Voltage Lowest Voltage State Read Reference Voltage Probability – Highest Voltage State 01 Threshold Voltage 14
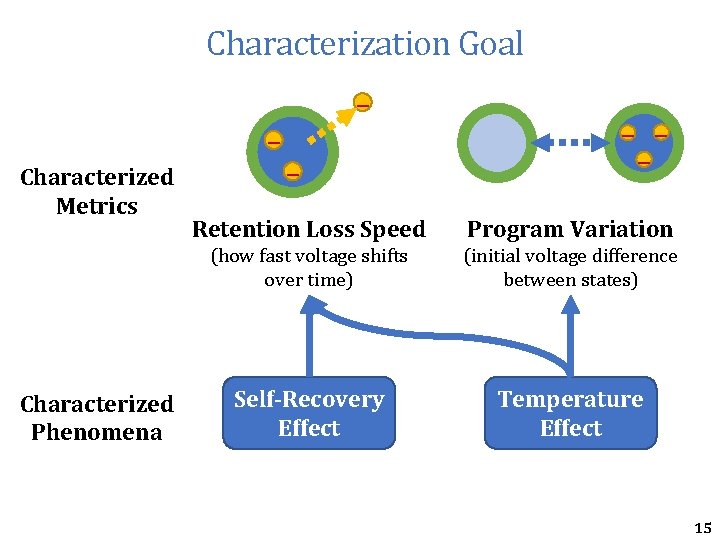
Characterization Goal – – Characterized Metrics Characterized Phenomena – – Retention Loss Speed Program Variation (how fast voltage shifts over time) (initial voltage difference between states) Self-Recovery Effect Temperature Effect 15
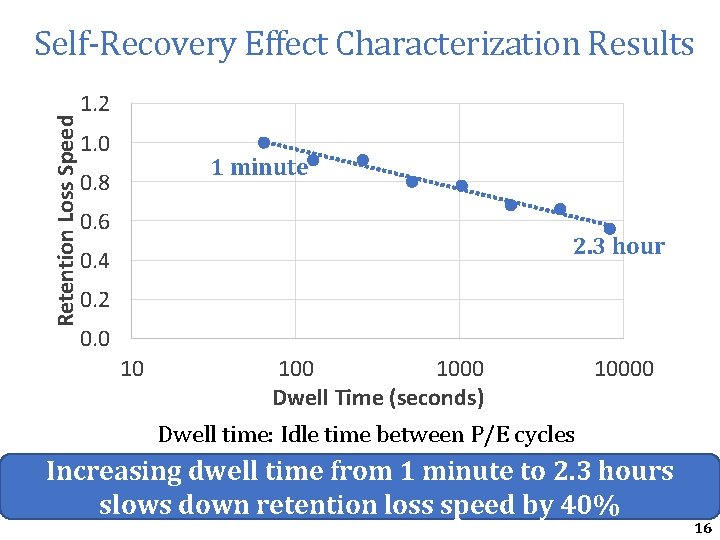
Retention Loss Speed Self-Recovery Effect Characterization Results 1. 2 1. 0 1 minute 0. 8 0. 6 2. 3 hour 0. 4 0. 2 0. 0 10 1000 Dwell Time (seconds) 10000 Dwell time: Idle time between P/E cycles Increasing dwell time from 1 minute to 2. 3 hours slows down retention loss speed by 40% 16
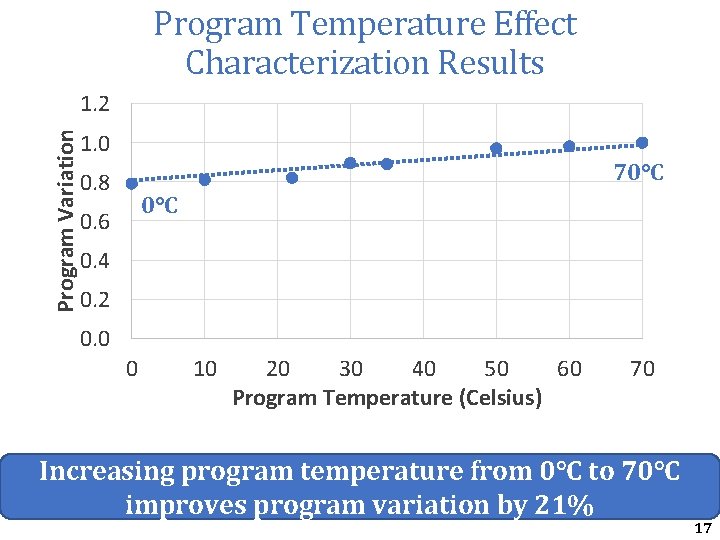
Program Temperature Effect Characterization Results Program Variation 1. 2 1. 0 70°C 0. 8 0°C 0. 6 0. 4 0. 2 0. 0 0 10 20 30 40 50 60 Program Temperature (Celsius) 70 Increasing program temperature from 0°C to 70°C improves program variation by 21% 17
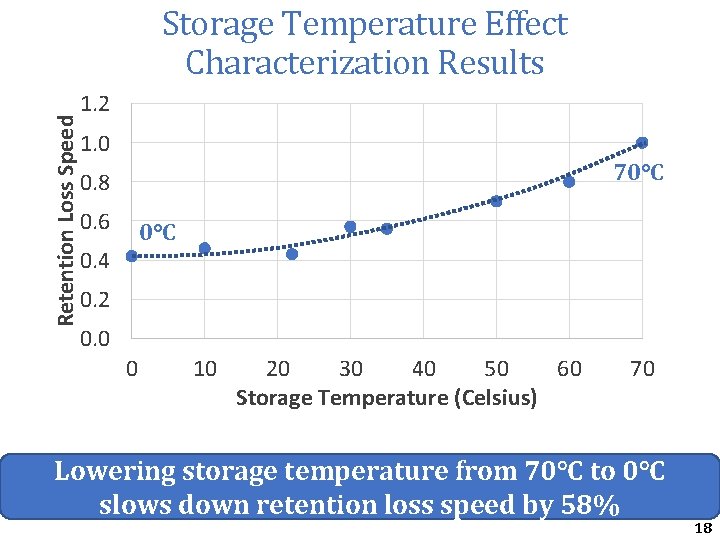
Retention Loss Speed Storage Temperature Effect Characterization Results 1. 2 1. 0 70°C 0. 8 0. 6 0°C 0. 4 0. 2 0. 0 0 10 20 30 40 50 60 Storage Temperature (Celsius) 70 Lowering storage temperature from 70°C to 0°C slows down retention loss speed by 58% 18
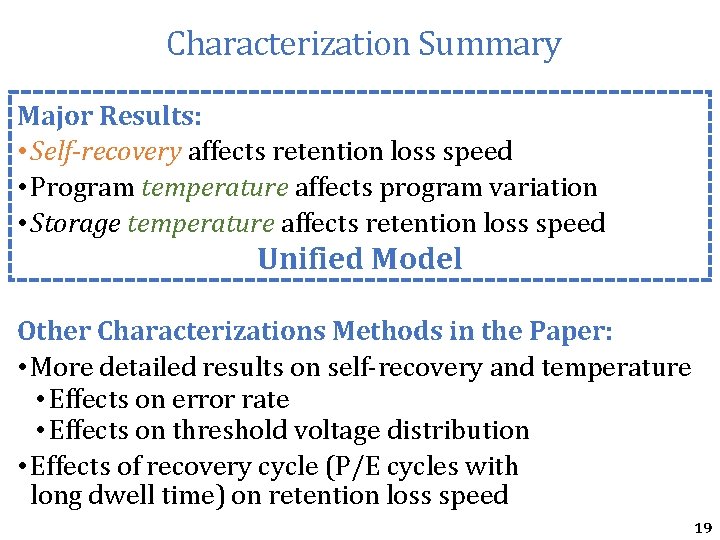
Characterization Summary Major Results: • Self-recovery affects retention loss speed • Program temperature affects program variation • Storage temperature affects retention loss speed Unified Model Other Characterizations Methods in the Paper: • More detailed results on self-recovery and temperature • Effects on error rate • Effects on threshold voltage distribution • Effects of recovery cycle (P/E cycles with long dwell time) on retention loss speed 19
Outline • Executive Summary • Background on NAND Flash Reliability • Characterization of Self-Recovery and Temperature Effect on Real 3 D NAND Flash Memory Chips • URT: Unified Self-Recovery and Temperature Model • Heat. Watch Mechanism • Conclusion 20
Probability Minimizing 3 D NAND Errors Optimal Read Ref. Voltage … 00 Read Ref. Voltage 01 Retention Errors Threshold Voltage Optimal read reference voltage minimizes 3 D NAND errors 21
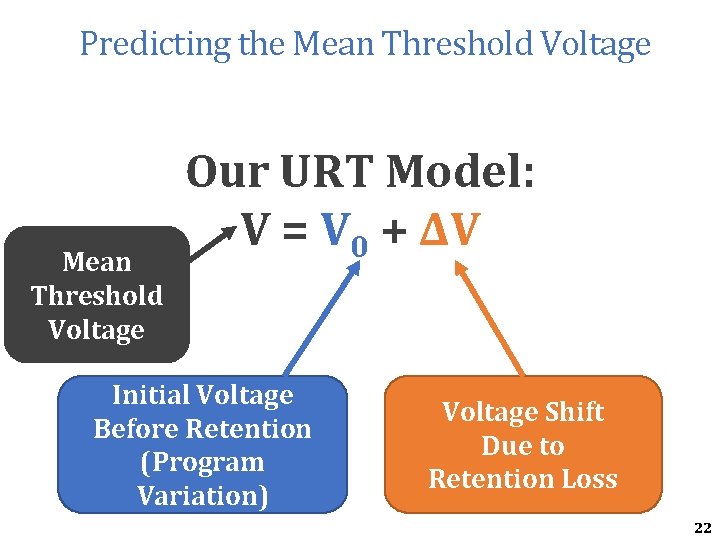
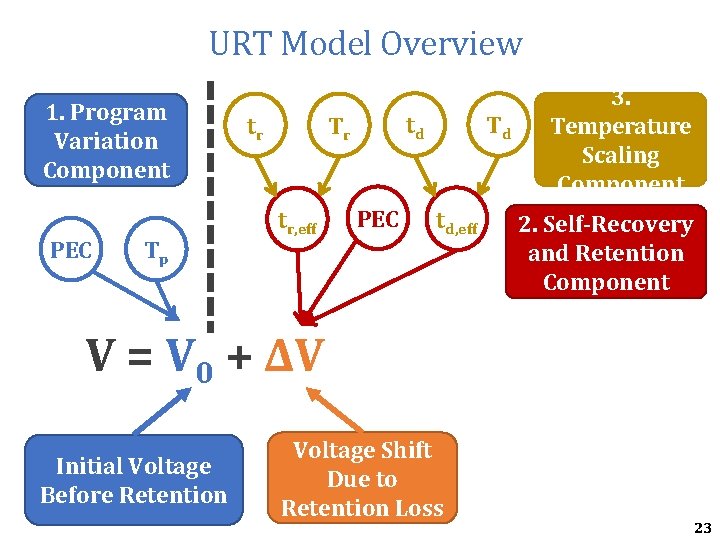
Predicting the Mean Threshold Voltage Our URT Model: V = V 0 + ΔV Initial Voltage Before Retention (Program Variation) Voltage Shift Due to Retention Loss 22
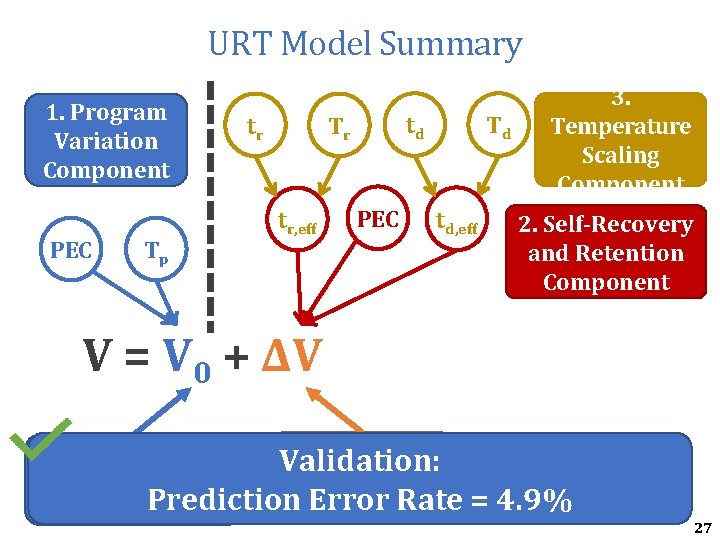
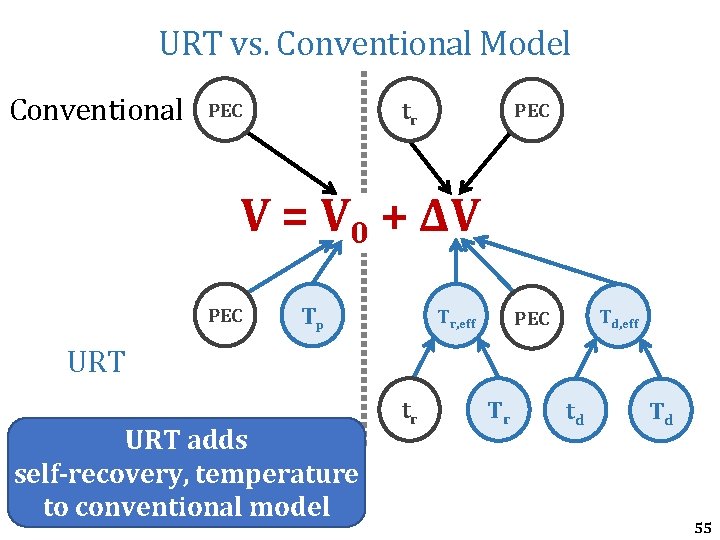
URT Model Overview 1. Program Variation Component PEC Tp tr td Tr tr, eff PEC Td td, eff 3. Temperature Scaling Component 2. Self-Recovery and Retention Component V = V 0 + ΔV Initial Voltage Before Retention Voltage Shift Due to Retention Loss 23
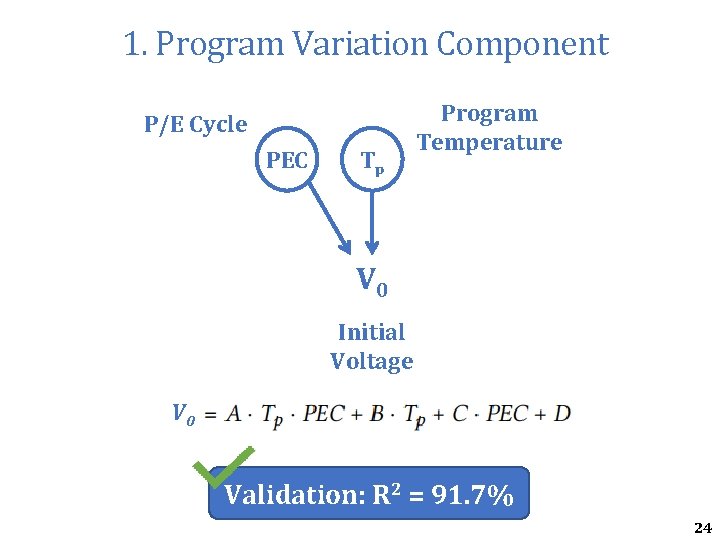
1. Program Variation Component P/E Cycle PEC Tp Program Temperature V 0 Initial Voltage V 0 Validation: R 2 = 91. 7% 24
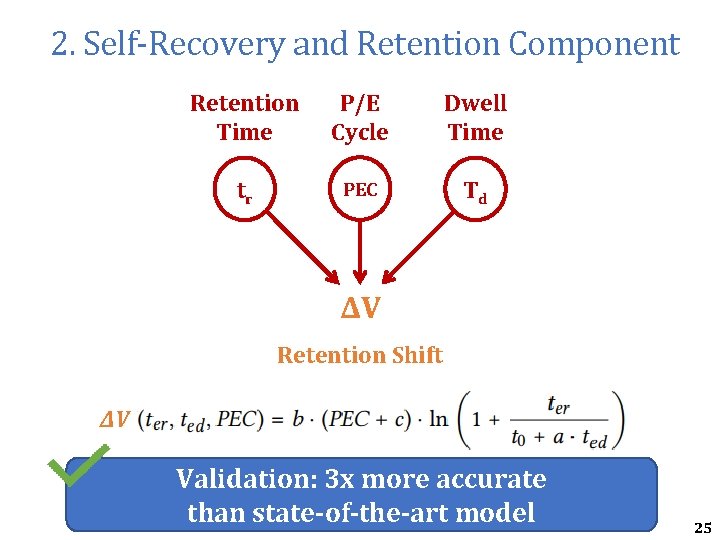
2. Self-Recovery and Retention Component Retention Time P/E Cycle Dwell Time tr PEC Td ΔV Retention Shift ΔV Validation: 3 x more accurate than state-of-the-art model 25
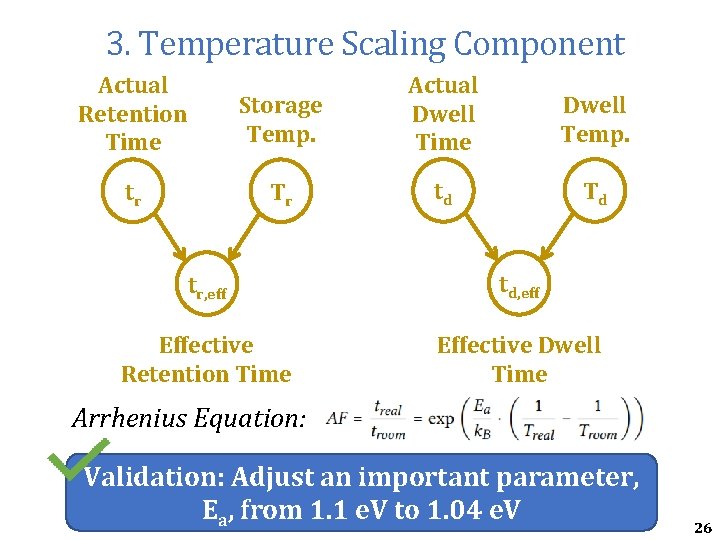
3. Temperature Scaling Component Actual Retention Time tr Storage Temp. Actual Dwell Time Dwell Temp. Tr td Td tr, eff td, eff Effective Retention Time Effective Dwell Time Arrhenius Equation: Validation: Adjust an important parameter, Ea, from 1. 1 e. V to 1. 04 e. V 26
URT Model Summary 1. Program Variation Component PEC Tp tr td Tr tr, eff PEC Td td, eff 3. Temperature Scaling Component 2. Self-Recovery and Retention Component V = V 0 + ΔV Voltage Shift Validation: Initial Voltage Due to Before Retention Prediction Error Loss Rate = 4. 9% Retention 27
Outline • Executive Summary • Background on NAND Flash Reliability • Characterization of Self-Recovery and Temperature Effect on Real 3 D NAND Flash Memory Chips • URT: Unified Self-Recovery and Temperature Model • Heat. Watch Mechanism • Conclusion 28
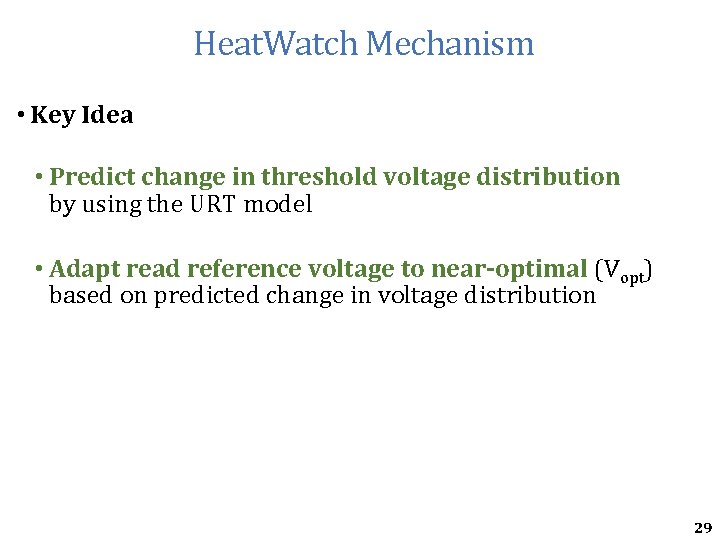
Heat. Watch Mechanism • Key Idea • Predict change in threshold voltage distribution by using the URT model • Adapt read reference voltage to near-optimal (Vopt) based on predicted change in voltage distribution 29
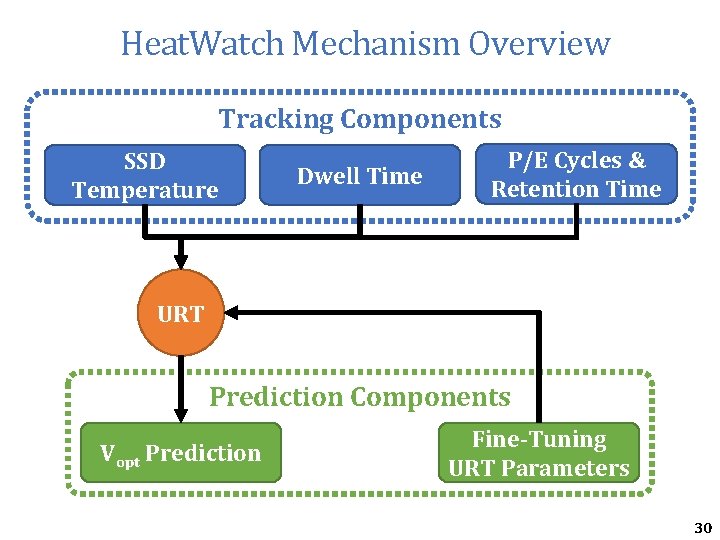
Heat. Watch Mechanism Overview Tracking Components SSD Temperature Dwell Time P/E Cycles & Retention Time URT Prediction Components Vopt Prediction Fine-Tuning URT Parameters 30
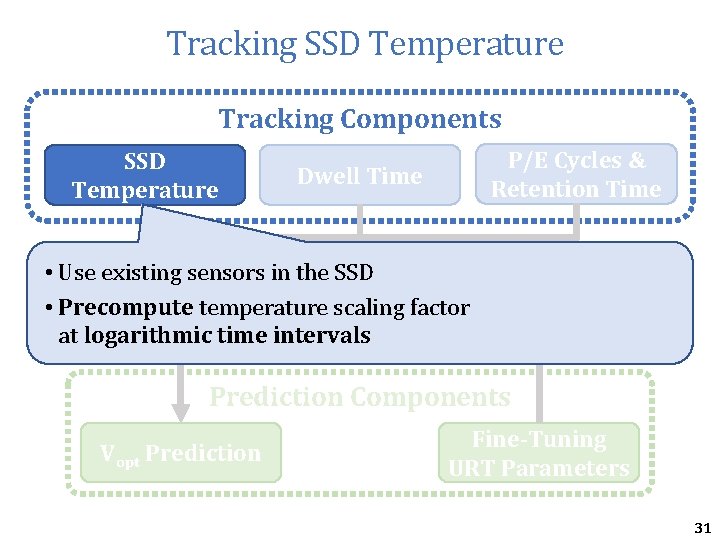
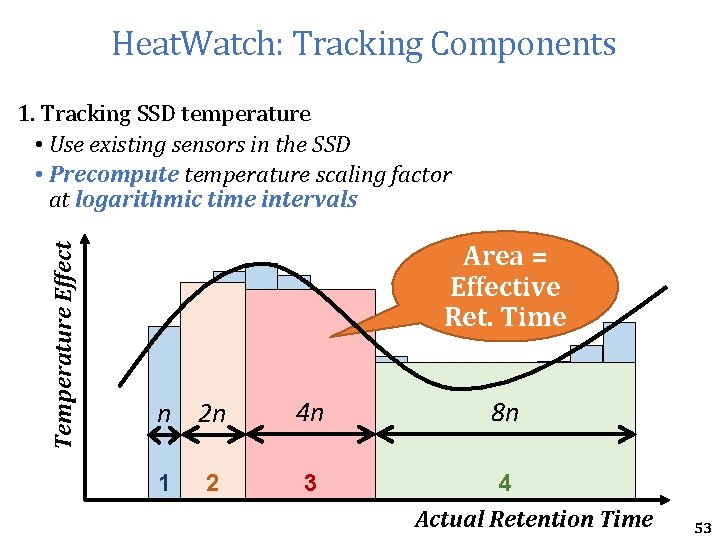
Tracking SSD Temperature Tracking Components SSD Temperature P/E Cycles & Retention Time Dwell Time • Use existing sensors in the SSD • Precompute URTtemperature scaling factor at logarithmic time intervals Prediction Components Vopt Prediction Fine-Tuning URT Parameters 31
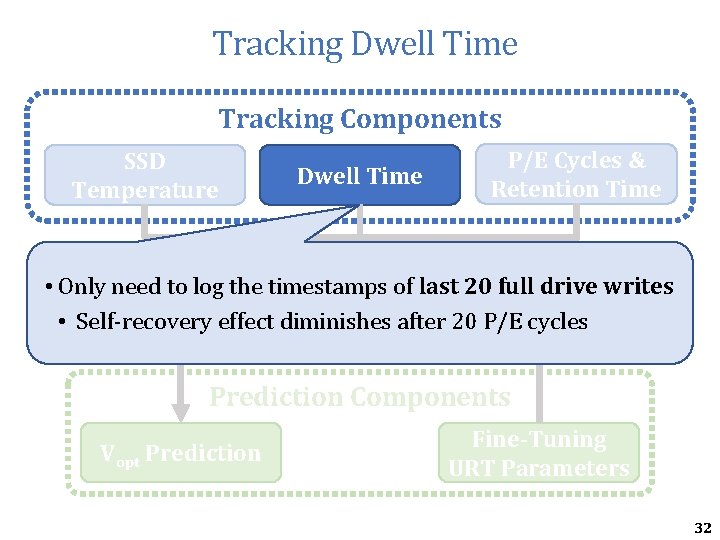
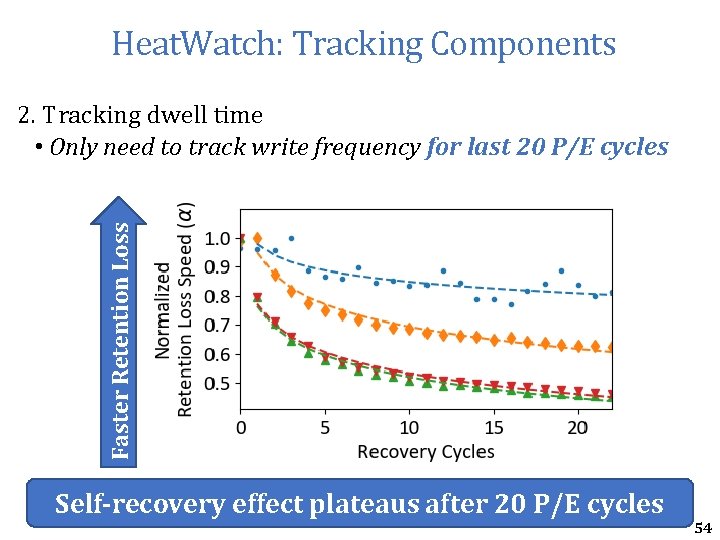
Tracking Dwell Time Tracking Components SSD Temperature Dwell Time P/E Cycles & Retention Time • Only need to log the timestamps of last 20 full drive writes URT effect diminishes after 20 P/E cycles • Self-recovery Prediction Components Vopt Prediction Fine-Tuning URT Parameters 32
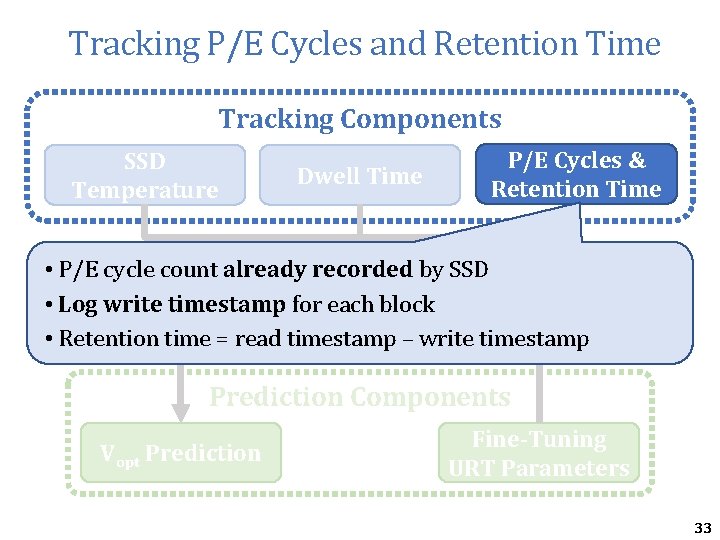
Tracking P/E Cycles and Retention Time Tracking Components SSD Temperature Dwell Time P/E Cycles & Retention Time • P/E cycle count already recorded by SSD • Log write. URT timestamp for each block • Retention time = read timestamp – write timestamp Prediction Components Vopt Prediction Fine-Tuning URT Parameters 33
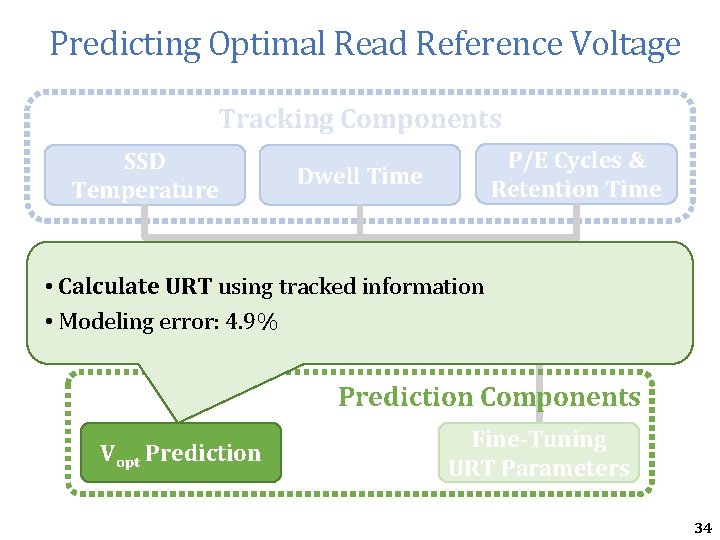
Predicting Optimal Read Reference Voltage Tracking Components SSD Temperature P/E Cycles & Retention Time Dwell Time • Calculate URT using tracked information • Modeling URT error: 4. 9% Prediction Components Vopt Prediction Fine-Tuning URT Parameters 34
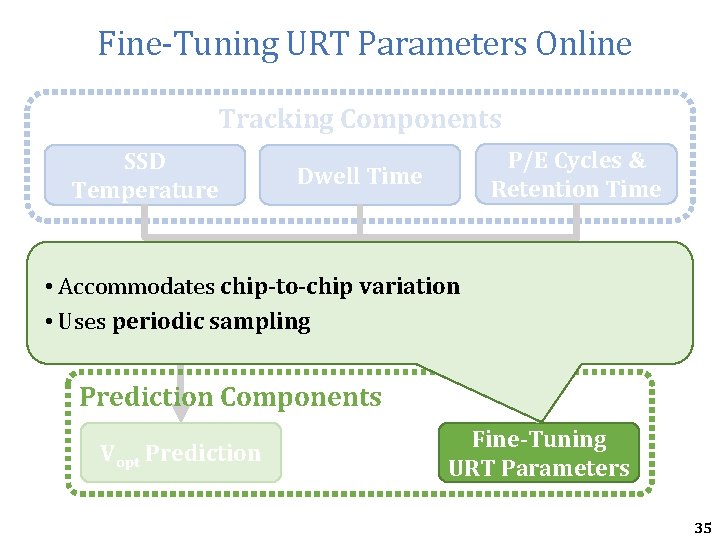
Fine-Tuning URT Parameters Online Tracking Components SSD Temperature P/E Cycles & Retention Time Dwell Time • Accommodates chip-to-chip variation URT sampling • Uses periodic Prediction Components Vopt Prediction Fine-Tuning URT Parameters 35
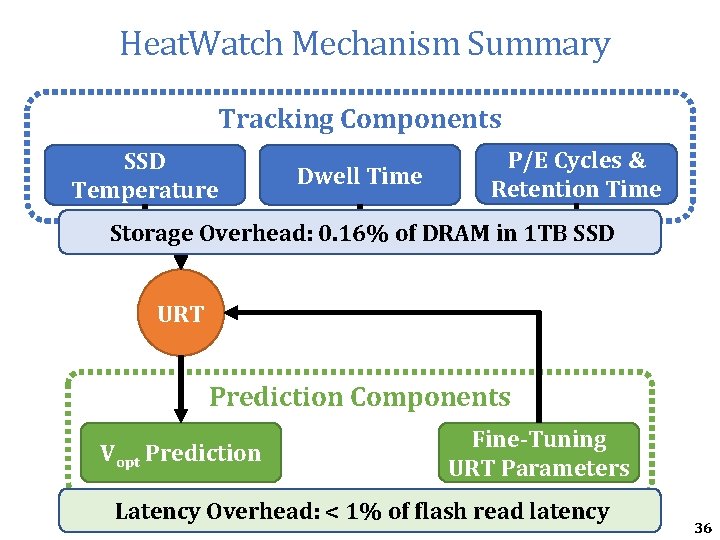
Heat. Watch Mechanism Summary Tracking Components SSD Temperature Dwell Time P/E Cycles & Retention Time Storage Overhead: 0. 16% of DRAM in 1 TB SSD URT Prediction Components Vopt Prediction Fine-Tuning URT Parameters Latency Overhead: < 1% of flash read latency 36
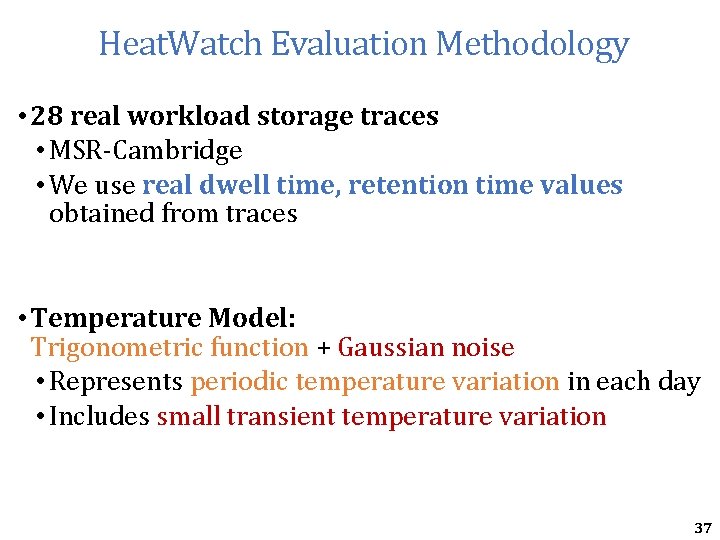
Heat. Watch Evaluation Methodology • 28 real workload storage traces • MSR-Cambridge • We use real dwell time, retention time values obtained from traces • Temperature Model: Trigonometric function + Gaussian noise • Represents periodic temperature variation in each day • Includes small transient temperature variation 37
Error Rate Heat. Watch Greatly Improves Flash Lifetime Fixed Vref State-of-the-art Heat. Watch Oracle ECC limit r e v o 3. 85 x V ef r d e x i F 24% over state-of-the-art Lifetime (P/E Cycles) Heat. Watch improves lifetime by capturing the effect of retention, wearout, self-recovery, temperature 38
Outline • Executive Summary • Background on NAND Flash Reliability • Characterization of Self-Recovery and Temperature Effect on Real 3 D NAND Flash Memory Chips • URT: Unified Self-Recovery and Temperature Model • Heat. Watch Mechanism • Conclusion 39
Conclusion • 3 D NAND flash memory susceptible to retention errors • Charge leaks out of flash cell • Two unreported factors: self-recovery and temperature • We study self-recovery and temperature effects • Experimental characterization of real 3 D NAND chips • Unified Self-Recovery and Temperature (URT) Model • Predicts impact of retention loss, wearout, self-recovery, temperature on flash cell voltage • Low prediction error rate: 4. 9% • We develop a new technique to improve flash reliability • Heat. Watch • Uses URT model to find optimal read voltages for 3 D NAND flash • Improves flash lifetime by 3. 85 x 40
Heat. Watch Improving 3 D NAND Flash Memory Device Reliability by Exploiting Self-Recovery and Temperature Awareness Yixin Luo Saugata Ghose Yu Cai Erich F. Haratsch Onur Mutlu 41
Backup Slides 42
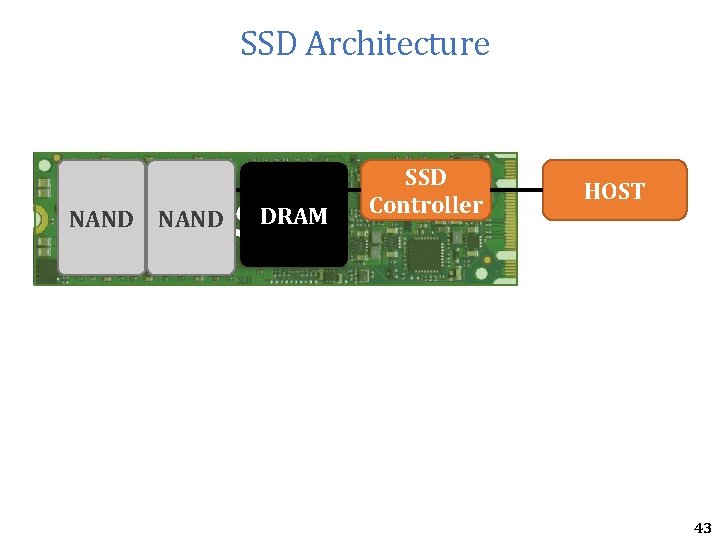
SSD Architecture NAND SSD DRAM SSD Controller HOST 43
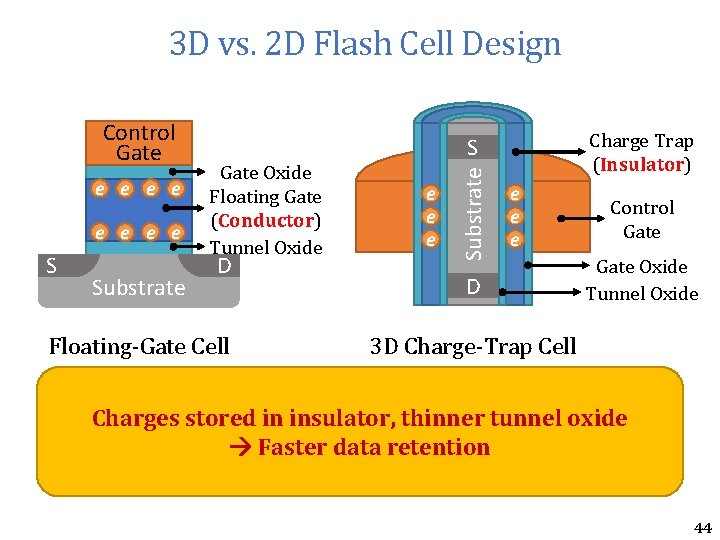
3 D vs. 2 D Flash Cell Design e e e e S Substrate Gate Oxide Floating Gate (Conductor) Tunnel Oxide D Floating-Gate Cell Charge Trap (Insulator) S e e e Substrate Control Gate e D Control Gate Oxide Tunnel Oxide 3 D Charge-Trap Cell Charges stored in insulator, thinner tunnel oxide Faster data retention 44
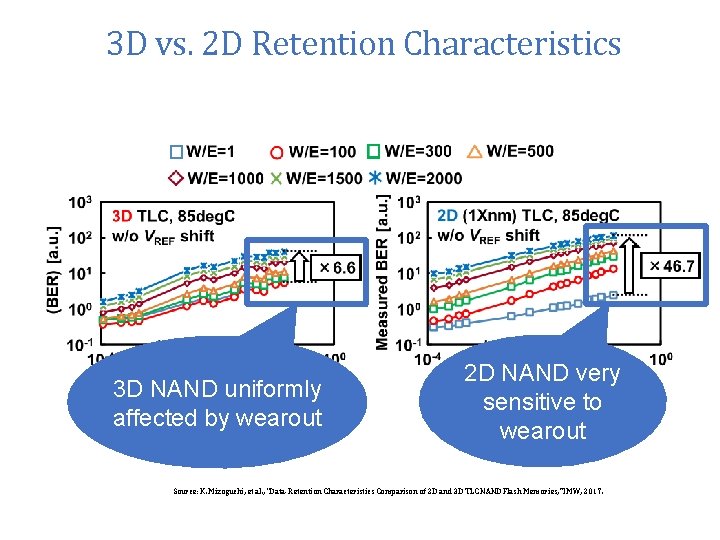
3 D vs. 2 D Retention Characteristics 3 D NAND uniformly affected by wearout 2 D NAND very sensitive to wearout Source: K. Mizoguchi, et al. , “Data-Retention Characteristics Comparison of 2 D and 3 D TLC NAND Flash Memories, ” IMW, 2017.
Limitations • Vendor-to-vendor variation • Self-recovery and temperature effect should be similar for 3 D charge trap NAND (Samsung, Hynix, Toshiba, Sandisk) • Chip-to-chip variation • Each of our experiments takes several months • Expect future large-scale study on 3 D NAND errors Not our limitation: • Any process variation within a chip • Our results include tens of randomly selected flash blocks • ~1 million cells 46
Generalizability of Results • Should apply to other 3 D NAND flash memory that uses charge trap cells (Samsung, Hynix, Toshiba, Sandisk) 47
Self-Recovery and Temperature in Planar NAND • UDM [Mielke 2006] • Only models retention shift, no initial voltage • Exponential P/E cycle effect • Activation energy for planar NAND • 3 other works propose mechanism and speculate different lifetime improvements • 211 x [Mohan+ Hot. Storage 10] • 5. 8 x [Wu+ Hot. Storage 11] • 2. 8 x [Lee+ FAST 12] 48
Novelty vs. UDM • 3 D charge trap cells are more resilient to P/E cycling than floating -gate cells in planar NAND • Different activation energy • Program temperature effect not discussed in planar NAND 49
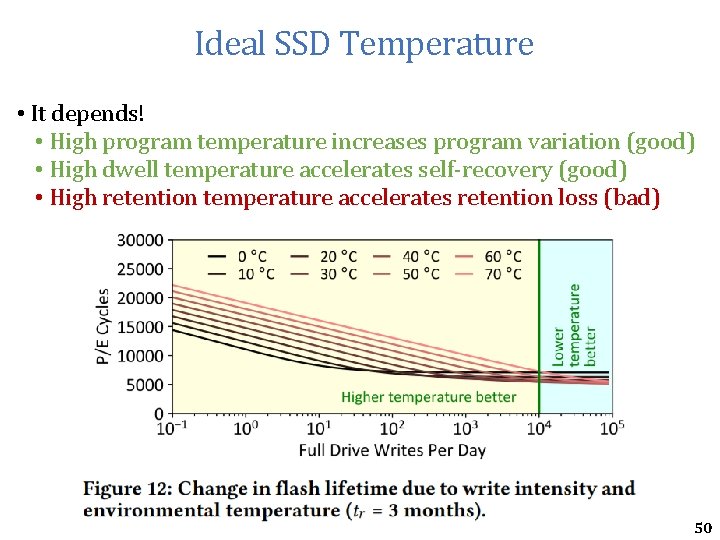
Ideal SSD Temperature • It depends! • High program temperature increases program variation (good) • High dwell temperature accelerates self-recovery (good) • High retention temperature accelerates retention loss (bad) 50
URT Fine Tuning • Randomly sample 10 wordlines in each chip • Learn Vopt by sweeping Vref • Fit URT model with newly learned Vopt 51
Heat. Watch Overhead Storage Overhead: • Tracking SSD Temperature • 26 logarithmic intervals • 208 B • Program temperature, dwell time, program time per block • 1. 5 MB • Dwell time • Timestamp for last 20 full drive writes • 85 B • Latency Overhead: • <1% of flash read latency (25 us) 52
Heat. Watch: Tracking Components Temperature Effect 1. Tracking SSD temperature • Use existing sensors in the SSD • Precompute temperature scaling factor at logarithmic time intervals Area = Effective Ret. Time n 2 n 4 n 8 n 1 2 2 3 4 5 3 6 7 8 9 10 11412 13 14 15 Actual Retention Time 53
Heat. Watch: Tracking Components Faster Retention Loss 2. Tracking dwell time • Only need to track write frequency for last 20 P/E cycles Self-recovery effect plateaus after 20 P/E cycles 54
URT vs. Conventional Model Conventional tr PEC V = V 0 + ΔV PEC Tp Tr, eff Td, eff PEC URT adds self-recovery, temperature to conventional model tr Tr td Td 55
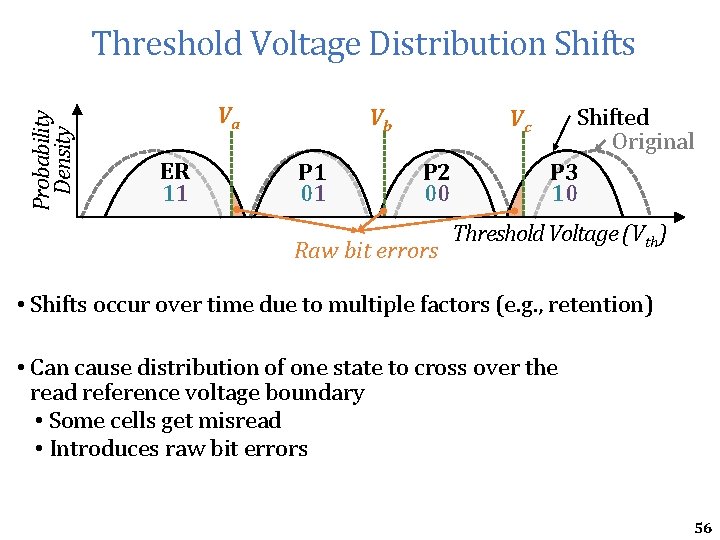
Probability Density Threshold Voltage Distribution Shifts Va ER 11 Vb P 1 01 Vc P 2 00 Raw bit errors Shifted Original P 3 10 Threshold Voltage (Vth) • Shifts occur over time due to multiple factors (e. g. , retention) • Can cause distribution of one state to cross over the read reference voltage boundary • Some cells get misread • Introduces raw bit errors 56
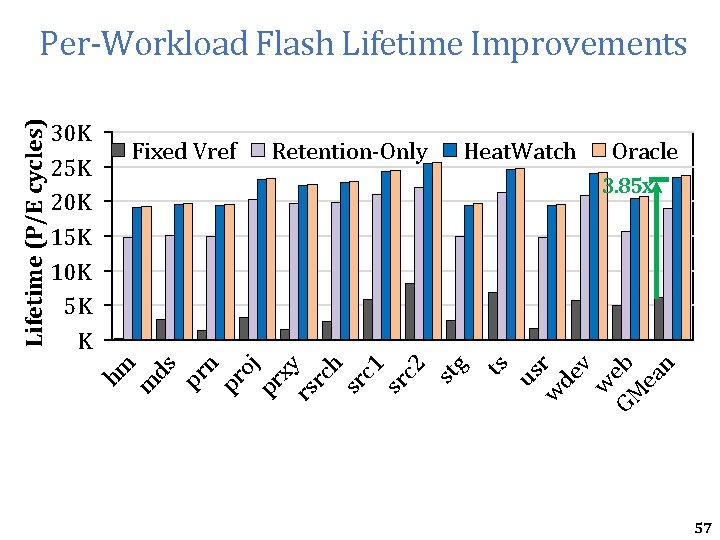
Retention-Only Heat. Watch Oracle w r de v w GM eb ea n us ts 3. 85 x g Fixed Vref st 30 K 25 K 20 K 15 K 10 K 5 K K hm m ds pr n pr oj pr xy rs rc h sr c 1 sr c 2 Lifetime (P/E cycles) Per-Workload Flash Lifetime Improvements 57
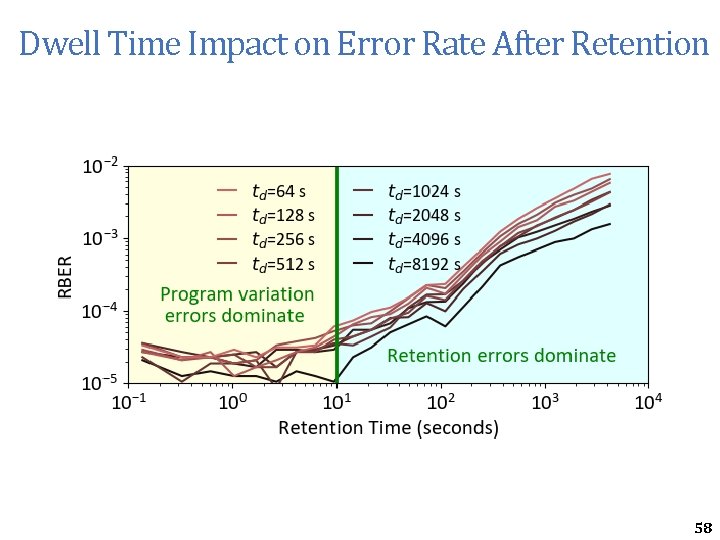
Dwell Time Impact on Error Rate After Retention 58
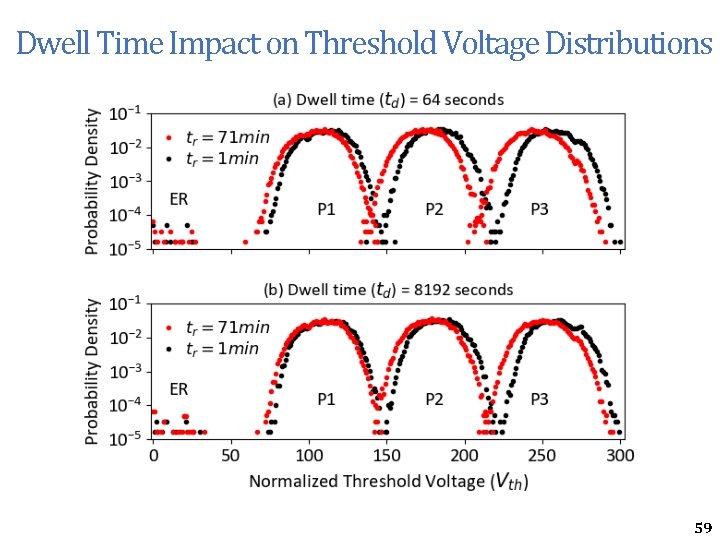
Dwell Time Impact on Threshold Voltage Distributions 59
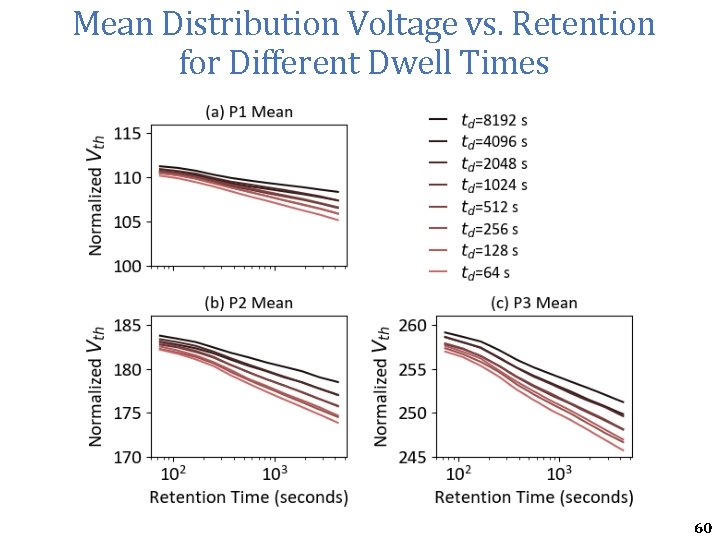
Mean Distribution Voltage vs. Retention for Different Dwell Times 60
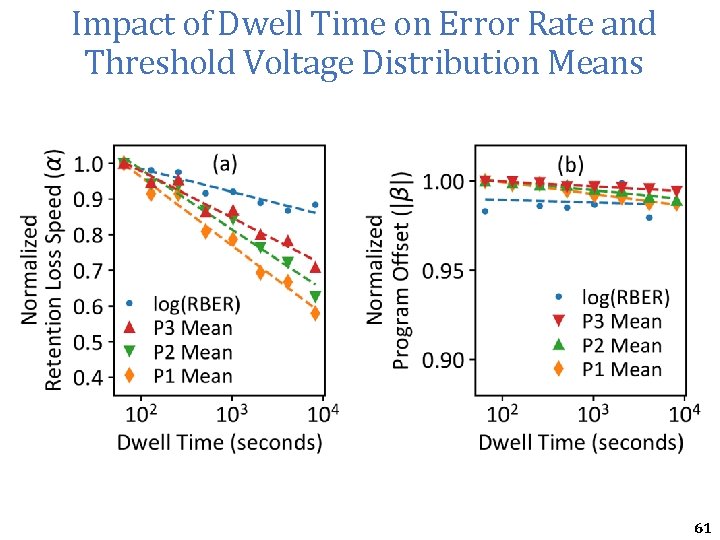
Impact of Dwell Time on Error Rate and Threshold Voltage Distribution Means 61
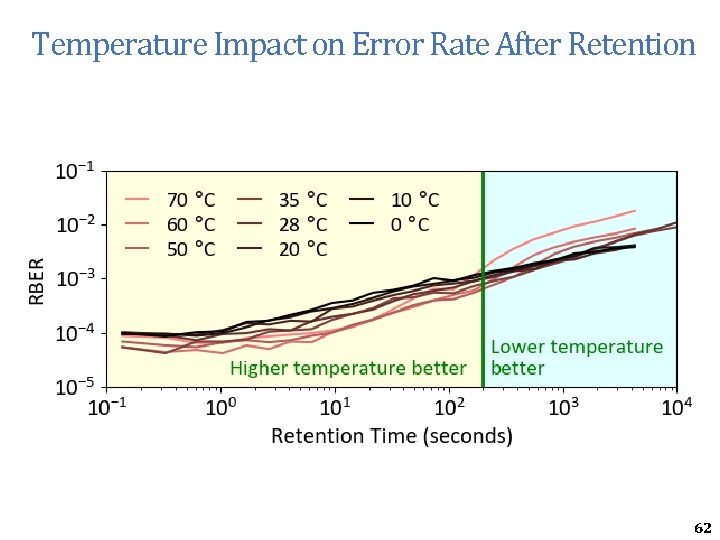
Temperature Impact on Error Rate After Retention 62
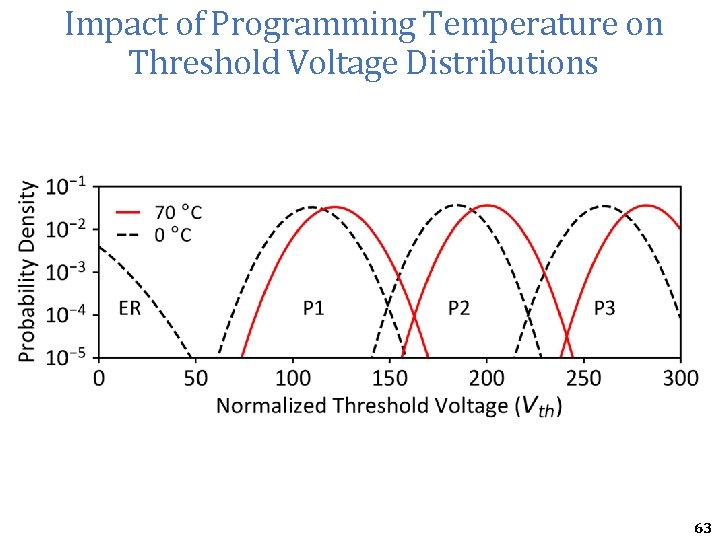
Impact of Programming Temperature on Threshold Voltage Distributions 63
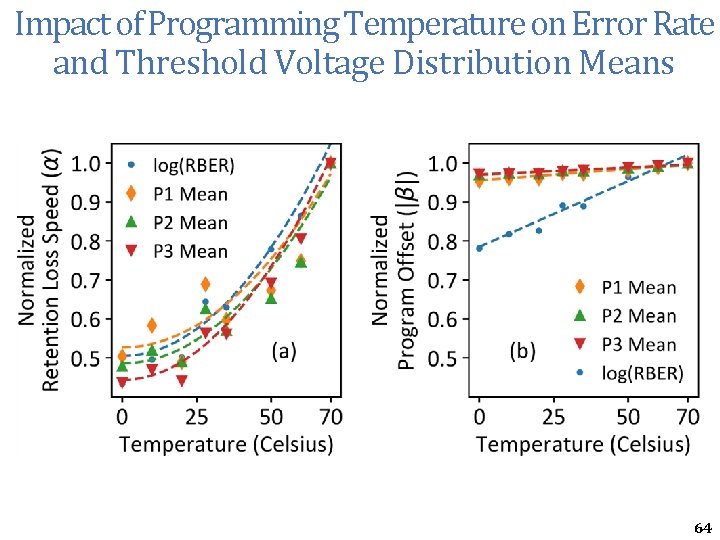
Impact of Programming Temperature on Error Rate and Threshold Voltage Distribution Means 64
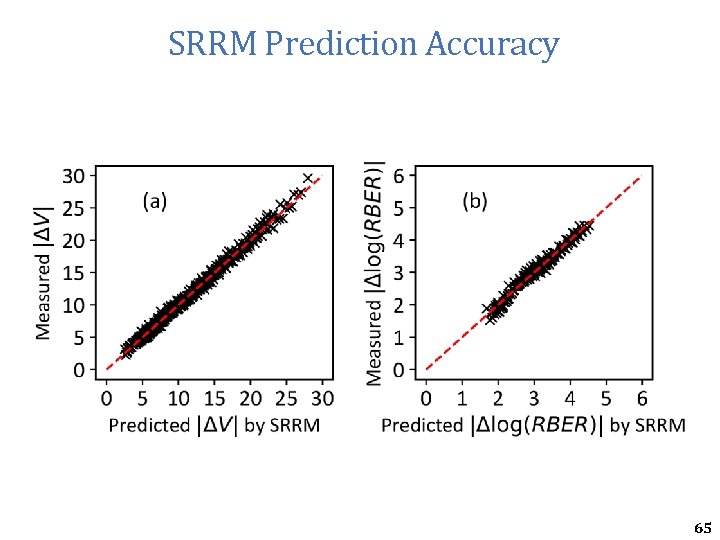
SRRM Prediction Accuracy 65
Change in Flash Lifetime Due to Programming Temperature and Write Intensity 66
Optimal Read Reference Voltage: Measured vs. Predicted by URT 67
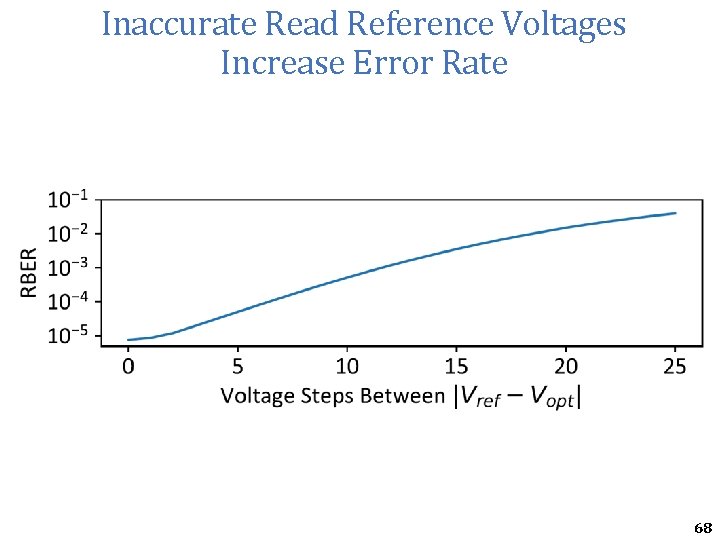
Inaccurate Read Reference Voltages Increase Error Rate 68