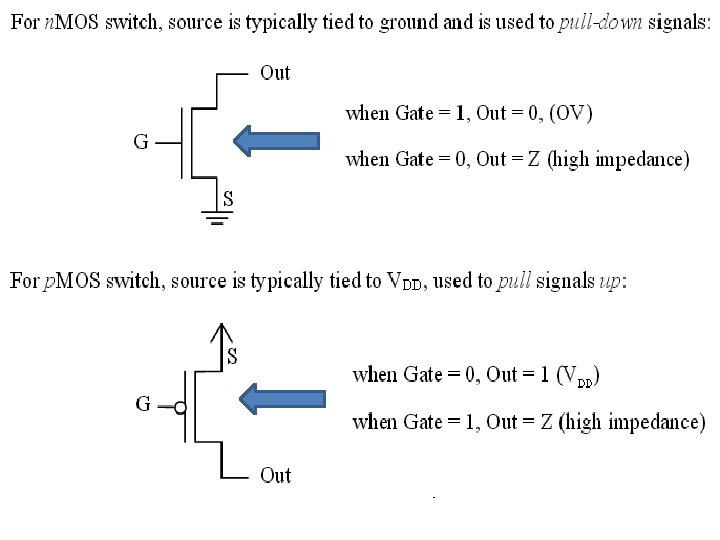
NMOS PMOS KMap of NAND gate CMOS Realization


 Thus, the depth of the depletion region is ( 4) and the")


 Structure: The basic structure of an n-channel")


- Slides: 32
NMOS PMOS
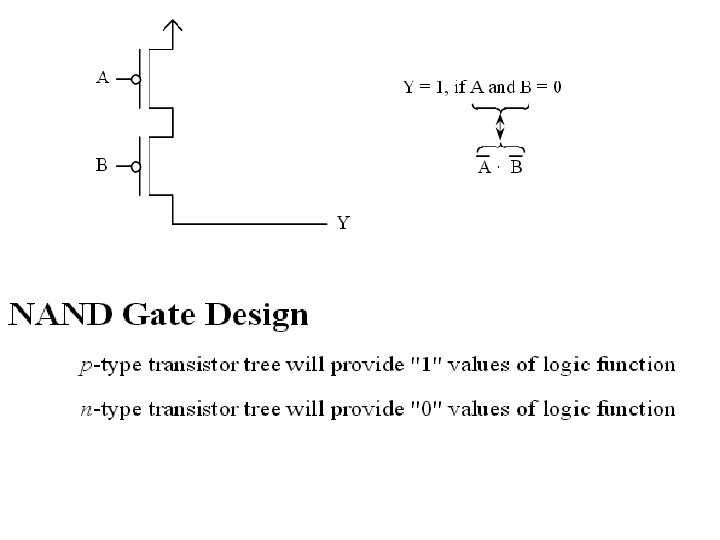
K-Map of NAND gate CMOS Realization of NAND gate
K-Map
CMOS -NOR gate CMOS Realization of NOR gate
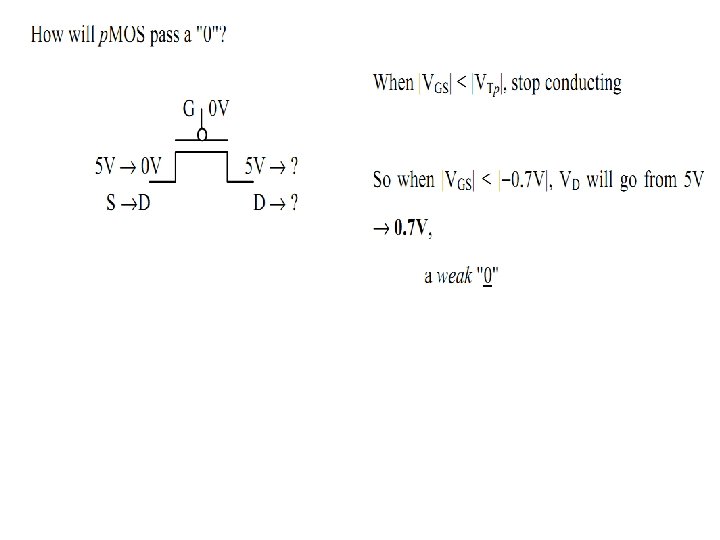
Only one threshold voltage drop across series of n. MOS transistors. Conducting
AND gate Fig: CMOS Realization of AND gate
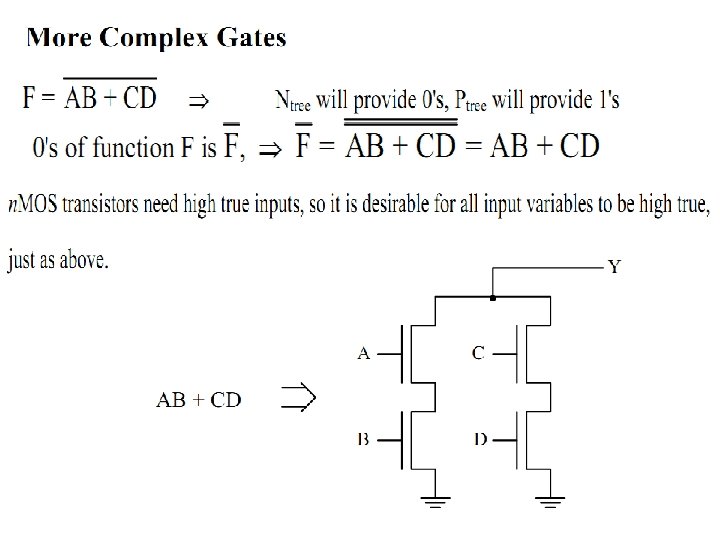
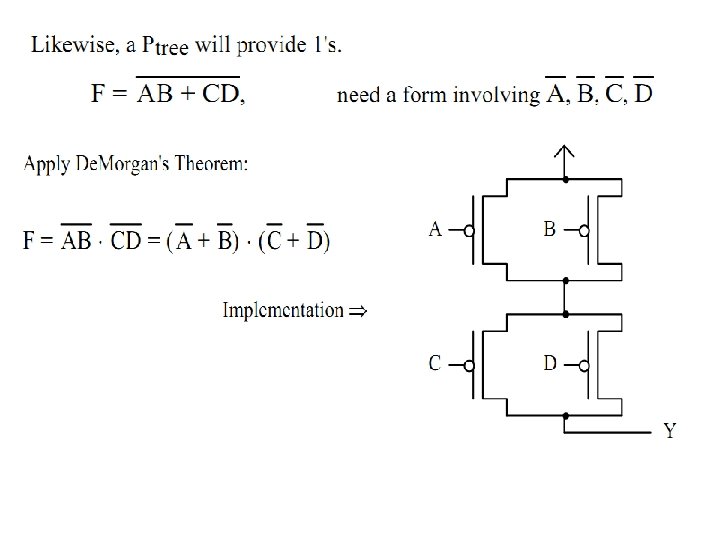
Ptree
Let us discuss the electrical behavior of the MOS structure under externally applied bias voltages. Assume that the substrate voltage is set at VB = 0, and let the gate voltage be the controlling parameter. Depending on the polarity and the magnitude of VG, three different operating regions can be observed for the MOS system: accumulation, depletion, and inversion. Figure. The cross-sectional view and the energy band diagram of the MOS structure operating in accumulation region.
• If a negative voltage VG is applied to the gate electrode, the holes in the p-type substrate are attracted to the semiconductor-oxide interface. • The majority carrier concentration near the surface becomes larger than the equilibrium hole concentration in the substrate; hence, this condition is called carrier accumulation on the surface (Fig. 3. 5). Note that in this case, the oxide electric field is directed towards the gate electrode. • The negative surface potential also causes the energy bands to bend upward near the surface. While the hole density near the surface increases as a result of the applied negative gate bias, the electron (minority carrier) concentration decreases as the negatively charged electrons are pushed deeper into the substrate.
Case-2: Now consider the next case in which a small positive gate bias VG is applied to the gate electrode. Since the substrate bias(VB) is zero, the oxide electric field will be directed towards the substrate in this case. Fig: The cross-sectional view and the energy band diagram of the MOS structure operating in depletion mode, under small gate bias. The positive surface potential causes the energy bands to bend downward near the surface, as shown in above Figure. The majority carriers, i. e. , the holes in the substrate, will be repelled back into the substrate as a result of the positive gate bias, and these holes will leave negatively charged fixed acceptor ions behind. Thus, a depletion region is created near the surface. Note that under this bias condition, the region near the semiconductor-oxide interface is
The thickness xd of this depletion region on the surface can easily be found as a function of the surface potential S. Assume that the mobile hole charge in a thin horizontal layer parallel to the surface is ( 1) The change in surface potential required to displace this charge sheet d. Q by a distance Xd away from the surface can be found by using the Poisson equation ( 2) Integrating equation (1) along the vertical dimension (perpendicular to the surface) yields
( 3) Thus, the depth of the depletion region is ( 4) and the depletion region charge density, which consists solely of fixed acceptor ions in this region, is given by the following expression. ( 5)
Case-3: Consider next a further increase in the positive gate bias. As a result of the increasing surface potential, the downward bending of the energy bands will increase as well. Eventually, the mid-gap energy level Ei becomes smaller than the Fermi level EFP on the surface, which means that the substrate semiconductor in this region becomes n-type. Fig: The cross-sectional view and the energy band diagram of the MOS structure in surface inversion, under larger gate bias voltage. Within this thin layer, the electron density is larger than the majority hole density, since the positive gate potential attracts additional minority carriers (electrons) from the bulk substrate to the surface of above fig. The n-type region created near the surface by the positive gate bias is called the inversion layer, and this condition is called surface inversion. It will be seen that the thin inversion layer on the surface with a large mobile electron concentration can be utilized for conducting current between two terminals of the MOS
ØThe surface is said to be inverted when the density of mobile electrons on the surface becomes equal to the density of holes in the bulk (p-type) substrate. ØThis condition requires that the surface potential has the same magnitude, but the reverse polarity, as the bulk Fermi potential F. Once the surface is inverted, any further increase in the gate voltage leads to an increase of mobile electron concentration on the surface, but not to an increase of the depletion depth. ØThus, the depletion region depth achieved at the onset of surface inversion is also equal to the maximum depletion depth, xdm, which remains constant for higher gate voltages. Using the inversion condition S = - F , the maximum depletion region depth at the onset of surface inversion can be found from (3. 11) as follows:
Band diagram of the MOS structure underneath the gate, at surface inversion. Notice the band bending by 12 OF 1 at the surface.
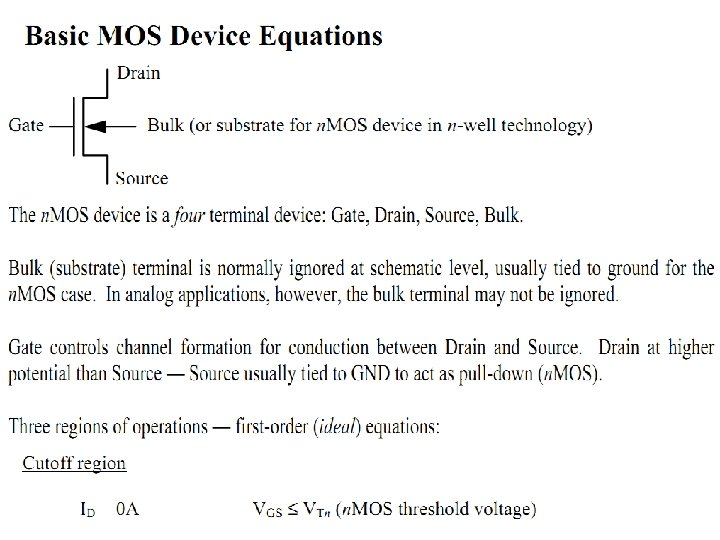
Structure and Operation of MOS Transistor (MOSFET) Structure: The basic structure of an n-channel MOSFET is shown in Fig. below. This four-terminal device consists of a p-type substrate, in which two n+ diffusion regions, the drain and the source, are formed. The surface of the substrate region between the drain and the source is covered with a thin oxide layer, and the metal (or polysilicon) gate is deposited on top of this gate dielectric. The midsection of the device can easily be recognized as the basic MOS structure. Fig: The physical structure of an n-channel enhancement-type MOSFET The two n+ regions will be the current-conducting terminals of this device. Note that the device structure is completely symmetrical with respect to the drain and source regions; the different roles of these two regions will bedefined only in conjunction with the applied terminal voltages and the direction of the current flow
q. A conducting channel will eventually be formed through applied gate voltage in the section of the device between the drain and the source diffusion regions. The distance between the drain and source diffusion regions is the channel length L, and the lateral extent of the channel (perpendicular to the length dimension) is the channel width W. q. A MOS transistor which has no conducting channel region at zero gate bias is called 'an enhancement-type (or enhancement-mode) MOSFET or E-MOSFET. If a conducting channel already exists at zero gate bias, on the other hand, the device is called a depletion-type (or depletion-mode) MOSFET. §MOSFET with p-type substrate is called an n-channel MOSFET. §MOSFET with n-type substrate is called p-channel MOSFET
MOSFET Symbols Fig. Circuit symbols for n-channel and p-channel enhancement-type MOSFETs. The abbreviations used for the device terminals are: G for the gate, D for the drain, S for the source, and B for the substrate (or body). § The gate-to-source voltage is denoted by VGS § The drain-to-source voltage is denoted by VDS § The substrate-to-source voltage is denoted by VBS
n-channel enhancement-type MOSFET shown in Fig. 3. 8. The simple operation principle of this device is: control the current conduction between the source and the drain, using the electric field generated by the gate voltage as a control variable.
The simplest bias condition of MOSFET is shown below. The source, the drain, and the substrate terminals are all connected to ground. A positive gate-to-source voltage VGS is then applied to the gate in order to create the conducting channel underneath the gate. For small gate voltage levels, the majority carriers (holes) are repelled back into the substrate, and the surface of the p-type substrate is depleted. Since the surface is devoid of any mobile carriers, current conduction between the source and the drain is not possible. Fig: Formation of a depletion region in an n-channel enhancement-type MOSFET.
when Gate-to-source voltage is further increased. As soon as the surface potential in the channel region reaches - F surface inversion will be established, and a conducting n-type layer will form between the source and the drain diffusion regions (Fig. 3. 11). This channel now provides an electrical connection between the two n+ regions, and it allows current flow, as long as there is a potential difference between the source and the drain terminal voltages (Fig. 3. 12). The bias conditions for the onset of surface inversion and for the creation of the conducting channel are therefore very significant for MOSFET operation. The value of the gate-to-source voltage VGS needed to cause surface inverters