Canadian Oil Gas Industry Analysis Recommendations Featuring Suncor


 ¢ Lowered for 2003 l Continued weak US growth Strengthening")
 l ¢ Increasing with economic growth OPEC")

 Production Trends 2001: Canada's primary energy production : ~39% natural gas ~25%")
 • Alberta")


 l Gaining access to resources")


 Reserves at Year End: 60. 1 trillion cubic feet")

")


 Parallel Dips ~ 1998 Opposite Moves ~")


 Natural Gas and Renewable")


")


: market value of assets net")


 First 9 Months Annual Data Prior to Merger")
 As of Sept 2003 Prior to Merger 2003")

 0.")
 7.")


 Method ¢ US$43. 00 Price Target ¢")


: market value of assets net of liabilities divided by")


- Slides: 129
Canadian Oil & Gas Industry Analysis & Recommendations Featuring : Suncor, Talisman & En. Cana
Presenters & Topics ¢ ¢ Linda Holmes: Industry Overview Eric Song: Suncor Energy Daniel Lee: En. Cana Tolek Strukoff: Talisman Energy
Industry Overview Agenda ¢ ¢ ¢ Industry Synopsis Economic summary Crude Oil Highlights Natural Gas Highlights SWOT Industry Forecasts
Industry Synopsis… ¢ ¢ Sub-sector of Energy Oil & Gas Industry encompasses l l l ¢ Products / Benefits l l ¢ Petroleum exploration (upstream) Refining (midstream) Distribution & Sale to consumers (downstream) Synthetics/ Pharmaceuticals/ Plastics Transportation / Heat / Employment Everyone uses energy l Demand virtually endless 2001: Canada's primary energy production : ~39% natural gas ~25% oil ~20% hydropower ~11% coal ~5% nuclear power
Industry Synopsis ¢ ¢ Oil & Gas is the largest industry in the world Tends to parallel boom & bust in economy l ¢ ¢ Demand: reasonably stable (except recession) Supply: can experience shocks l ¢ Recession: less products, less commuting…less energy use. OPEC meetings Net exporter of energy l 2001: 31% of energy production
Canada and the Upstream Oil & Gas Sector 3 rd largest producer of natural gas ¢ 9 th largest producer of crude oil ¢ 6% of Canada’s GDP ¢ Grown more than 250% since 1990 ¢ Overhead: 6 years of stats ¢
Economic Highlights… ¢ 2002: Canada’s real GDP grew ~3. 3% l l ¢ Compared to 1. 5% in 2001 Signals economic recovery Canadian economy influenced by US economy l l Largest trading partner ~85% Cdn exports to US (2002)
Economic Growth Forecast (Canada) ¢ Lowered for 2003 l Continued weak US growth Strengthening of Cdn dollar SARS outbreak l Canadian beef export ban (Mad Cow) l l ¢ Still growing but slower than last year’s forecasts
Situational Analysis ¢ Demand looks positive (CAPP) l ¢ Increasing with economic growth OPEC estimates demand will grow l l From ~75 MM bbl/d to more than 100 MM bbl/d by 2020 Investment needed to support this demand • >$100 Billion in exploration & development ¢ Overhead: l International Petroleum Supply & Demand • Base Case
Situational Analysis … ¢ ¢ OIL: world’s largest source of energy NATURAL GAS: role increasing l US gas supply < US gas demand • Analysts estimate this will continue well into 2025 l World Market: • Demand forecasted to double by 2030 (~4. 8 TCM/yr) • Reserves increasingly remote from major markets
Energy (Cdn) Production Trends 2001: Canada's primary energy production : ~39% natural gas ~25% oil ~20% hydropower ~11% coal ~5% nuclear power
Crude Oil Highlights ~ Canada ¢ Reserves: l 180 billion barrels (2003) • Alberta Oil sands (174. 8) • Conventional (5. 2) ¢ Production 2002 l ¢ Consumption 2002 l ¢ Average 2. 9 MM bbl/d Average 2. 0 MM bbl/d Exports l 1. 5 MM bbl/d crude to US
Crude Oil Highlights…cont’d ¢ Alberta Leading oil producing region l Conventional oil reserves are declining l Huge oil sands deposits l ¢ Trends l Projects shifting focus to eastern & northern provinces
OIL: Production & Consumption
Natural Gas Outlook Demand increasing ¢ Canada is the lead supplier to US ¢ Mackenzie Delta has potential for piping to south ¢ Resources are limited ¢ Shift in focus from WCSB to BC, Atlantic & Artic ¢ New Sources: ¢ l liquefied natural gas & coalbed methane
Natural Gas … ¢ Issues: Technology development (lower costs) l Gaining access to resources l Regulatory restrictions (timeliness) l ¢ New sources: Coalbed & methane gas l Coalbed: potential industry for Canada l
Natural Gas Exploration Projects ¢ Mackenzie Delta l ¢ Gauge potential reserves Challenges Temperature: down to – 33 degrees l Cost: $30 MM/well l • 60 times more than in AB l ¢ Politics: NWT & Federal gov’t Potential: l Increased capacity
Gas: Production & Consumption
Natural Gas in Canada (2001) Reserves at Year End: 60. 1 trillion cubic feet Production: 17. 4 billion cubic feet per day Prices: $4. 40 (US$/MM btu) Exports: 10. 6 billion cubic feet per day
Strengths Size of the market ¢ Size of the industry ¢ Alberta Oil Sands ¢ One of the largest sectors in Cdn economy ¢ Increasing economies of the less industrial provinces l Huge undeveloped energy, including major natural gas deposits in offshore areas l
Weaknesses ¢ Limited natural gas reserves (TCF)
Natural Gas Productive Capacity
Weaknesses Cont’d ¢ Higher costs for major supply basins than others
Opportunities Developing world ¢ US supply < US demand ¢ Exploration & pipeline projects in Yukon & NWT ¢ Oil sands (bitumen) ¢
Oil Production Forecast
Power of Suppliers within Industry ¢ Dominated by a few powerful companies l Large capital investment required • Discourages smaller investors Proximity to largest energy market ¢ Technological Developments ¢ l 3 -D seismic & steam –assisted gravity drainage
Threats ¢ Capital investment more internationally mobile l Goal: projects that offer • Best potential ROI • Least geological, ecological, & political risk High development costs ¢ High natural gas prices ¢ Growing environmental concerns ¢ l Kyoto requirements
Threat of New Entrants into Industry ¢ Barriers to Entry ~ HIGH l High fixed costs • Pumping trucks > $1 MM l Specialized Skills • To operate equipment & determine drilling decisions l Cash on hand • Need ample $$ to compete Scarcity of resources l Government restriction or legislation l
Regulatory Approval Timeline
Reserve Comparison
Availability of Substitutes ¢ Alternative Fuels: l ¢ Uses of Oil: l ¢ Coal, solar, wind, hydro, nuclear Plastics & other materials Specialized Services l Seismic drilling or directional drilling can better withstand
Competitive Rivalry ¢ Slow Industry growth rates l Since 1990 Cdn oil production has climbed 42% & natural gas 76% High costs for major supply basins ¢ Capital tends toward projects with higher ROI & lower risk ¢
Price History: 10 Year CRUDE OIL (sweet) Parallel Dips ~ 1998 Opposite Moves ~ 2000 -2002 NATURAL GAS
Price History: 5 Year Market Crash
Price History: Year-to-Date
Summary: Canadian Oil & Gas Stats… Canadian Oil & Gas Overview Source CAPP, April 2003 2001 2002 2003 F Crude Oil (mmbl/d) 2. 2 2. 4 2. 7 Natural Gas (tcf/yr) 6. 4 Crude Oil (mmbl/d) 1. 4 1. 7 Natural Gas (tcf/yr) 3. 7 3. 8 18, 300 15, 000 17, 000 Production Exports Wells Drilled (Canada)
Company Background ¢ ¢ ¢ Integrated energy company Strategically focused on developing one of the world’s largest petroleum resource basins – Canada’s Athabasca oil sands Ticker symbol: SU (both TSX and NYSE) Stock price: $28. 80 (TSX) Market capitalization: US$9. 95 Billion 3400 employees
Management Team ¢ ¢ ¢ Rick George, President and Chief Executive Officer – 23 years of experience at Suncor, 13 years as CEO Steve Williams, Executive Vice President, Oil Sands - over 20 years of international energy industry experience Ken Alley, Senior Vice President and Chief Financial Officer - 19 years of experience at Suncor Dave Byler, Executive Vice President, Natural Gas and Renewable Energy – 24 years of experience at Suncor Tom Ryley, Executive Vice President, Energy Marketing and Refining – 20 years of experience at Suncor Mike Ashar, Executive Vice President, Refining and Marketing U. S. A – 16 years of experience at Suncor, came from Petro-Canada
Main Business Units ¢ ¢ Oil Sands (core business segment) Natural Gas and Renewable Energy Marketing and Refining – Canada (under the brand name “Sunoco”) Energy Marketing and Refining – U. S. A. (acquired in 2003)
Strategic Priorities of Value Creation ¢ ¢ Reduce oil sands operating costs (by economies of scale with additional production) Increase production from existing oil sands assets Reduce the company’s net debt Continue to build the foundation for the next stages of its growth strategy
Locations of Operations
Pipeline Network – Oil Sands Production
Oil Sands ¢ ¢ ¢ Mines and upgrades crude oil Operations are located near Fort Mc. Murray, Alberta Oil sands production: 205, 800 barrels per day Vision: 550, 000 barrels per day in 2010 ~ 2012 Firebag In-situ Oil Sands Project: use horizontal wells to reach deep oil sands deposits, heat it and bring the bitumen to the surface for processing Advantages of in-situ technology: - recover large reserves that can’t be reached by traditional ways - suitable for staged growth - more environmental friendly - reduce costs of recovery
Oil Sands
Natural Gas and Renewable Energy ¢ ¢ Explores for and produces natural gas 3 locations in Western Canada Internally to power its Oil Sands facilities and Sarnia Refinery Externally to supply markets throughout North America
Natural Gas
Energy Marketing and Refining – Canada ¢ Refines crude oil and markets finished petroleum products Customers are located primarily in Ontario and Quebec Retail customers in Ontario under the Sunoco brand (over 500 retail sites) Sales agreements in Ontario ¢ Refinery in Sarnia, Ontario ¢ ¢ ¢
Energy Marketing and Refining – U. S. A. ¢ ¢ ¢ On July 31, 2003 Suncor acquired Conoco. Phillips’ Denver, Colorado refinery, retail stations and associated storage, pipeline and distribution facilities Flexibility to move crude and products to the Denver refinery or other customers Provides increased control of its oil products from production straight through to the consumer
Energy Marketing and Refining
Reserve Estimate
Income/Investment Structure
Five-Year Highlights
Balance Sheet
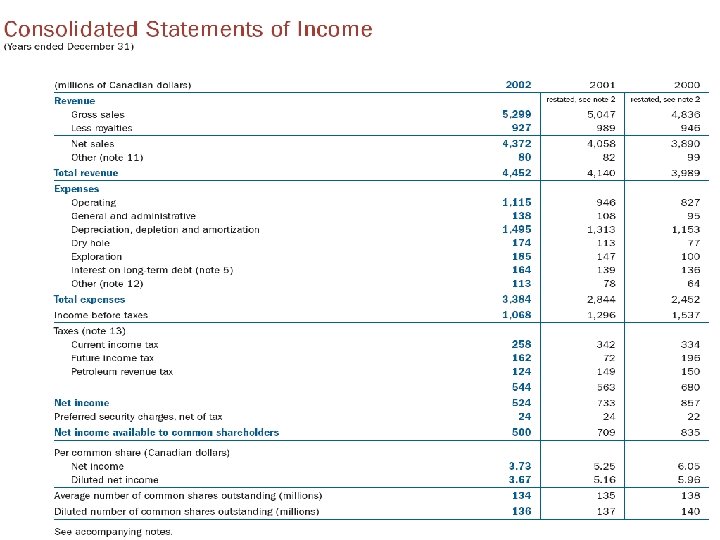
Income Statement
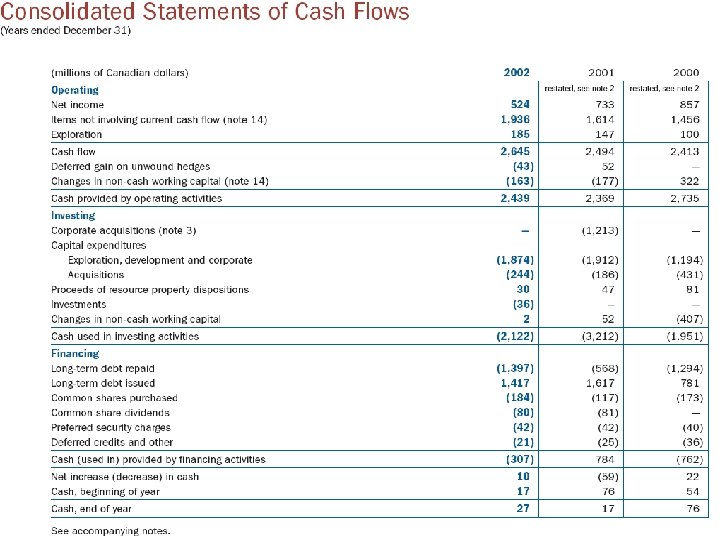
Cash Flow Statement
Stock Price Summary ¢ ¢ ¢ Stock price: $28. 80 Change: -$0. 10 (-0. 35%) Volume: 1, 118, 900 52 -week high: $29. 25 52 -week low: $22. 76
Stock Price Performance
Suncor vs. Oil Index (U. S. )
Suncor vs. S&P 500
Valuation - Benchmark Valuation Ratios Company Industry Sector S&P 500 P/E 13. 05 12. 42 15. 63 25. 40 Beta 0. 15 0. 42 0. 55 1. 00 Price to Book 3. 51 2. 49 4. 27 Dividend Yield 0. 67 3. 05 2. 75 2. 05 Div. – 5 yr growth 0. 00 3. 03 4. 11 6. 33 Sales – 5 yr growth 17. 89 4. 01 9. 34 9. 71 EPS – 5 yr growth 22. 78 -8. 15 -2. 16 10. 58
Valuation - Benchmark Financial Strength Company Industry Sector S&P 500 Quick Ratio 0. 62 0. 77 0. 95 1. 29 Debt to Equity 0. 57 0. 23 0. 51 0. 97 37. 40 19. 43 10. 53 13. 02 Gross Margin 69. 03 31. 07 34. 76 46. 96 Operating Margin 28. 43 9. 95 10. 95 18. 04 Net Profit Margin 16. 91 5. 94 5. 68 11. 85 ROI 12. 74 12. 79 8. 75 9. 57 ROA 11. 59 9. 94 7. 00 6. 10 ROE 32. 63 21. 19 16. 21 17. 85 6. 68 19. 48 17. 95 9. 96 Interest Coverage Profitability Management Inventory Turnover
Valuation - Trend
Valuation Model ¢ ¢ ¢ Net Asset Value (NAV): market value of assets net of liabilities divided by the shares outstanding $28. 50 price target based on a 22% premium to estimated NAV under base case price scenario (Gordon Gee, RBC Capital Markets) Current stock price: $28. 80 (TSX)
Growth Strategy ¢ ¢ Developing oil sands large resource base through mining and in-situ technology Expanding oil sands facilities to increase the production of crude oil Controlling costs through economies of scale and management of engineering, procurement and construction Developing new marketing and refining opportunities that further integrate upstream and downstream businesses
Growth Strategy - Illustration
Future Plans and Investments ¢ ¢ ¢ $496 million on oil sands growth projects: to support Firebag In-situ Oil Sands Project $145 million on projects related to Sarnia refinery and Sunoco’s Ontario retail network Five-year $100 million plan to develop renewable energy for the future
Fundamental Analysis – Moderate Buy ¢ ¢ ¢ - Strong sales and EPS growth High profitability compared to industry and S&P 500 Relatively high return ratios (ROE, ROA, ROI) Expansion strategy is supported by its in-situ technology Increasing presence in the U. S. markets by the acquisition Concerns: low inventory turnover low Beta (? ) higher P/E and price to book compared to industry rapid expansion strategy can be risky
Technical Analysis – Signals of Caution
Recommendation – HOLD!!!
En. Cana: Background Explores, produces, and markets natural gas, crude oil, and natural gas liquids ¢ Created by a merger in April 2002 ¢ Alberta Energy (AEC) l Pan. Canadian Energy (PCE) l ¢ Market Capitalization: US$21 Billion
En. Cana: Enterprise Value
En. Cana: Management Team ¢ ¢ ¢ Gwyn Morgan, President & CEO Randy Eresman, Executive Vice-President & COO John Watson, Executive Vice-President and CFO Roger Biemans, President, En. Cana Oil & Gas (USA) Inc. Gerry Macey, President, International New Ventures Exploration Bill Oliver, President, Midstream & Marketing
En. Cana: Four Pillars of Value Creation High-quality assets ¢ Solid credible reserves ¢ Strong financial management ¢ Sound corporate governance ¢
En. Cana: Business Segments ¢ Upstream Onshore North America l Offshore & International Operations l Offshore & New Ventures Exploration l ¢ Midstream & Marketing
En. Cana: Onshore North America ¢ ¢ Exploration, development and production in gas & oil on-land More than 17 million net acres of undeveloped land Compete through: large, concentrated land blocks; high working interests; low operating costs; low royalties and well-developed infrastructure Geographically operating in: l Plains of Alberta and Saskatchewan l Foothills of Western Alberta and Northeast B. C. l Canadian Oilsands region l Rocky Mountain states of the USA
En. Cana: Offshore & International Operations Develop reserves, and establish new production operations ¢ Enhance value through acquisitions and ongoing asset portfolio upgrades ¢ Four regional productions in: ¢ Latin America l East Coast of Canada l Gulf of Mexico l U. K. Central North Sea l
En. Cana: Offshore & New Ventures Exploration ¢ ¢ ¢ High-quality, focused offshore exploration program and turning new discoveries into operating facilities at the earliest possible date Drilling team must be able to handle unique requirements Includes exploration activity in: l l ¢ The Canadian East Coast: Deep Panuke The Gulf of Mexico: Tahiti, Sturgis The U. K. central North Sea: Buzzard, Farragon Africa, Australia, Latin America Currently seeking out new opportunities in: l Mackenzie Delta, Alaska, Brazil, North Africa, the Middle East, and off the west coast of Canada
En. Cana: Midstream & Marketing Enhances value of core upstream operations l Gas storage l Natural gas liquids extraction l Power generation l
En. Cana: Worldwide Exploration
En. Cana: Acquisitions ¢ Ecuador l l ¢ Cutbank Ridge l l ¢ Start-up of the OCP Pipeline (spans 500 km) Currently producing 96, 000 barrels of oil per day Acquired 500, 000 net acres of prospective natural gas development lands Estimated to ultimately recover more than 4 TCF U. K. l l Acquired an additional 14% in both the Scott and Telford fields Expected production of 20, 000 barrels of oil equivalent per day
En. Cana: Divestitures ¢ Syncrude l l ¢ Divested syncrude project interests for $1. 5 billion in cash considerations No gain or loss on sale Midstream – Pipelines l l l Sold interests in the Cold Lake Pipeline System and Express Pipeline System for total considerations of $1. 6 billion After-tax gain on sale of $263 million Part of En. Cana’s strategic realignment to focus on its large portfolio of higher return growth assets.
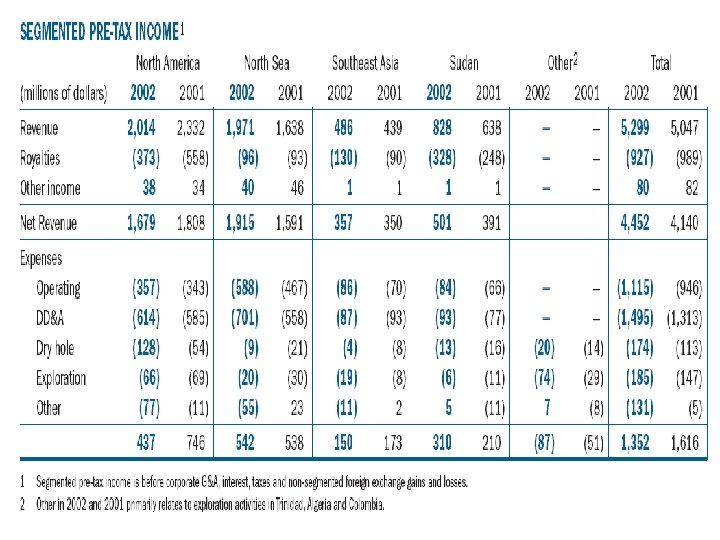
En. Cana: Segmented Income
En. Cana: Upstream Results
En. Cana: Income Statement (in CAD$millions) First 9 Months Annual Data Prior to Merger 2003 2002 2001 2000 $10, 378 $6, 388 $10, 011 $4, 894 $4, 366 Expenses $7, 447 $5, 287 $8, 148 $3, 009 $2, 733 Net Earnings $2, 418 $729 $1, 225 $1, 254 $1, 000 Basic EPS $5. 69 $1. 99 $2. 92 $5. 02 $4. 02 Diluted EPS $5. 60 $1. 96 $2. 87 $4. 90 $3. 95 Net Revenue
En. Cana: Balance Sheet (in CAD$millions) As of Sept 2003 Prior to Merger 2003 2002 2001 $2, 676 $4, 289 $1, 673 LT Assets $27, 536 $27, 033 $9, 127 Total Assets $30, 212 $31, 322 $10, 800 $2, 222 $3, 879 $1, 640 LT Liabilities $13, 037 $13, 649 $5, 181 S/H Equity $14, 953 $13, 794 $3, 979 Total Liabilities & S/H Equity $30, 212 $31, 322 $10, 800 Assets Current Assets Liabilities & S/H Equity Current Liabilities
En. Cana: Cash Flow Statement First Nine Months Annual Data Prior to Merger (in CAD$millions) 2003 2002 2001 2000 Operating Activities $4, 834 $1, 590 $2, 571 $2, 774 $2, 229 Investing Activities ($ 3, 279. 00) ($ 3, 349. 00) ($ 4, 062. 00) ($ 1, 697. 00) ($ 2, 321. 00) Financing Activities ($ 1, 381. 00) $ 1, 218. 00 $ 747. 00 ($ 330. 00) $ 158. 00 $ 152. 00 ($ 548. 00) ($ 751. 00) $ 766. 00 $ 65. 00 Cash Change
En. Cana: Benchmarks Financial Strength Company Industry Sector S&P 500 Quick Ratio (MRQ) 0. 73 0. 87 0. 95 1. 29 Debt to Equity (MRQ) 0. 48 0. 89 0. 51 0. 97 Interest Coverage (TTM) 9. 28 7. 36 10. 58 13. 05 Gross Margin (TTM) 66. 37 56. 78 37. 49 47. 12 Operating Margin (TTM) 26. 11 25. 91 14. 07 19. 1 Net Profit Margin (TTM) 20. 65 15. 07 8. 01 12. 68 10. 34 7. 52 8. 77 9. 62 Return On Assets (TTM) 9. 39 6. 42 7 6. 13 Return On Equity (TTM) 20. 14 16. 74 16. 29 17. 89 7. 17 18. 37 17. 83 9. 92 Profitability Ratios (%) Management Effectiveness (%) Return On Investment (TTM) Inventory Turnover (TTM)
En. Cana: Benchmarks Valuation Ratios Company Industry Sector S&P 500 P/E Ratio (TTM) 7. 98 14. 2 15. 36 24. 98 Beta -0. 28 0. 52 0. 55 1 Price to Book (MRQ) 1. 51 2. 43 4. 21 Dividend Yield 0. 86 2. 17 2. 81 2. 08 Price to Cash Flow (TTM) 3. 89 6. 48 8. 65 17. 37 EPS - 5 Yr. Growth Rate 15. 85 14. 14 -2. 18 10. 51 Sales - 5 Yr. Growth Rate 25. 17 18. 65 9. 47 9. 69
En. Cana: Stock Information Ticker Symbol: ECA ¢ Stock Price: US$35. 93 ¢ 52 Week High: US$39. 63 ¢ 52 Week Low: US$26. 75 ¢ # of Shares Outstanding: 465 Million ¢
En. Cana: Stock Performance
En. Cana: Stock vs. Oil & Gas
En. Cana: Stock vs. S&P 500
En. Cana: Growth Strategies Growing natural gas production, gas storage capacity, and crude oil production. ¢ Building oil growth platforms in the U. K. central North Sea and Gulf of Mexico ¢ Continue efforts to expand its medium and long-term growth prospects through new ventures exploration ¢
En. Cana: Valuation Net Asset Value (NAV) Method ¢ US$43. 00 Price Target ¢ 29% premium on estimated NAV under a base case price scenario l 1% discount to estimated NAV on NYMEX futures and a debt-adjusted 2003 E P/CF l ¢ Current Price US$35. 93 [11/20/2003]
En. Cana: Recommendations Current operations are desirable, as EPS and ROE is better than the industry ¢ Bought back some common shares ¢ Have sufficient cash flow to carry out its growth prospects ¢ Integrity in reserve estimates ¢ Recommendation: BUY! ¢
Company Background ¢ First 10 years: Grown from a small Canadian company with a market cap of about $500 million to an $11 billion international company with an extremely successful track record.
Company Background Exploration and production: Upstream hydrocarbon business ¢ Primarily focused on discovery and acquisition of new reserves ¢ Formally British Petroleum Canada (Talisman: 10 years old) ¢
Management Team • SIX out of the EIGHT executive positions are held by former BP employees • Recent executive succession has been internal
BOD Member Highlights ¢ ¢ Al L. Flood: Former CIBC BOD Member and Executive Committee Chair Dale G. Parker: Former President and CEO WCB B. C. Roland Priddle: Former Chairman of the National Energy Board of Canada Lawrence G. Tapp: Dean of the Richard Ivey School of Business of the University of Western Ontario
Operating Business Units: ¢ ¢ Domestic and international natural gas and liquids exploration and production operations Upstream hydrocarbon
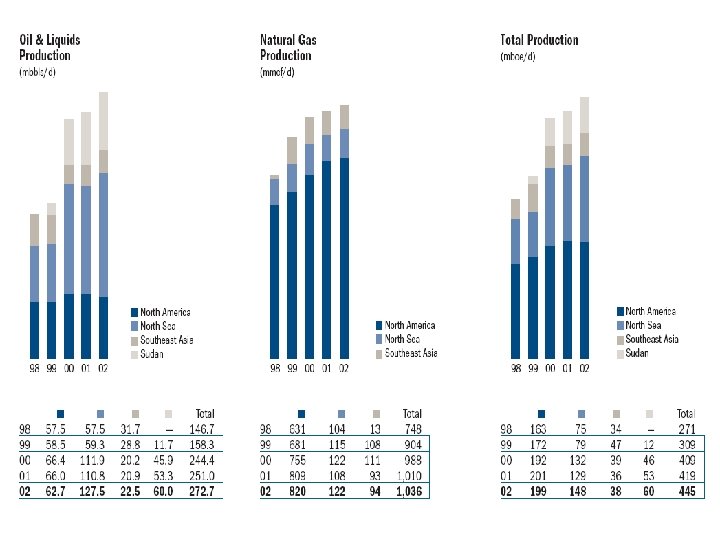
North America ¢ ¢ ¢ ¾ of production occurs in Canada, 60% of which comes from the north sea Large natural gas operations New properties in Canadian Foothills and New York State
New York Acquisition ¢ ¢ Late in 2002 and early 2003, Talisman’s whollyowned subsidiary, Fortuna Energy Inc. , acquired natural gas properties, production and facilities in upstate New York for US$309 million. Growing new core gas area with low operating costs, 138 bcf of proved gas reserves, production of 60 -70 mmcf/d and over 50 drilling locations.
North Sea: ¢ ¢ ¢ Commercial hub operations Low risk development, adjacent exploration opportunities, secondary recovery and 3 rd party tariff receipts Production was up 15% over 2001.
SE Asia: ¢ ¢ Poised for significant growth Developing large gas reserves and sales opportunities; Indonesia PM-3 commercial agreement: Malaysia/Vietnam Offshore block acquisitions: Vietnam
Latin America and Caribbean: ¢ ¢ New high impact development projects: Trinidad/Columbia First production 2005
Africa and Middle East: ¢ ¢ Non-operational interests: Algeria New exploration acreage in proven offshore basin: Qatar
Sudan Impact and Controversy: ¢ ¢ ¢ Shareholders grew tired of controversy stemming from the long standing conflict in the country Sold Sudan interest: US $758 million CEO expressed that Talisman felt these operations were financially beneficial to the company and to the people of Sudan
Gain on Sudan:
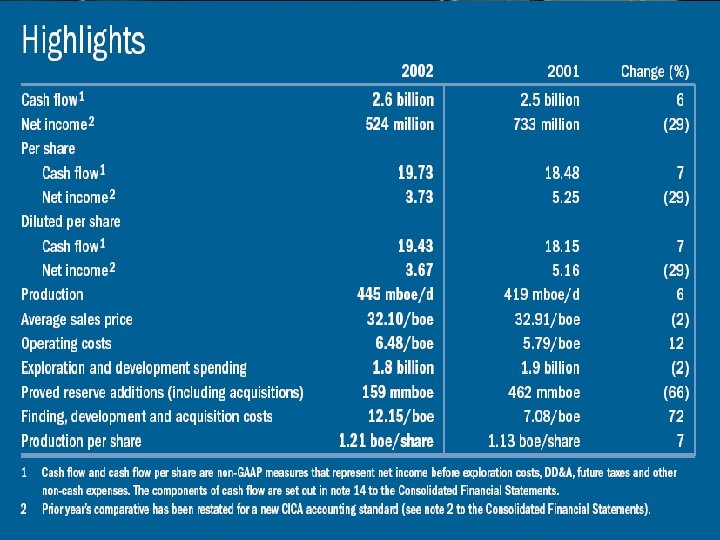
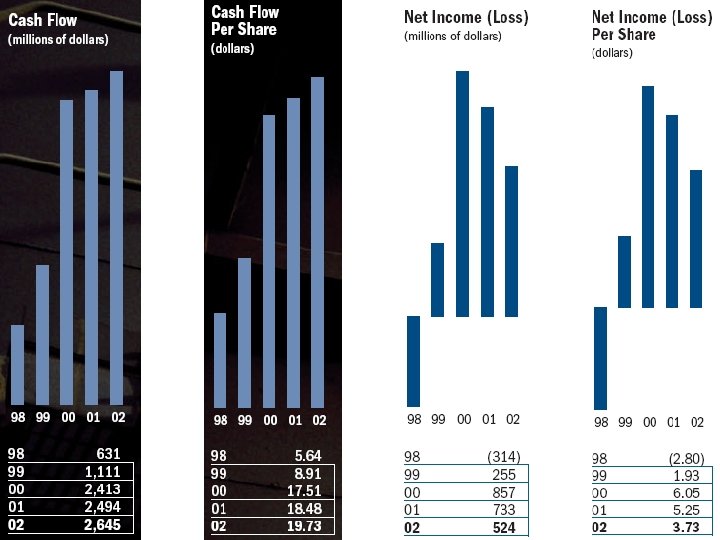
Growth Strategy: ¢ ¢ Continue to develop large North American gas business, while at the same time growing and adding to its international operations Growth via exploration and acquisition 10 year average: 13% production per share increase compounded annually 2002 Record: 6% increase in production to 445, 000 boe/d
Growth Strategy: ¢ ¢ ¢ Continue on past three years: replaced 184% of production at and average development cost of $7. 66/boe Target: 5 -10% growth in production per share Shareholder Value Creation: l l Repurchased 5. 8 million shares in 2002 Create value for SH with proceeds from Sudan sale
Share Capital • Ticker Symbol: TLM • Market Cap: $6. 35 Billion • Current Stock Price: $49. 59 • 52 -Week Range: $34. 12 - $51. 30
5 Year Trend:
Talisman vs. Oil & Gas
Talisman vs. S&P 500
Valuation: Valuation Ratios Company Industry Sector S&P 500 P/E 8. 14 14. 53 15. 63 25. 40 Beta 0. 33 0. 52 0. 55 1. 00 Price to Book 1. 88 2. 13 2. 49 4. 27 Dividend Yield 1. 16 2. 13 2. 75 2. 05 Sales – 5 yr growth 25. 50 18. 70 9. 34 9. 71 EPS – 5 yr growth 60. 26 14. 18 -2. 16 10. 58
Valuation: Financial Strength Company Industry Sector S&P 500 Quick Ratio 0. 79 0. 87 0. 95 1. 29 Debt to Equity 0. 47 0. 86 0. 46 0. 65 Interest Coverage 8. 81 7. 39 10. 53 13. 02 Gross Margin 75. 51 56. 90 37. 50 47. 15 Operating Margin 24. 34 25. 58 13. 97 18. 99 Net Profit Margin 23. 41 14. 94 8. 00 12. 67 ROA 9. 53 6. 47 7. 00 6. 10 ROE 24. 72 16. 51 16. 21 17. 85 9. 01 18. 43 17. 95 9. 96 Profitability Management Inventory Turnover
Valuation: Net Asset Value (NAV): market value of assets net of liabilities divided by the shares outstanding ¢ $74. 50 price target based on a 14% premium to estimated NAV under base case price scenario (Gordon Gee, RBC Capital Markets) ¢ Current stock price: $50. 18 (TSX) ¢
Recent Developments ¢ Banc of America Securities downgraded the energy company to "neutral" from "buy, " saying the ratings change is driven by a recent rise in the stock price and not a change in the operational outlook for the company.
Recommendation: Strong sales and EPS growth ¢ High profitability compared to industry and S&P 500 ¢ High return ratios (ROE, ROA, ROI) ¢ Strong recent track record in increasing production ¢ ¢ BUY