Assessment Of The Impact Of Catchments Providing Water


 Ranking (m) Probability Return")


")


 have shown the antecedent moisture condition based on five")
 could classify the soil type and soil texture")


 Volume(m³) 0 11 84. 49 1 7. 7 85. 01")


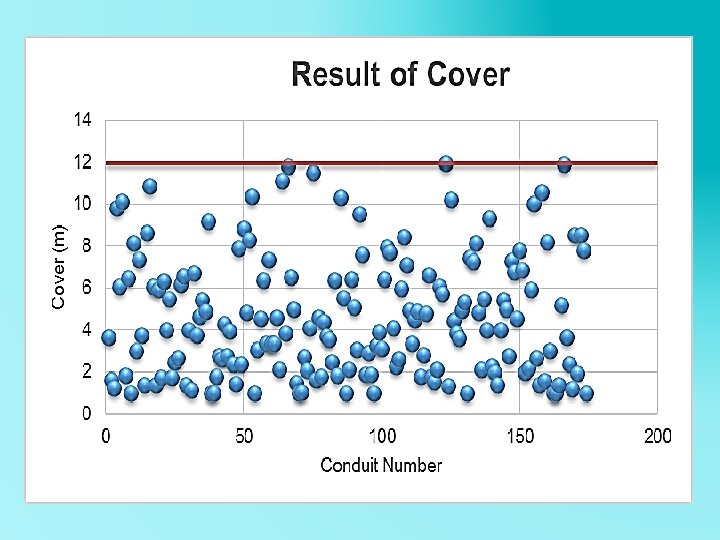
. Ø The cover:")
 18 No. of Conduits 55 Length (m) 2075. 9 24 96 4321.")

- Slides: 47
Assessment Of The Impact Of Catchments Providing Water To Marj Sanour & Design Of Water Collection System (Hydrologic Analysis) By: Isam Khasib Supervisor: Farouq Hamad Bashar Ibrahim Eng. Hamees Tubeileh
Outline: Ø Geography and Topography. Ø Challenges & Solutions. Ø Hydrology parameters calculations. Ø Flows & volumes results. Ø American & Tubas patterns. Ø Suggested Activities and projects. Ø Projects Evaluation. Ø Design of storm collection system.
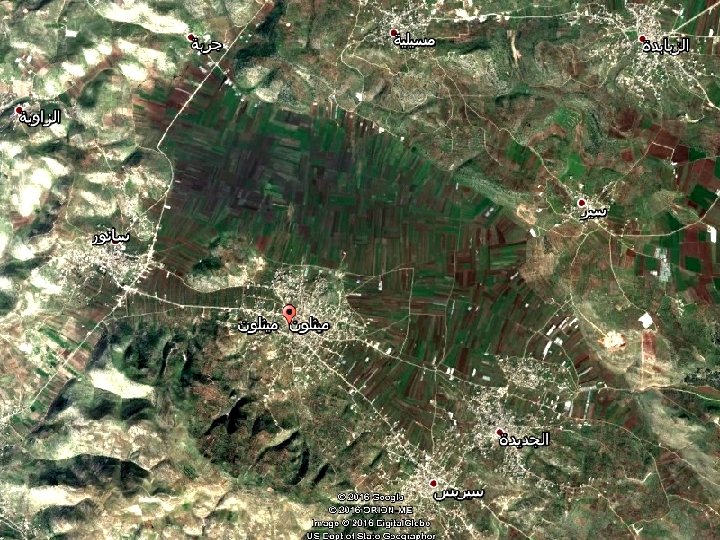
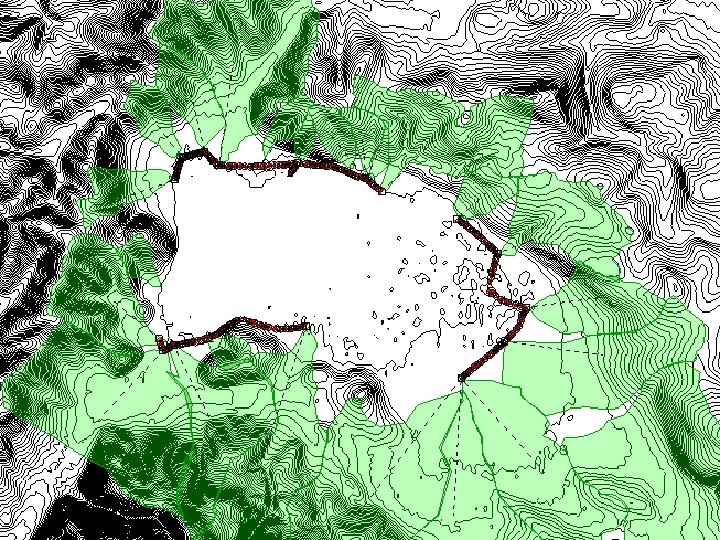
Study Area ØGeography and Topography
Geography and Topography Ø The Marj Sanour watershed forms a unique closed watershed area in the West Bank. The total area of the watershed is about 58. 58 km². Ø The Marj watershed area has an almost rectangular shape with northwest-southeast elongation. Ø The lake region is located between 350 and 375 contour lines above sea level.
Methodology: GIS model Allocation of catchments Soil type and texture Daily rainfall data Frequency analysis (rainfall V. S. return period) HEC-HMS model Curve number determination Hydrographs
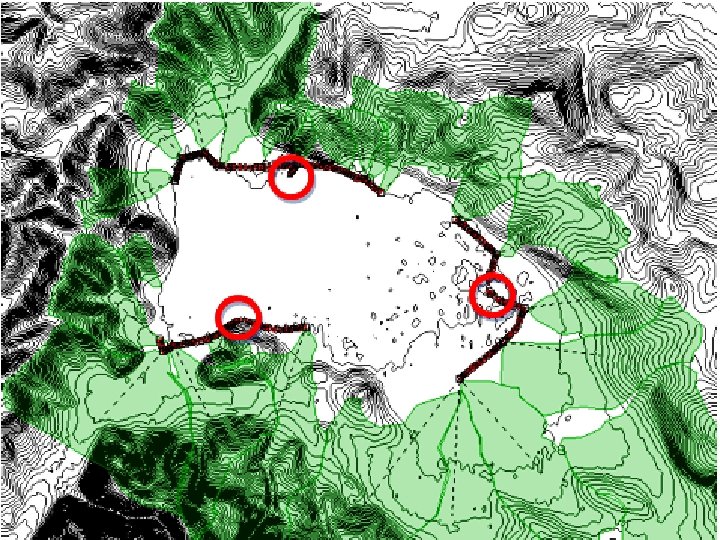
Methodology: allocation of catchments using GIS-Software �Allocation of catchments
Methodology: �Rainfall data collection: Rainfall data were collected from Arraba, Qabatia, Maythaloon & Raba stations from 2008 to 2016. �Correcting missing data using Normal Ratio method
Methodology: �Frequency analysis using corrected rainfall data for Maythaloon station. �We have chosen the highest daily rainfall in each year. Year 2008 Precipitation (mm) 66 2009 65 2010 83. 5 2011 60 2012 89. 5 2013 79 2014 70 2015 48 2016 58. 5
Methodology: �Probability of exceedance using Weibull distribution. Year Precipitation (mm) Ranking (m) Probability Return period 2008 66 6 0. 60 1. 67 2009 65 5 0. 50 2. 00 2010 83. 5 2 0. 20 5. 00 2011 60 7 0. 70 1. 43 2012 89. 5 1 0. 10 10. 00 2013 79 3 0. 30 3. 33 2014 70 4 0. 40 2. 50 2015 48 9 0. 90 1. 11 2016 58. 5 8 0. 80 1. 25
Methodology: 100 �Precipitation against return period 90 80 60 50 40 precepitation 70 30 20 10 25, 00 Return period 5, 00 0 1, 00
Methodology: �Catchments parameters: SCS-Curve number, slope, length of main streams & lag time. �Starting with CN, four hydrologic soil groups: I. III. IV. Group A Group B Group C Group D
Methodology: �In Marj Sanour we have three soil types and these are : 1) Brown Rendzinas and Pale Renzinas. 2) Grumusols. 3) Terra Rossas, Brown Rendzinas and Pale Rendzinas.
Methodology: � I. III. Soil moisture conditions are three types: Condition I: soils are dry Condition II: average (normal) conditions Condition III: saturated (wet) soils
Methodology: �CN II is considered the base CN.
Methodology: �Shadeed and Almasri (2010) have shown the antecedent moisture condition based on five days of rainfall precede the design storm
Methodology: �Also, Shadeed and Almasri (2010) could classify the soil type and soil texture into type A, B, C or D soil.
Methodology: �We can consider Marj Sanour soils as follows: ü Grumusols: Type D ü Terra Rossas, Brown Rendzinas And Pale Rendzinas: Type D ü Brown Rendzinas And Pale Renzinas: Type C
Methodology: �Land uses in the Marj are indicated as follows: ü Olive Groves ü Natural Grass Land ü Non Irrigated Arable Land ü Agricultural Land With Natural Vegetation ü Discontinuous Urban Fabric ü Military Camps
Methodology:
Methodology:
Methodology: catchment No. Length of main streams in Km S% Length in ft CN 2 CN 3 Lag time (min) 0 2. 71 20. 05 8891. 08 84. 00 92. 40 81. 62 1 2. 03 19. 5 6660. 10 84. 50 92. 60 65. 10 2 3. 7 13. 71 12139. 11 82. 20 91. 40 132. 34 3 0. 82 6. 16 2690. 29 78. 70 89. 50 64. 01 4 2. 33 4. 71 7644. 36 77. 50 88. 80 173. 56 5 2. 94 12. 72 9645. 67 80. 10 90. 30 119. 75 6 1. 45 10. 78 4757. 22 78. 50 89. 40 76. 65 7 1. 44 7. 03 4724. 41 81. 40 90. 90 88. 74 8 0. 73 11. 3 2395. 01 83. 30 92. 00 38. 76 9 1. 63 12. 8 5347. 77 84. 70 92. 70 67. 10 10 0. 58 14. 2 1902. 89 83. 70 92. 20 28. 51 11 0. 75 17. 22 2460. 63 84. 00 92. 30 31. 66 12 0. 55 9. 66 1804. 46 79. 10 89. 70 36. 84
Methodology: catchment No. Length of main streams in Km S% Length in ft CN 2 CN 3 Lag time (min) 12 0. 55 9. 66 1804. 46 79. 10 89. 70 36. 84 13 0. 49 24. 21 1607. 61 84. 30 92. 50 18. 82 14 0. 76 19. 35 2493. 44 80. 90 90. 70 32. 35 15 2. 09 18. 76 6856. 96 73. 10 86. 22 87. 86 16 1. 21 14. 69 3969. 82 69. 50 83. 97 69. 40 17 0. 96 16. 82 3149. 61 71. 90 85. 46 51. 17 18 1. 01 22. 07 3313. 65 84. 70 92. 74 34. 78 19 0. 55 18. 93 1804. 46 79. 20 89. 78 26. 23 20 0. 97 18. 15 3182. 41 78. 40 89. 31 42. 98 21 2. 61 3. 89 8562. 99 78. 70 89. 47 203. 64 22 2. 46 10. 7 8070. 87 80. 80 90. 66 111. 52 23 0. 4 18. 93 1312. 34 71. 10 84. 97 24. 36 24 1. 86 19. 16 6102. 36 83. 60 92. 15 62. 48
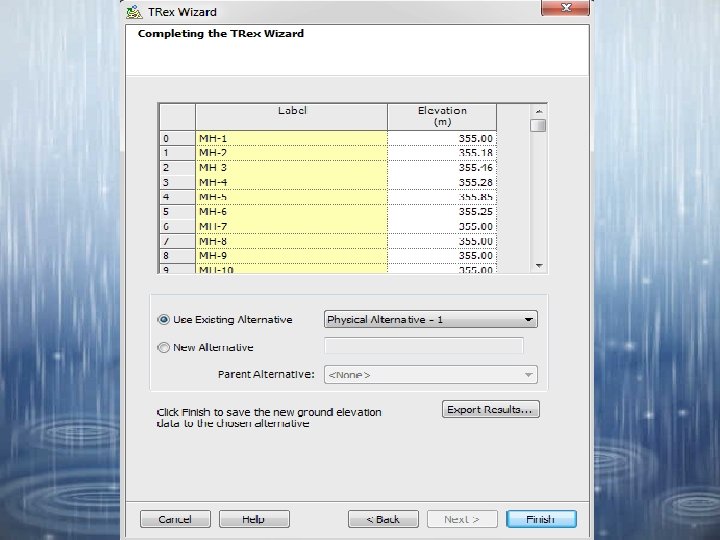
Methodology: �lag time in each catchment was calculated using SCS-lag equation because we will be using it in HEC-HMS software.
Results & calculations: �the HEC-HMS software to complete the hydrologic analysis and find the hydrographs.
catchment # Peak flow(m³/s) Volume(m³) 0 11 84. 49 1 7. 7 85. 01 2 11. 2 81. 89 3 2 77. 08 4 4. 3 75. 35 5 14. 2 79. 08 6 3. 5 76. 83 7 4. 7 80. 6 8 2. 1 83. 44 9 8. 1 85. 28 10 1. 7 83. 96 11 1. 9 84. 22 12 0. 5 77. 58 13 0. 9 84. 75 14 1. 4 80. 09 15 8 69. 19 16 2. 7 88. 67
Peak Flow in each catchment 18 15, 4 16 14, 2 14 Peak flow (m³/s) 12 11, 5 11, 2 11 10 8, 1 7, 7 8 8, 1 8 6 4, 7 4, 3 4, 5 3, 5 4 2, 1 2 2 2, 7 1, 9 0, 5 0, 9 2, 5 1, 4 1, 1 0, 9 0 1 2 3 4 5 6 7 8 9 10 11 12 13 14 15 16 17 18 19 20 21 22 23 24 25
Volume in each catchment 100 90 88, 67 84, 49 85, 01 81, 89 79, 08 77, 08 76, 83 75, 35 80 80, 6 85, 28 83, 96 84, 22 83, 44 85, 38 84, 75 80, 09 77, 58 79, 99 76, 6176, 98 69, 19 70 67, 43 66, 31 60 Volume (m³) 83, 83 55, 06 50 40 30 20 10 0 1 2 3 4 5 6 7 8 9 10 11 12 13 14 15 16 17 18 19 20 21 22 23 24 25
0, 20 0, 19 0, 18 0, 16 0, 15 0, 14 hourly factor 0, 12 0, 097 0, 10 0, 08 0, 06 0, 08 0, 07 0, 06 0, 05 0, 04 0, 03 0, 04 0, 02 1 2 3 4 5 6 7 8 0, 02 0, 01 0, 003 0, 01 0, 000, 00 0, 03 9 10 11 12 13 14 15 16 17 18 19 20 21 22 23 24 Time (hour)
Tubas pattern 15, 4 American Pattern 14, 2 11, 5 11, 2 10, 8 11 9, 5 8, 6 8, 1 8, 6 7, 7 8, 1 8 7, 4 6 5, 1 4, 5 3, 9 4 2, 5 1, 1 0, 5 4, 7 1, 4 0, 9 0, 5 2, 7 1, 9 1, 7 1, 5 1, 4 0, 9 1 0, 700000001 0, 9 0, 8 0, 5 0, 4 0, 3 1, 7 24 23 22 21 20 19 18 17 16 15 14 13 12 11 10 9 2, 1 4, 3 3, 6 3, 33, 5 2, 4 2 1, 3 1, 1 8 7 6 4, 8 5 4 3 2 1 0
Catchment number Vs Volume CN 1 64, 12 65, 24 CN 3 65, 69 63, 45 64, 12 60, 17 52, 86 Volume (m³) CN 2 55, 72 50, 46 63, 23 58, 45 57, 18 53, 67 52, 46 52, 84 42, 16 36, 62 32, 92 35, 53 27, 24 23, 65 8, 8 0 1 2 3 4 5 6 7 8 11, 69 22, 08 10, 68 9 10 11 12 13 14 15 16 17 18 19 20 21 22 23 24 Catchment number
Design of Collection System �Suggested Activities and projects: Ø Land Management Projects. Ø Rainwater harvesting projects. Ø Water Transfer Projects. Ø Groundwater Recharge Projects.
Projects Evaluation Environment Economy Social Overall Type of Projects Score Rank Land Management Projects 30. 40% 1 60. 80% 1 90. 60% 2 53. 80% 1 Rainwater Harvesting Projects 21. 10% 2 59. 90% 2 91. 00% 1 48. 90% 2 Water Transfer projects 15. 20% 4 46. 00% 3 79. 00% 3 41. 00% 3 Artificial Recharge Projects 17. 50% 3 13. 70% 4 45. 10% 4 24. 30% 4
Land Management Projects 90, 6% 91, 0% Rainwater Harvesting Projects 79, 0% Water Transfer projects Artificial Recharge Projects 60, 8% 59, 9% 53, 8% 48, 9% 46, 0% 45, 1% 41, 0% 30, 4% 24, 3% 21, 1% 17, 5% 15, 2% Environment 13, 7% Economy Social Overall
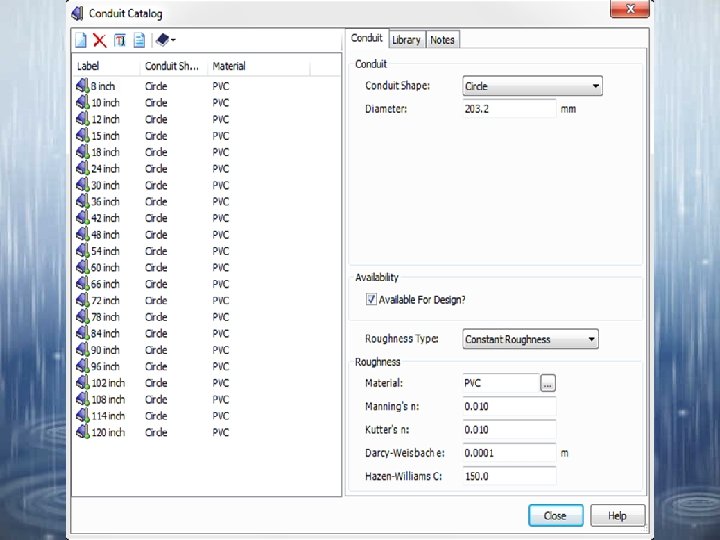
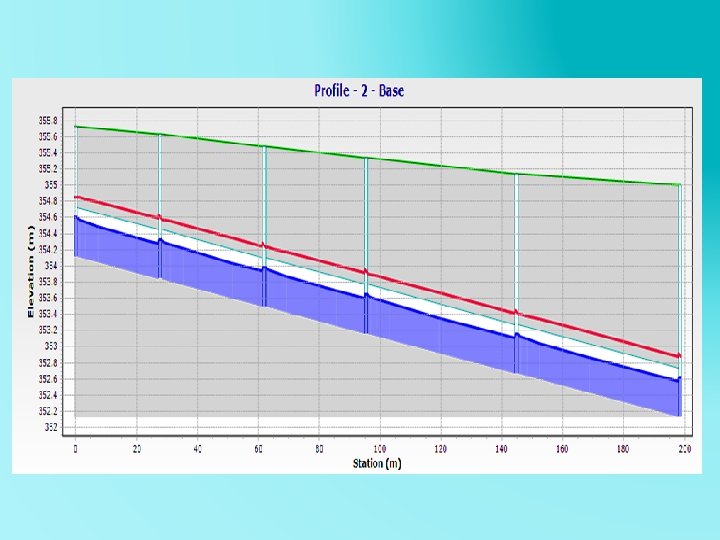
Design of storm collection system
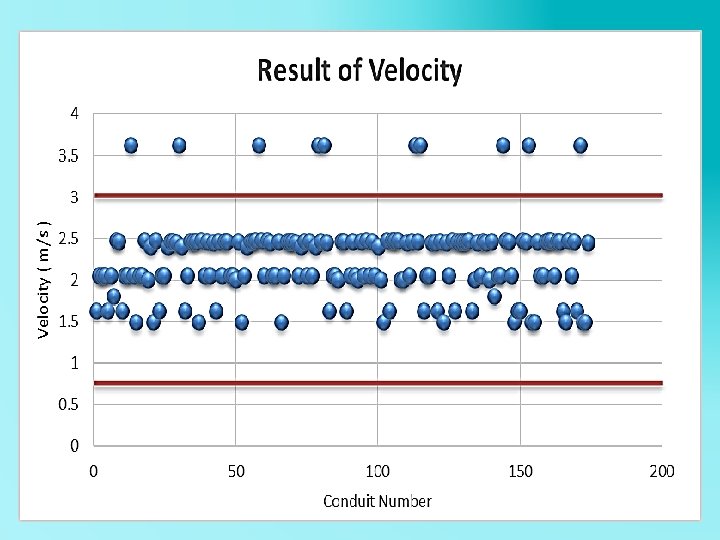
Design Criteria Ø The velocity : (0. 6 – 3 m/sec). Ø The cover: Is the difference elevation between the ground elevation and the invert of conduit elevation (1 -5 m). Ø The slope: is the slope of bed conduit. (1 -10%). Ø The distance between manholes are (30 -50 m): This range for economic criteria.
Diameter (inch) 18 No. of Conduits 55 Length (m) 2075. 9 24 96 4321. 3 42 23 853. 5
g n i n e t s i l r o f s k n a Th