Ground water resources Waikato and Waipa catchments Presentation


- Slides: 26


Ground water resources: Waikato and Waipa catchments Presentation to CSG meeting - 2 July 2015

Ground water investigations: Waikato and Waipa catchments 1. Short term field investigations of ground water 2. Ground water resource characterisation 3. Estimation of lag time of water and nitrate flow through the unsaturated zone 4. Predicting denitrification status of ground water 5. Steady-state catchment model 6. Historic land use

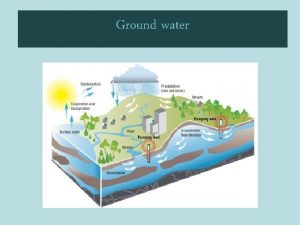
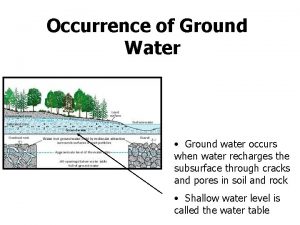
Ground water schematic

Geology: upper Waikato UW 3 D geological model from the oldest to the youngest model unit View from south to north

Geology: Waipa UW 3 D geological model from the oldest to the youngest model unit View from south to north

Geology: middle and lower Waikato UW 3 D geological model from the oldest to the youngest model unit View from south to north

Ground water surface: upper Waikato 10 x elevation exaggeration Note additional piezometric contours from: WVA (1987) – grey Bromley et al. (2000) – red Fixed head cells of Lake Rotokawa and the Waikato River – light blue Fixed-head cells of streams – dark blue View from south to north

Ground water surface: Waipa 10 x elevation exaggeration Note: Fixed head cells of lakes and the Waikato River – light blue Fixed head cells of streams –dark blue View from south to north

Ground water surface: middle, lower Waikato 10 x elevation exaggeration Note additional piezometric contours from: WRC (1991) – purple WVA (1986) – grey Marshall & Petch (1985) – red Fixed head cells of lakes and Waikato River – light blue Fixed head cells of streams – dark blue View from south to north

Ground water hydrology: Waikato and Waipa catchments • Upper Waikato • Highly permeable soils • Base flow index - 94 per cent • Waipa • Slow to moderately permeable soils • Steeper slopes and higher drainage density • Base flow index - 60 per cent • Middle and lower Waikato • Moderately permeable soils • High water tables • Base flow index – 80 per cent

Ground water chemistry Location of bores with ground water chemistry

Chemistry: Upper Waikato • Of 21 catchments - per cent with bores with median: • N-N >MAV - 28 per cent • N-N >½ MAV and MAV - 33 per cent • N-N increasing >0. 1 mg/l per decade - 0 per cent • E. coli increasing – 10 per cent • E. coli > MAV – 5 per cent

Chemistry: Waipa • Of 31 catchments - per cent with bores with median: • N-N >MAV - 6 per cent • N-N >½ MAV and MAV - 10 per cent • N-N increasing >0. 1 mg/l per decade - 6 per cent • E. coli increasing – 0 per cent • E. coli > MAV – 10 per cent

Chemistry: middle and lower Waikato • Of 29 catchments - per cent with bores with median: • N-N >MAV - 34 per cent • N-N >½ MAV and MAV - 14 per cent • N-N increasing >0. 1 mg/l per decade - 17 per cent • E. coli increasing – 20 per cent • E. coli > MAV – 38 per cent

Ground water lags: unsaturated flow • Total travel times – < 10 years for low lying areas and low hills in lower and middle Waikato and Waipa and Reporoa area – 10 – 30 years for rolling land above 100 m amsl – longest travel times (50 – 100+ years) under ranges and elevated terrain • Mixing in the upper aquifer zone – 2. 5 – 6 years (mean 17 per cent of total travel time)

Water age: Waikato and Waipa • Surface water • Stream water <15 years (ave 10) in lower, middle Waikato and Waipa • Stream water older (ave 52 years) in upper Waikato • Waikato River younger (12 years) because of inflow from Taupo • Ground water • • • Ground water age much older than surface water No clear relationship with depth Age highly variable –hydraulic properties, flow paths, fracturing Very shallow lowland ground water 1 -2 years Upper Waikato springs 11 to 60 years Deeper ground water 150 to 250+ years

Denitrification: Waikato and Waipa • Redox conditions: 554 bores – 56 per cent oxic conditions – 22 per cent reducing conditions – 22 per cent mixed conditions – Reducing conditions increase with depth • Field studies – Reducing conditions highly variable - spatially and with depth and – antecedent water levels

Summary • Hydrogeological systems • Ground water levels • Ground water nitrogen • Travel times (unsaturated zone) • Water ages • Nitrogen attenuation • Catchment model • Historic land use study

Policy implications • Ground water quality • Impacted by land generated N-N especially in shallow aquifers • Lag time and water age • • Stream water quality not in equilibrium with land use Upper Waikato stream water not yet impacted by conversions Other areas showing slow increase in ground water N-N Deep ground water not yet affected but this can take centuries • Denitrification • Exists but spatially variable: consistent patterns hard to establish at a property scale


Upper Waikato

Waipa

Middle and lower Waikato

Scenarios • 600 km 2 of pine to pasture (74% dairy) • dairying intensifies at 1. 5% p. a. • no conversion • no intensification • changes to farm practice

Changes in nitrogen loads following land use changes to 2030 Conversions, dairy intensification Change (%) 70 No conversions, dairy intensification 33 Conversions, capped current, 36/13 26 Conversions, capped 26/12 0
 Water and water and water water
 Waikato stormwater management guideline
 Slidetodoc
 Landfowl
 Waikato dhb ransomware
 The transformation process
 Fixed resources definition
 Ground water management and regulation scheme
 Renewable vs nonrenewable resources worksheet
 Groundwater pollution
 421521
 Ground water
 Water that doesn't soak into the ground
 Uses of ground water
 Chapter 4 landforms water and natural resources
 Air and water resources lesson 4
 Volusia county water and utilities
 Volusia county water resources and utilities
 Sinciput presentation
 4 maneuvers of leopold
 Water resources unit
 Water management
 Norway water resources
 Sabah water resources enactment 1998
 Importance of water resources
 Chapter 14 water resources answer key
 Chapter 11 section 1 water resources answer key
