
FLOOD REGIMES OF MIDSIZED AND MIXED LANDUSE CATCHMENTS


- Slides: 39
FLOOD REGIMES OF MID-SIZED AND MIXED LAND-USE CATCHMENTS: CAN WE ASSESS THE URBAN CONTRIBUTION ? B. Radojevic (1), P. Breil (2), B. Chocat (3) (1) UNESCO b. radojevic@unesco. org (2) CEMAGREF Lyon pascal. breil@lyon. cemagref. fr (3) URGC – INSA Lyon chocat@urgc-hu. insa-lyon. fr International Symposium on Flood Defense, Toronto, Canada, May 6 -8, 2008
Urban sprawling: a world wide trend (UNEP, 2003 ) Urban growth of Lyon city (with courtesy from Lyon city council, 2005)
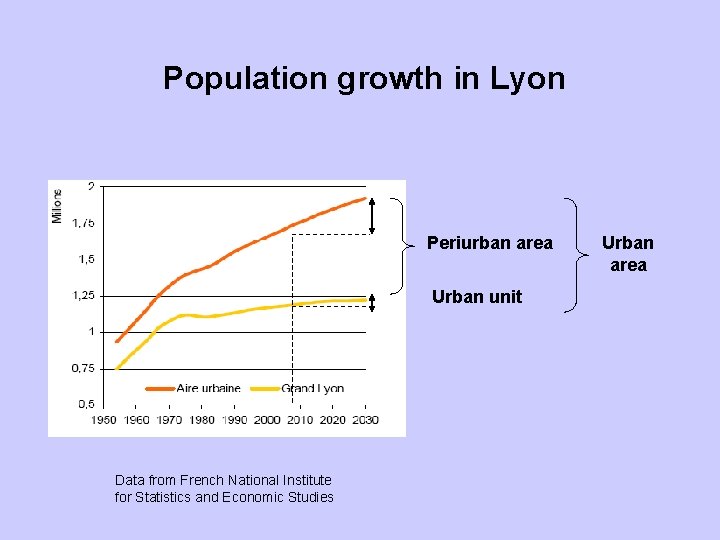
Population growth in Lyon Periurban area Urban unit Data from French National Institute for Statistics and Economic Studies Urban area
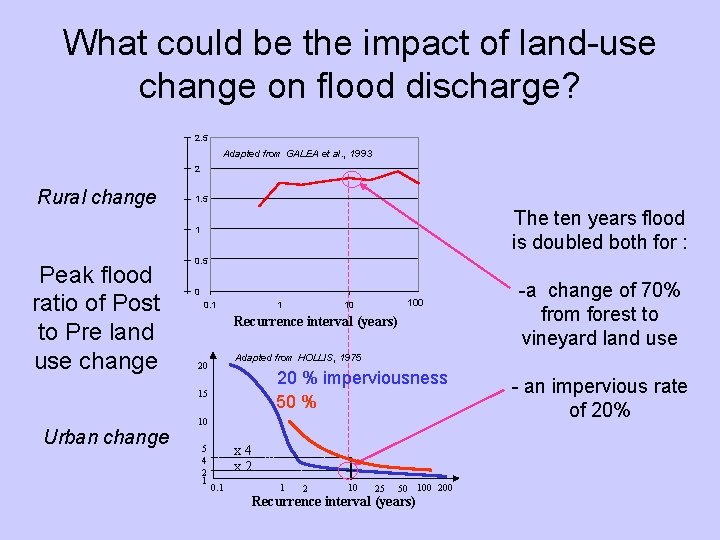
What could be the impact of land-use change on flood discharge? 2. 5 Adapted from GALEA et al. , 1993 2 Rural change 1. 5 The ten years flood is doubled both for : 1 Peak flood ratio of Post to Pre land use change 0. 5 0 0. 1 1 Recurrence interval (years) 20 % imperviousness 50 % 10 5 4 2 1 -a change of 70% from forest to vineyard land use Adapted from HOLLIS, 1975 20 15 Urban change 100 10 x 4 x 2 0. 1 1 2 10 25 50 100 200 Recurrence interval (years) - an impervious rate of 20%
Flood event in Yzeron basin
Outline of the presentation Ø Ø Ø Objective of the study Study area Method Results Conclusion
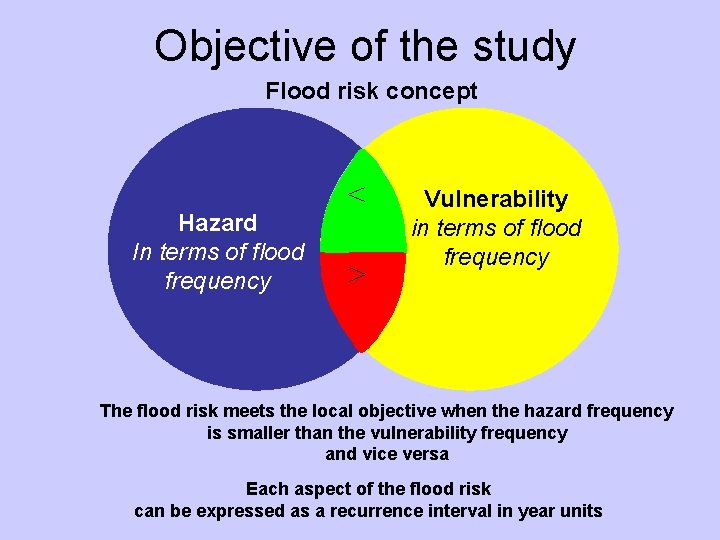
Objective of the study Flood risk concept Hazard In terms of flood frequency < > Vulnerability in terms of flood frequency The flood risk meets the local objective when the hazard frequency is smaller than the vulnerability frequency and vice versa Each aspect of the flood risk can be expressed as a recurrence interval in year units
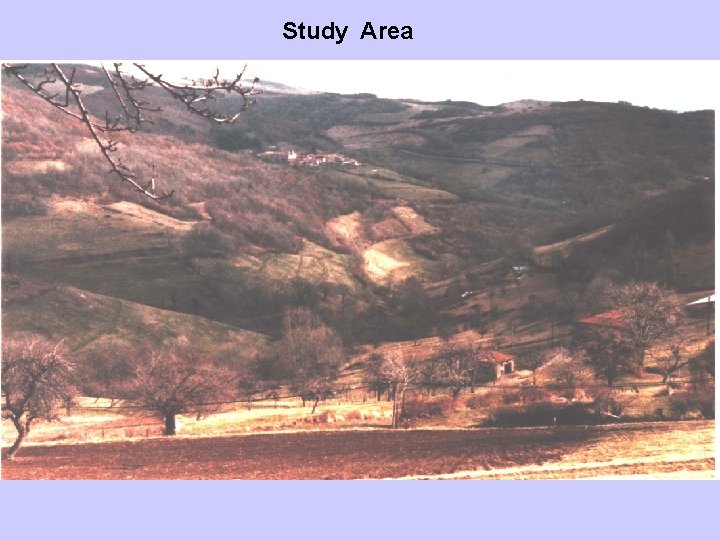
Study Area
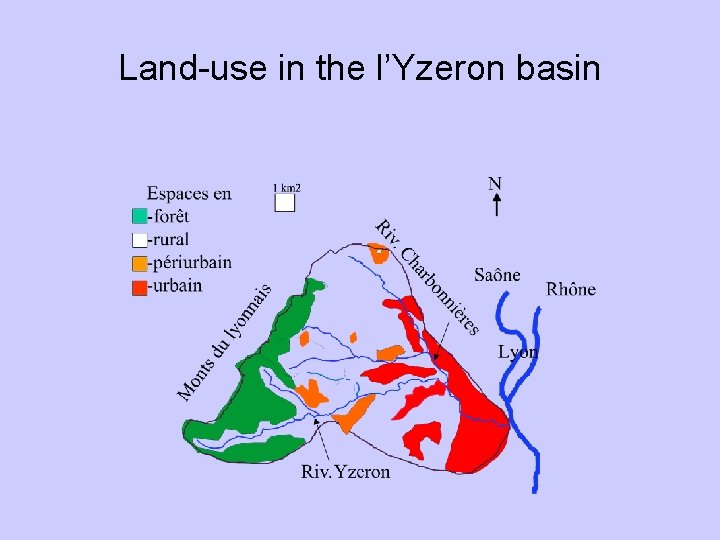
Land-use in the l’Yzeron basin
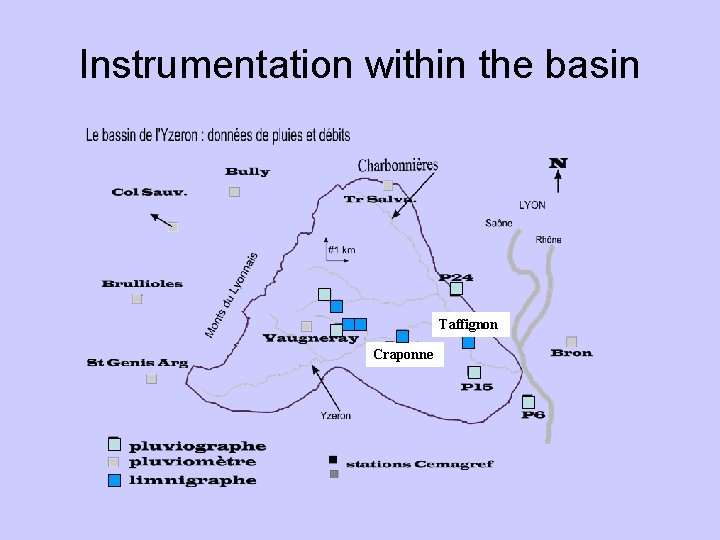
Instrumentation within the basin Taffignon Craponne
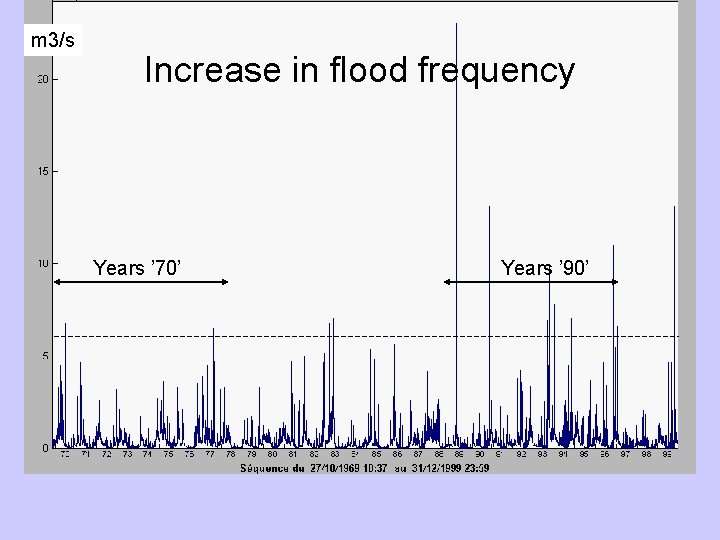
m 3/s Increase in flood frequency Years ’ 70’ Years ’ 90’
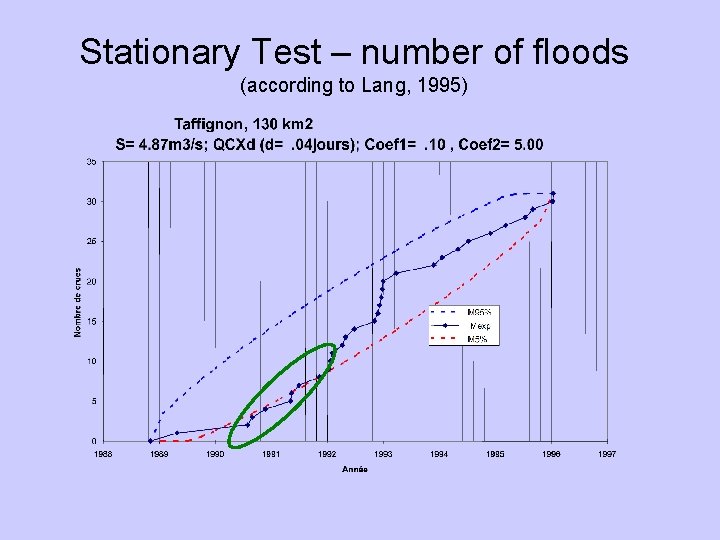
Stationary Test – number of floods (according to Lang, 1995)
Stationary test on number of floods - rural part (according to Lang, 1995)
Stationarity of the number of max. daily rainfall at Bron station
Daily max. rainfall regime for the rain gauge Bron Daily intensity: ØThe most intense in the ’ 90’ ØThe lowest in the ’ 70’
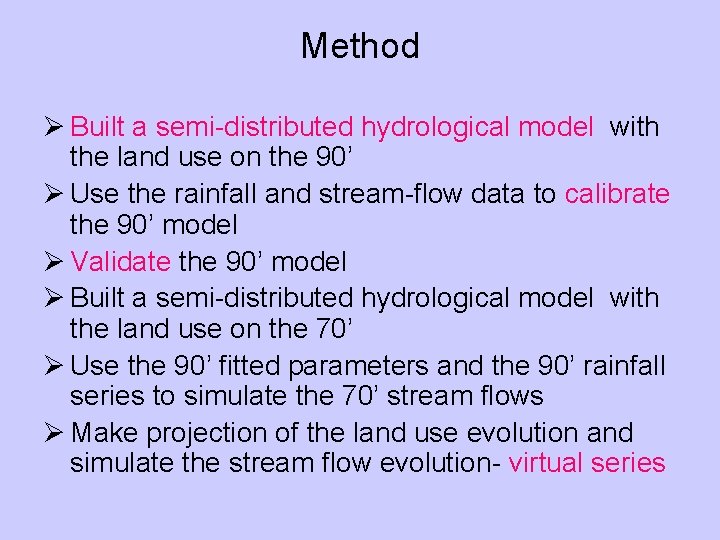
Method Ø Built a semi-distributed hydrological model with the land use on the 90’ Ø Use the rainfall and stream-flow data to calibrate the 90’ model Ø Validate the 90’ model Ø Built a semi-distributed hydrological model with the land use on the 70’ Ø Use the 90’ fitted parameters and the 90’ rainfall series to simulate the 70’ stream flows Ø Make projection of the land use evolution and simulate the stream flow evolution- virtual series
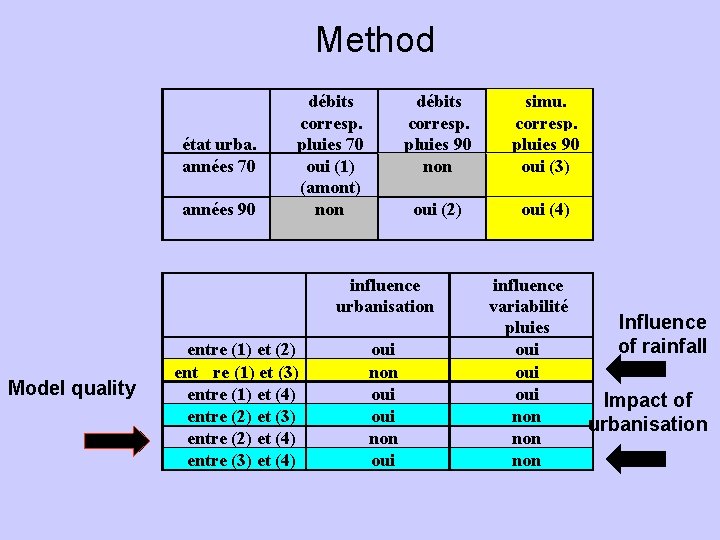
Method état urba. années 70 années 90 débits corresp. pluies 70 oui (1) (amont) non débits corresp. pluies 90 non simu. corresp. pluies 90 oui (3) oui (2) oui (4) influence urbanisation Model quality entre (1) et (2) ent re (1) et (3) entre (1) et (4) entre (2) et (3) entre (2) et (4) entre (3) et (4) oui non oui influence variabilité pluies oui oui non non Influence of rainfall Impact of urbanisation
Model development Ø Dividing the l’Yzeron basin in hydrological units Ø Calibration of the rainfall – runoff model CANOE Ø Validation of CANOE
Land-use change in the l’Yzeron basin
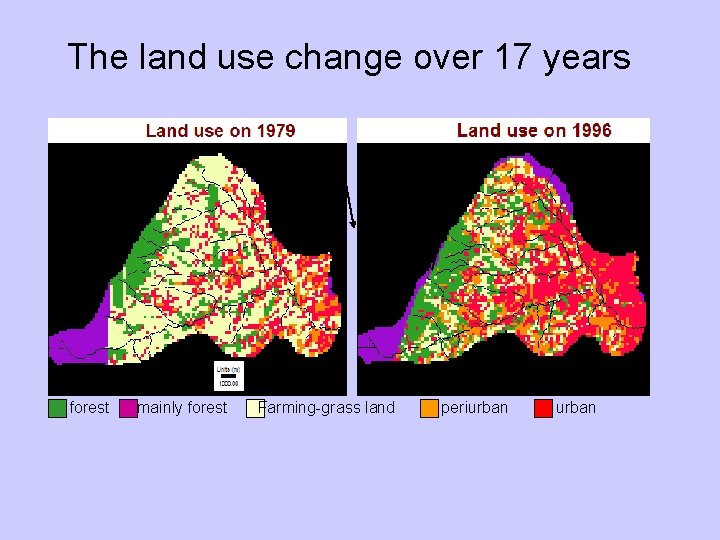
The land use change over 17 years forest mainly forest Farming-grass land periurban
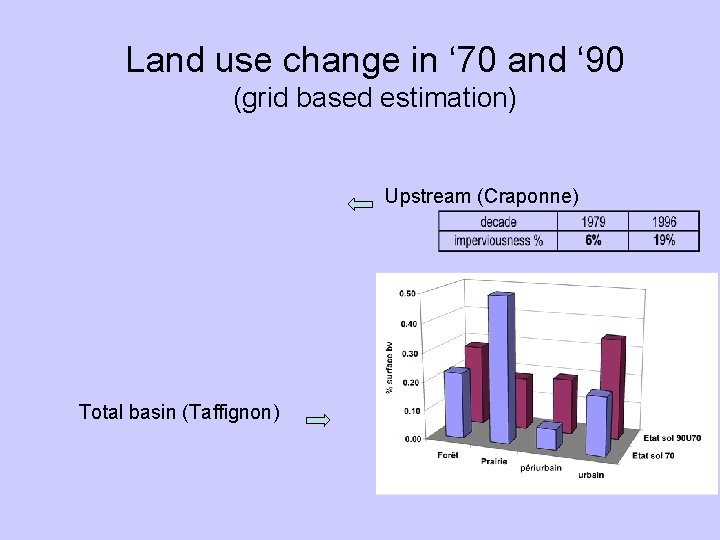
Land use change in ‘ 70 and ‘ 90 (grid based estimation) Upstream (Craponne) Total basin (Taffignon)
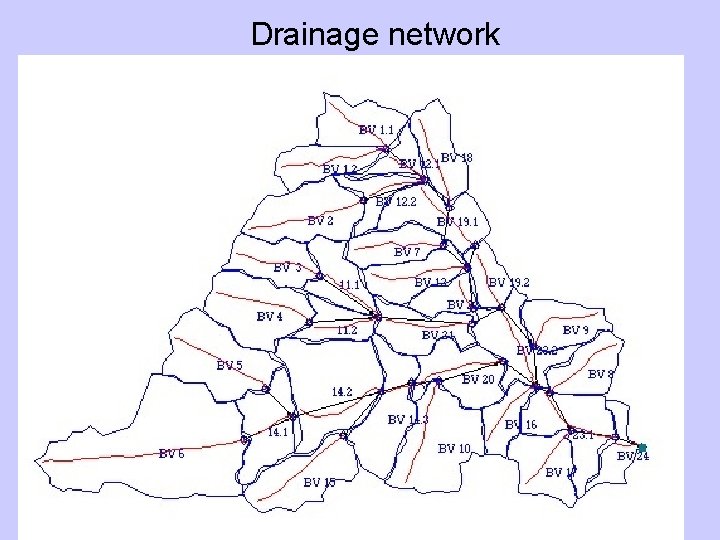
Drainage network
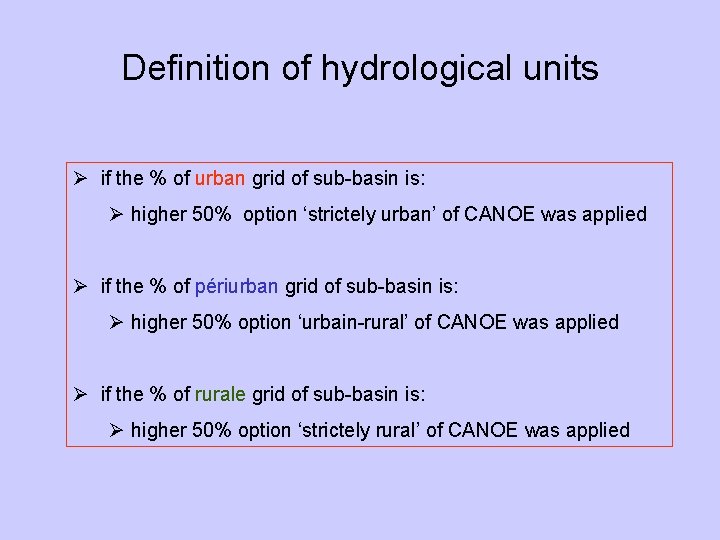
Definition of hydrological units Ø if the % of urban grid of sub-basin is: Ø higher 50% option ‘strictely urban’ of CANOE was applied Ø if the % of périurban grid of sub-basin is: Ø higher 50% option ‘urbain-rural’ of CANOE was applied Ø if the % of rurale grid of sub-basin is: Ø higher 50% option ‘strictely rural’ of CANOE was applied
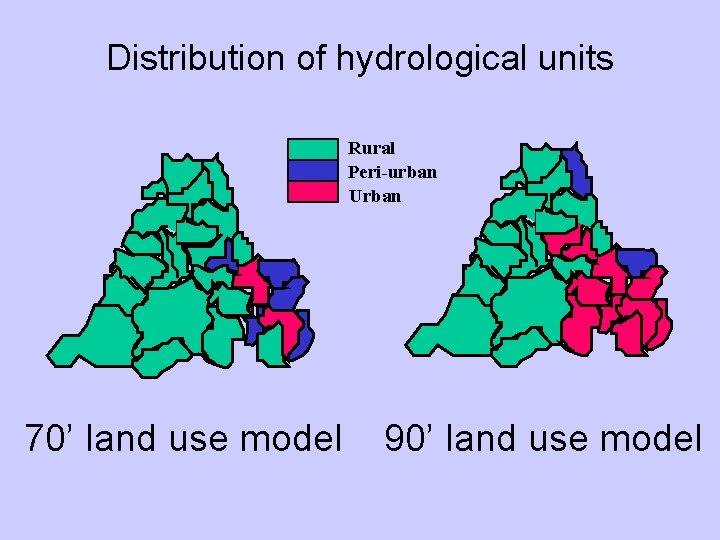
Distribution of hydrological units Rural Peri-urban Urban 70’ land use model 90’ land use model
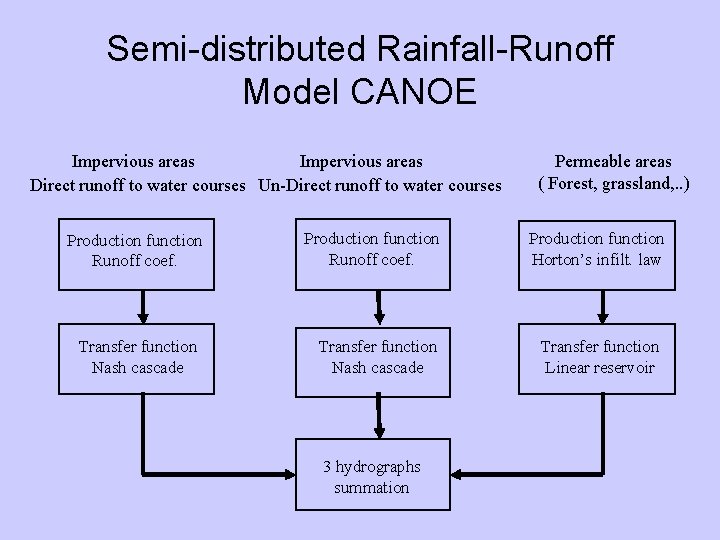
Semi-distributed Rainfall-Runoff Model CANOE Impervious areas Direct runoff to water courses Un-Direct runoff to water courses Production function Runoff coef. Transfer function Nash cascade 3 hydrographs summation Permeable areas ( Forest, grassland, . . ) Production function Horton’s infilt. law Transfer function Linear reservoir
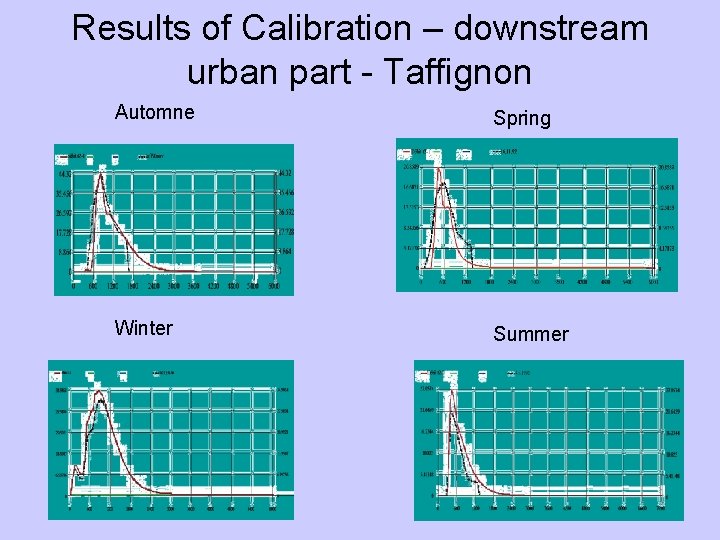
Results of Calibration – downstream urban part - Taffignon Automne Spring Winter Summer
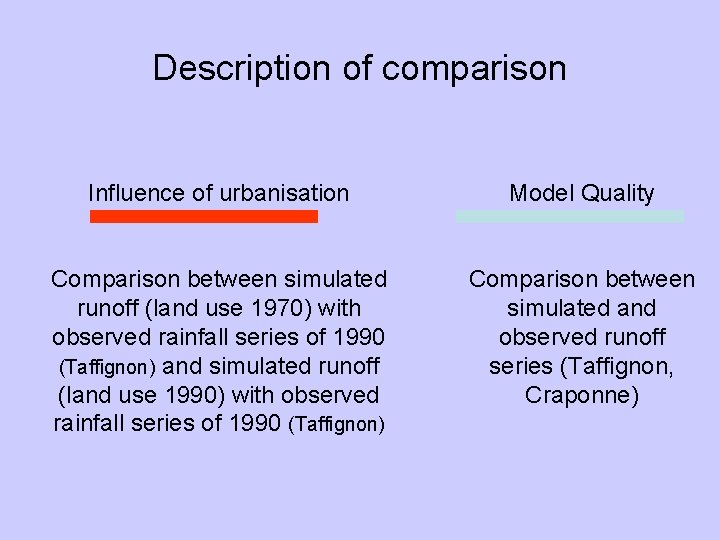
Description of comparison Influence of urbanisation Model Quality Comparison between simulated runoff (land use 1970) with observed rainfall series of 1990 (Taffignon) and simulated runoff (land use 1990) with observed rainfall series of 1990 (Taffignon) Comparison between simulated and observed runoff series (Taffignon, Craponne)
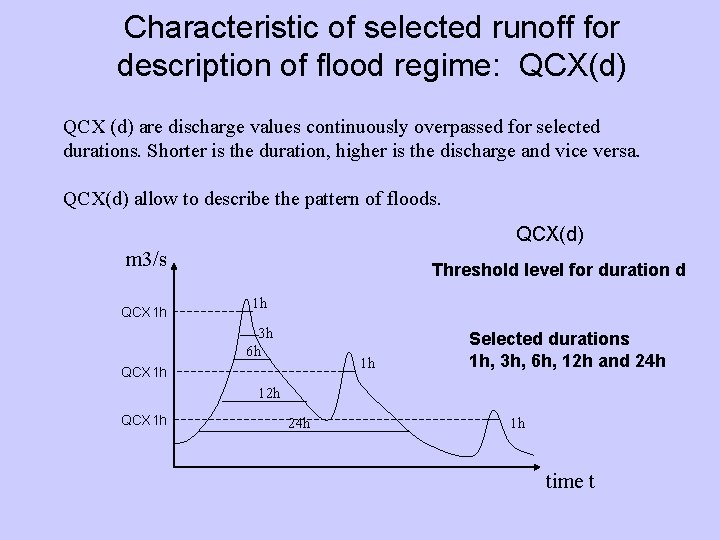
Characteristic of selected runoff for description of flood regime: QCX(d) QCX (d) are discharge values continuously overpassed for selected durations. Shorter is the duration, higher is the discharge and vice versa. QCX(d) allow to describe the pattern of floods. QCX(d) m 3/s QCX 1 h Threshold level for duration d 1 h 3 h 6 h 1 h QCX 1 h Selected durations 1 h, 3 h, 6 h, 12 h and 24 h 12 h QCX 1 h 24 h 1 h time t
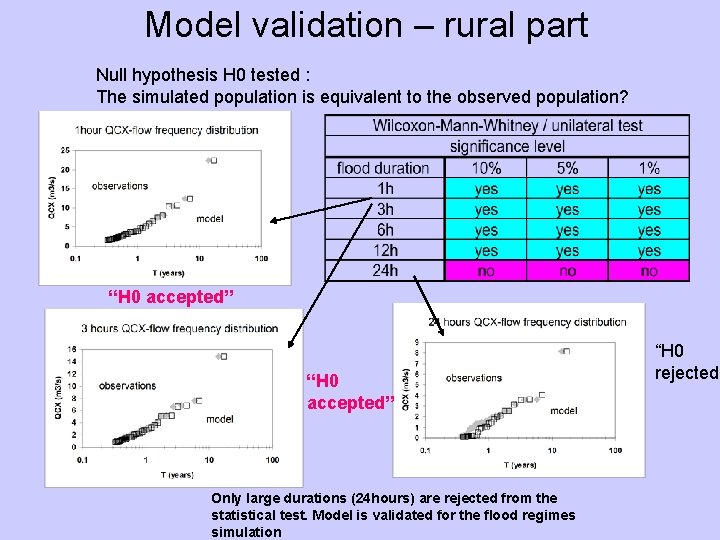
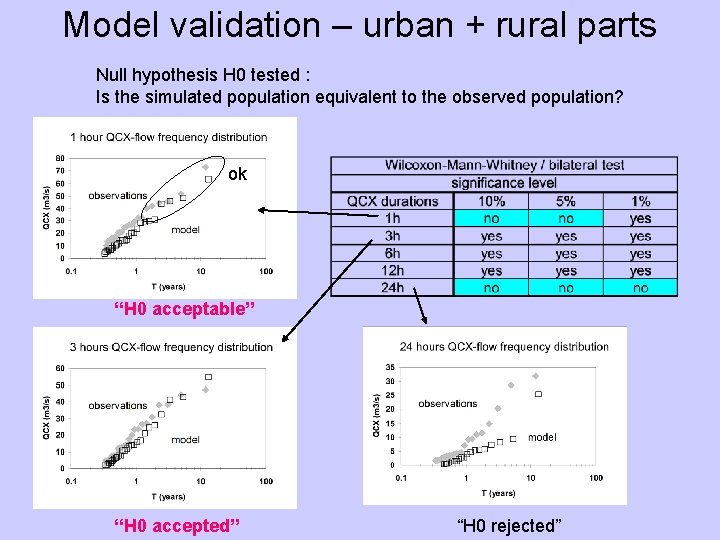
Model validation – rural part Null hypothesis H 0 tested : The simulated population is equivalent to the observed population? “H 0 accepted” Only large durations (24 hours) are rejected from the statistical test. Model is validated for the flood regimes simulation “H 0 rejected”
Model validation – urban + rural parts Null hypothesis H 0 tested : Is the simulated population equivalent to the observed population? ok “H 0 acceptable” “H 0 accepted” “H 0 rejected”
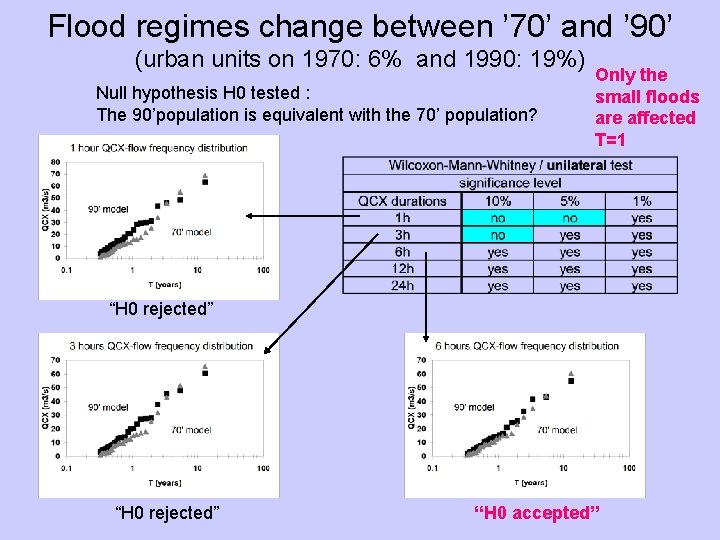
Flood regimes change between ’ 70’ and ’ 90’ (urban units on 1970: 6% and 1990: 19%) Null hypothesis H 0 tested : The 90’population is equivalent with the 70’ population? Only the small floods are affected T=1 “H 0 rejected” “H 0 accepted”
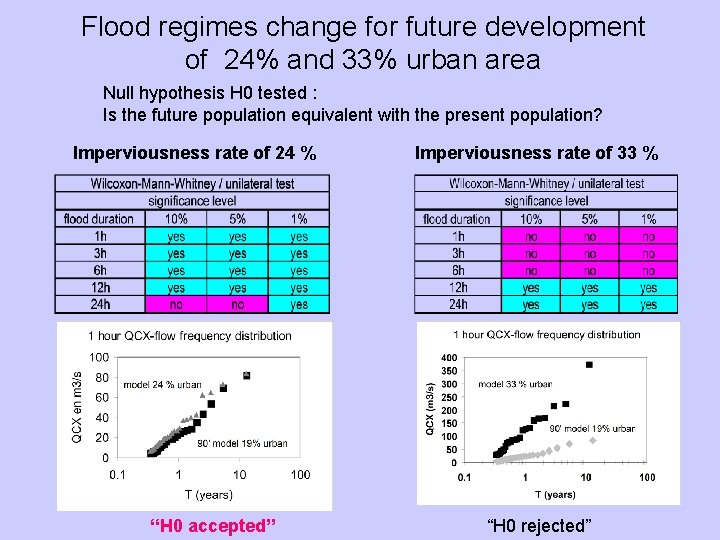
Flood regimes change for future development of 24% and 33% urban area Null hypothesis H 0 tested : Is the future population equivalent with the present population? Imperviousness rate of 24 % “H 0 accepted” Imperviousness rate of 33 % “H 0 rejected”
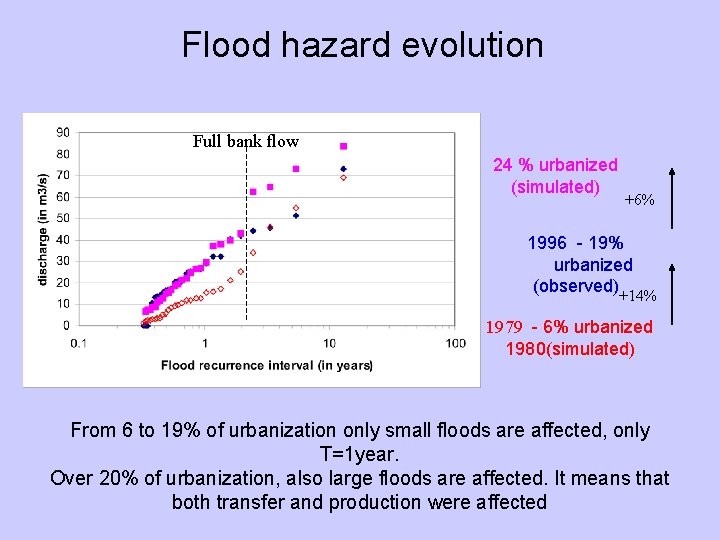
Flood hazard evolution Full bank flow 24 % urbanized (simulated) +6% 1996 - 19% urbanized (observed)+14% 1979 - 6% urbanized 1980(simulated) From 6 to 19% of urbanization only small floods are affected, only T=1 year. Over 20% of urbanization, also large floods are affected. It means that both transfer and production were affected
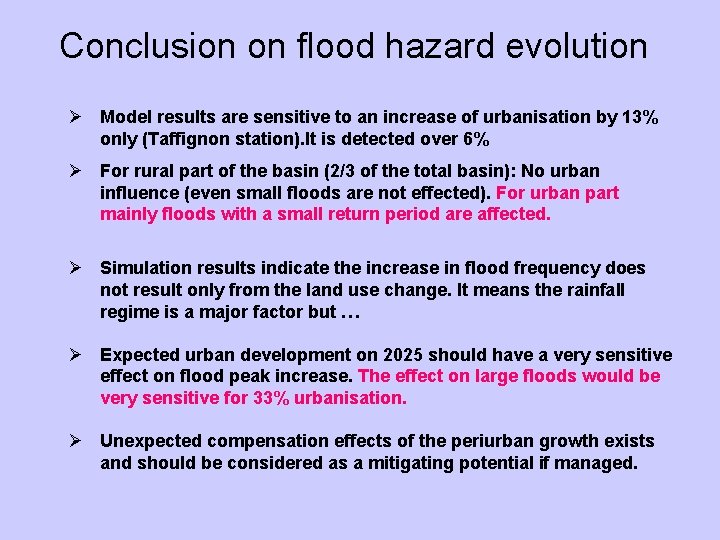
Conclusion on flood hazard evolution Ø Model results are sensitive to an increase of urbanisation by 13% only (Taffignon station). It is detected over 6% Ø For rural part of the basin (2/3 of the total basin): No urban influence (even small floods are not effected). For urban part mainly floods with a small return period are affected. Ø Simulation results indicate the increase in flood frequency does not result only from the land use change. It means the rainfall regime is a major factor but … Ø Expected urban development on 2025 should have a very sensitive effect on flood peak increase. The effect on large floods would be very sensitive for 33% urbanisation. Ø Unexpected compensation effects of the periurban growth exists and should be considered as a mitigating potential if managed.
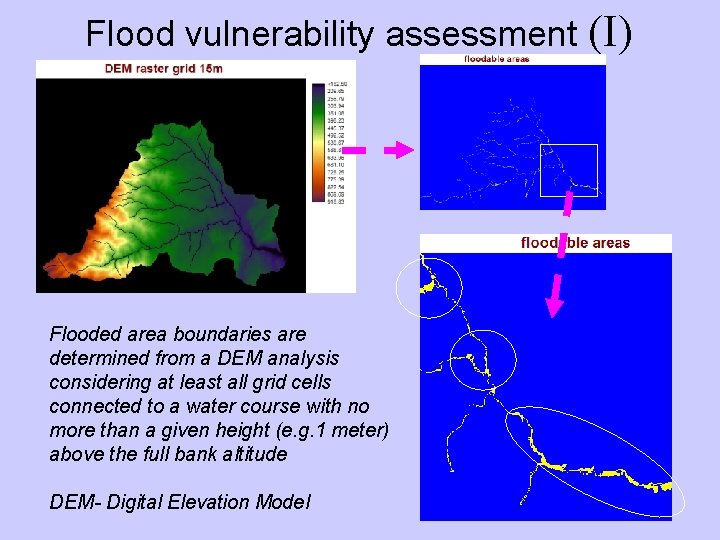
Flood vulnerability assessment Flooded area boundaries are determined from a DEM analysis considering at least all grid cells connected to a water course with no more than a given height (e. g. 1 meter) above the full bank altitude DEM- Digital Elevation Model (I)
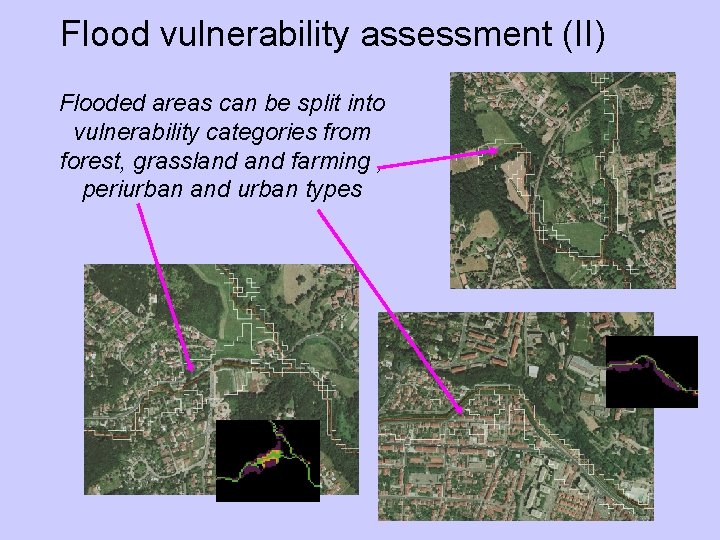
Flood vulnerability assessment (II) Flooded areas can be split into vulnerability categories from forest, grassland farming , periurban and urban types
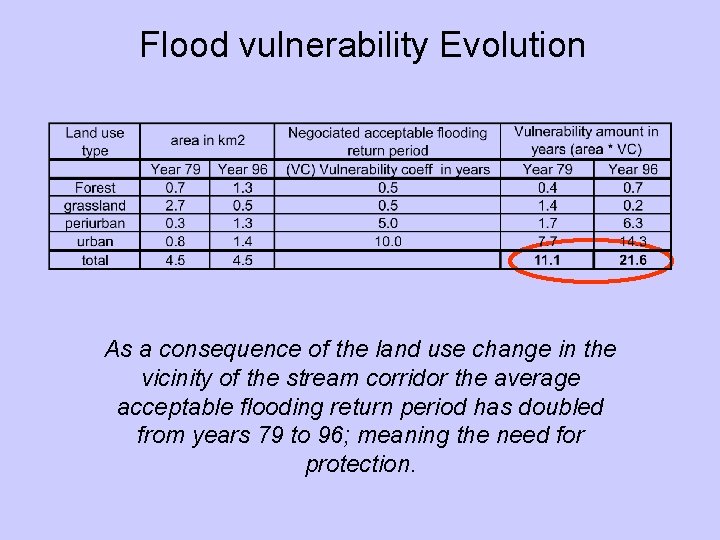
Flood vulnerability Evolution As a consequence of the land use change in the vicinity of the stream corridor the average acceptable flooding return period has doubled from years 79 to 96; meaning the need for protection.
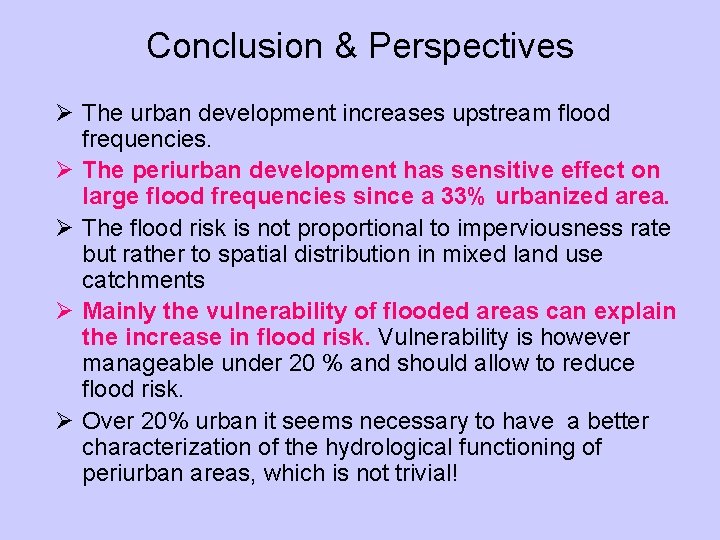
Conclusion & Perspectives Ø The urban development increases upstream flood frequencies. Ø The periurban development has sensitive effect on large flood frequencies since a 33% urbanized area. Ø The flood risk is not proportional to imperviousness rate but rather to spatial distribution in mixed land use catchments Ø Mainly the vulnerability of flooded areas can explain the increase in flood risk. Vulnerability is however manageable under 20 % and should allow to reduce flood risk. Ø Over 20% urban it seems necessary to have a better characterization of the hydrological functioning of periurban areas, which is not trivial!
Thank you !