Signal and Noise in f MRI Graduate Course


 Measured Data Noise Design")
 Task-Related Variability Non-task-related Variability")


?")
?")


 1000 Voxels, 100 Active")


 – Physiology (high-frequency) –")


- Slides: 65
Signal and Noise in f. MRI Graduate Course October 16, 2002
What is signal? What is noise? • Signal, literally defined – Amount of current in receiver coil • What can we control? – – Scanner properties (e. g. , field strength) Experimental task timing Subject compliance (through training) Head motion (to some degree) • What can’t we control? – – Scanner-related noise Physiologic variation (e. g. , heart rate) Some head motion Differences across subjects
Signal, noise, and the General Linear Model Amplitude (solve for) Measured Data Noise Design Model Cf. Boynton et al. , 1996
Signal-Noise-Ratio (SNR) Task-Related Variability Non-task-related Variability
Effects of SNR: Simulation Data • Hemodynamic response – Unit amplitude – Flat prestimulus baseline • Gaussian Noise – Temporally uncorrelated (white) – Noise assumed to be constant over epoch • SNR varied across simulations – Max: 2. 0, Min: 0. 125
SNR = 2. 0
SNR = 1. 0
SNR = 0. 5
SNR = 0. 25
SNR = 0. 125
What are typical SNRs for f. MRI data? • Signal amplitude – MR units: 5 -10 units (baseline: ~700) – Percent signal change: 0. 5 -2% • Noise amplitude – MR units: 10 -50 – Percent signal change: 0. 5 -5% • SNR range – Total range: 0. 1 to 4. 0 – Typical: 0. 2 – 0. 5
Is noise constant through time?
Is f. MRI noise Gaussian (over time)?
Is Signal Gaussian (over voxels)?
What does this mean for f. MRI experiments?
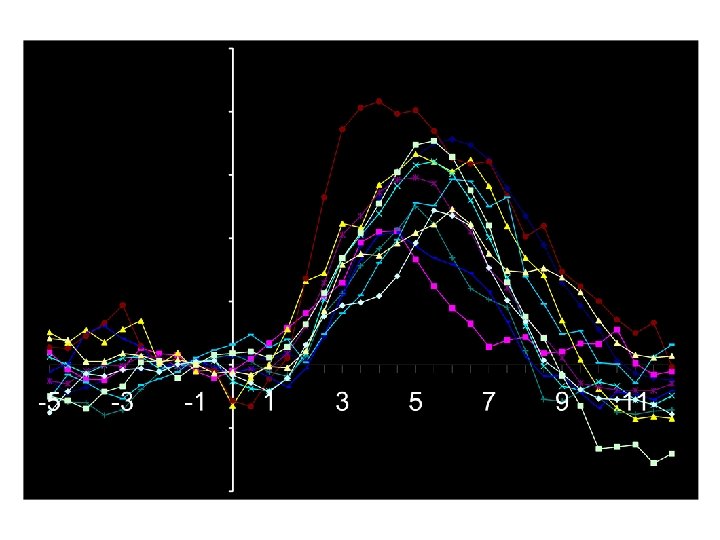
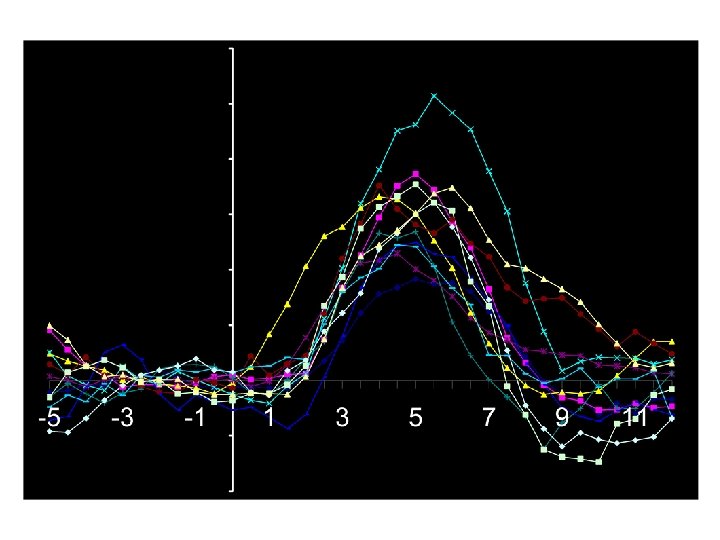
Trial Averaging • Static signal, variable noise – Assumes that the MR data recorded on each trial are composed of a signal + (random) noise • Effects of averaging – Signal is present on every trial, so it remains constant through averaging – Noise randomly varies across trials, so it decreases with averaging – Thus, SNR increases with averaging
Example of Trial Averaging Average of 16 trials with SNR = 0. 6
Fundamental Rule of SNR For Gaussian noise, experimental power increases with the square root of the number of observations
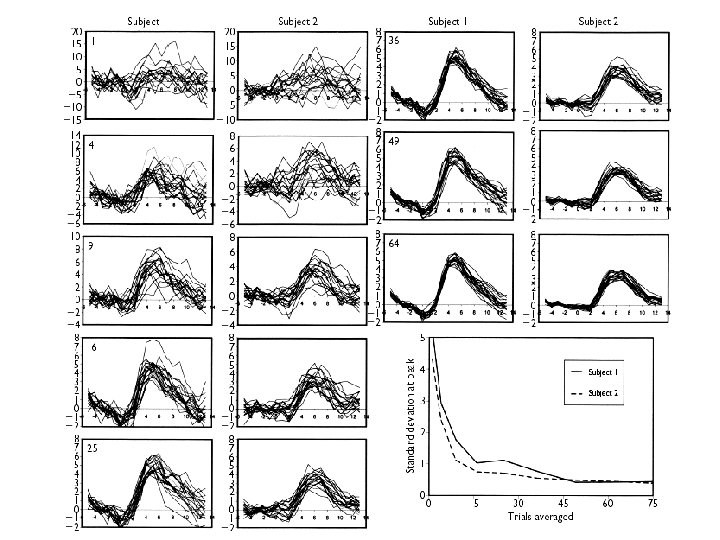
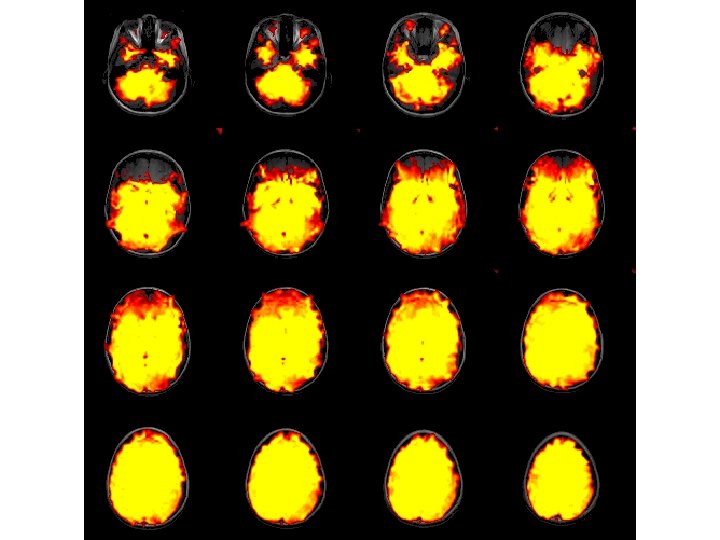
Increasing Power increases Spatial Extent Trials Averaged 500 ms 4 500 ms … 16 36 16 -20 s 64 100 144 Subject 1 Subject 2
Effects of Signal-Noise Ratio on extent of activation: Empirical Data Number of Significant Voxels Subject 1 Subject 2 VN = Vmax[1 - e(-0. 016 * N)] Number of Trials Averaged
Active Voxel Simulation Signal + Noise (SNR = 1. 0) 1000 Voxels, 100 Active Noise • Signal waveform taken from observed data. • Signal amplitude distribution: Gamma (observed). • Assumed Gaussian white noise.
Number of Activated Voxels Effects of Signal-Noise Ratio on extent of activation: Simulation Data SNR = 1. 00 SNR = 0. 52 (Young) SNR = 0. 35 (Old) SNR = 0. 25 SNR = 0. 10 Number of Trials Averaged
Subject Averaging
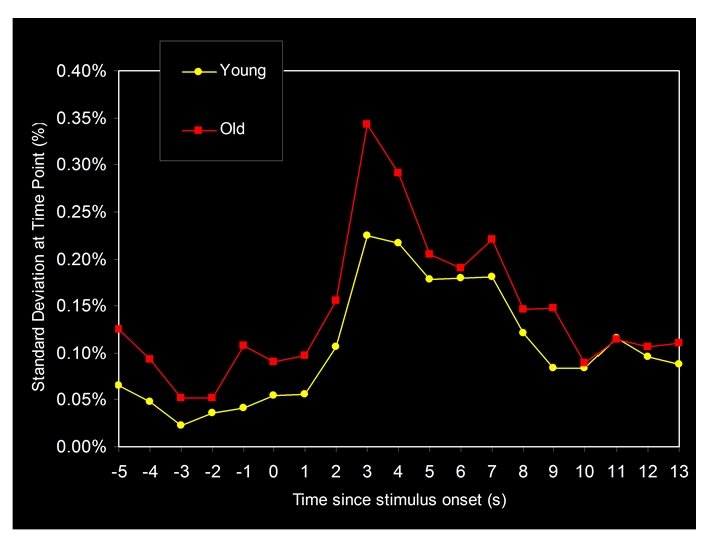
Variability Across Subjects D’Esposito et al. , 1999
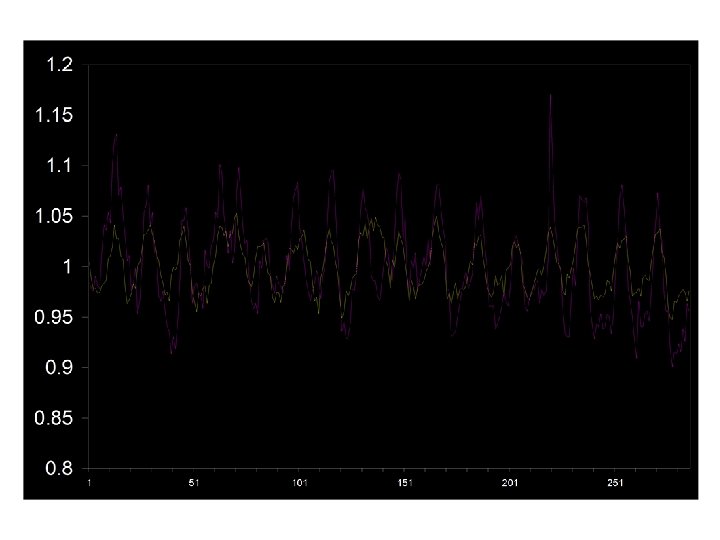
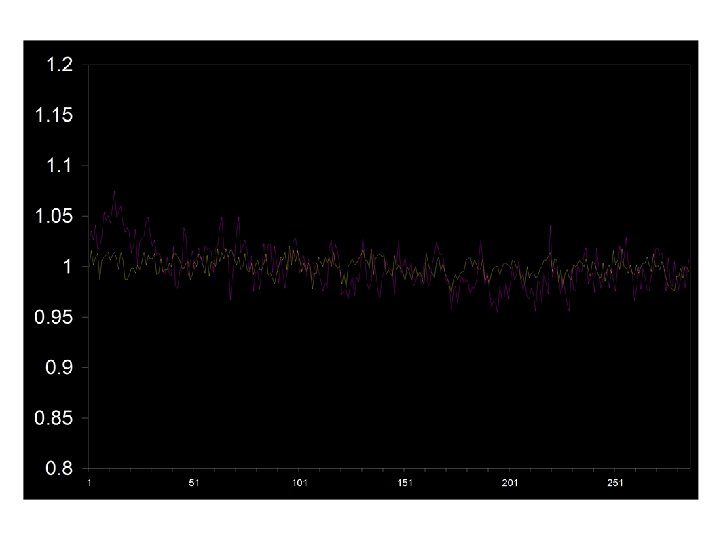
Young Adults
Elderly Adults
Implications of Inter-Subject Variability • Use of individual subject’s hemodynamic responses – Corrects for differences in latency/shape • Suggests iterative HDR analysis – Initial analyses use canonical HDR – Functional ROIs drawn, interrogated for new HDR – Repeat until convergence • Requires appropriate statistical measures – Random effects analyses – Use statistical tests across subjects as dependent measure (rather than averaged data)
Effects of Suboptimal Sampling
Visual HDR sampled with a 1 -sec TR
Visual HDR sampled with a 2 -sec TR
Visual HDR sampled with a 3 -sec TR
Comparison of Visual HDR sampled with 1, 2, and 3 -sec TR
Visual HDRs with 10% diff sampled with a 1 -sec TR
Visual HDR with 10% diff sampled with a 3 -sec TR
Partial Volume Effects
Partial Volume Effects
Partial Volume Effects
Partial Volume Effects
Partial Volume Effects
Where are partial volume effects most problematic? • Ventricles • Grey / white boundary • Blood vessels
Activation Profiles Gray / White Ventricle Gray / White Matter Ventricle
Sources of Noise
What causes variation in MR signal? • • • Field strength Excitation vs. Inhibition Large vessel effects Differences across the brain Timing of cognitive processes
Excitation vs. Inhibition M 1 SMA Waldvogel, et al. , 2000
Types of Noise • Thermal noise – Responsible for variation in background – Eddy currents, scanner heating • Power fluctuations – Typically caused by scanner problems • • Variation in subject cognition Head motion effects Physiological changes Artifact-induced problems
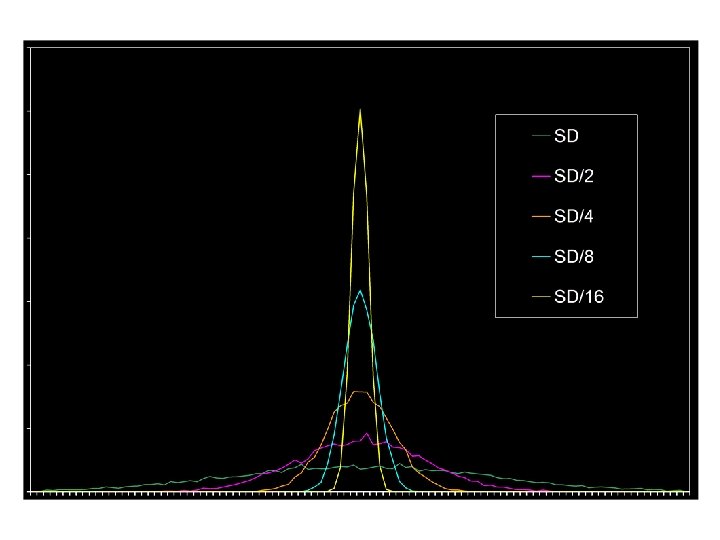
Standard Deviation Image
Low Frequency Noise
High Frequency Noise
Filtering Approaches • Identify unwanted frequency variation – Drift (low-frequency) – Physiology (high-frequency) – Task overlap (high-frequency) • Reduce power around those frequencies through application of filters • Potential problem: removal of frequencies composing response of interest
Variability in Subject Behavior: Issues • Cognitive processes are not static – May take time to engage – Often variable across trials – Subjects’ attention/arousal wax and wane • Subjects adopt different strategies – Feedback- or sequence-based – Problem-solving methods • Subjects engage in non-task cognition – Non-task periods do not have the absence of thinking What can we do about these problems?
Physiology • Head Motion • Respiration – Motion – Shadowing • Heart Rate
Motion Effects • Motion within an image acquisition – Results in blurring – Especially noticeable in 3 D high-res images • Motion across acquisitions – More of a problem for f. MRI • Significant if ½ voxel or greater (>2 mm) • Increases with subject fatigue • Potential confound for subject studies – Minimized through use of restraints • Padding, vacuum pack (BIAC) • Head masks, bite bars/mouthpieces, etc. (other centers) • Tape indicators – Usually corrected in preprocessing
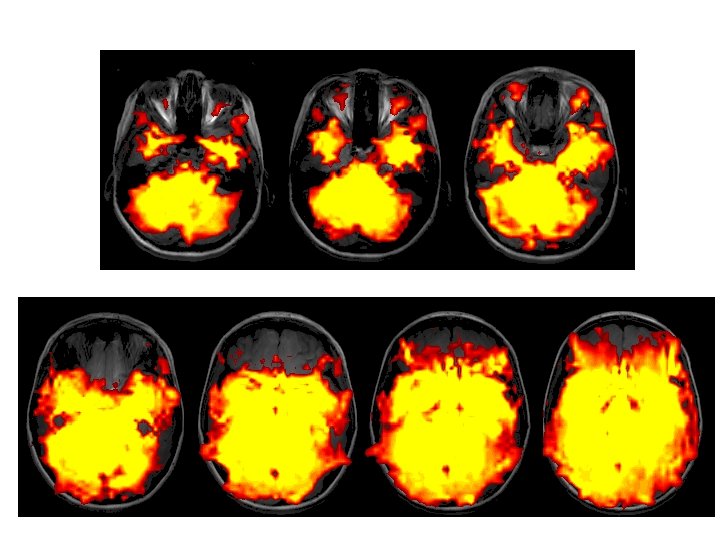
Head Motion Effects
Head Motion: Good and Bad
Image Artifacts
Caveats • Signal averaging is based on assumptions – Data = signal + temporally invariant noise – Noise is uncorrelated over time • If assumptions are violated, then averaging ignores potentially valuable information – Amount of noise varies over time – Some noise is temporally correlated (physiology) • Nevertheless, averaging provides robust, reliable method for determining brain activity