
Acknowledgements Ken Frankel Chris Neilson Michael Blum Joe
Acknowledgements Ken Frankel Chris Neilson Michael Blum Joe Ferrara 8. 3. 1 creator: Tom Alber 8. 3. 1 PRT head: Jamie Cate Center for Structure of Membrane Proteins Membrane Protein Expression Center II Center for HIV Accessory and Regulatory Complexes W. M. Keck Foundation Plexxikon, Inc. M D Anderson CRC University of California Berkeley University of California San Francisco National Science Foundation University of California Campus-Laboratory Collaboration Grant Henry Wheeler The Advanced Light Source is supported by the Director, Office of Science, Office of Basic Energy Sciences, Materials Sciences Division, of the US Department of Energy under contract No. DE-AC 02 -05 CH 11231 at Lawrence Berkeley National Laboratory.

The “success rate” of structure determination 100 s/dataset 200 days/year ~150 beamlines ~26, 000 datasets/year 8000 PDBs in 2010
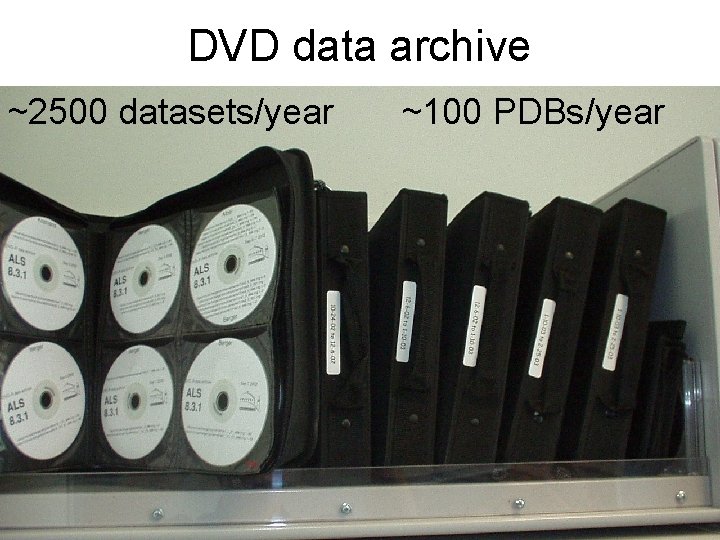
DVD data archive ~2500 datasets/year ~100 PDBs/year
Why do structures fail? Overlaps Radiation Damage Signal to noise
Why do structures fail? Overlaps Radiation Damage Signal to noise
Why do structures fail? Overlaps Radiation Damage Signal to noise
Why do structures fail? Overlaps Radiation Damage Signal to noise
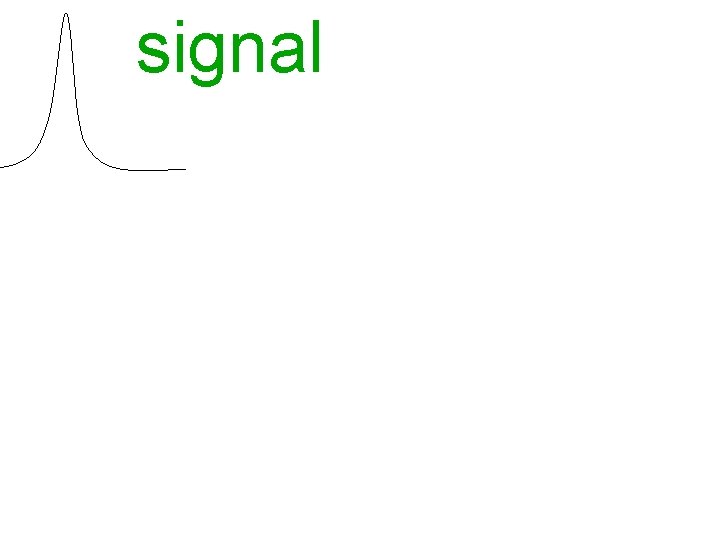
signal vs noise
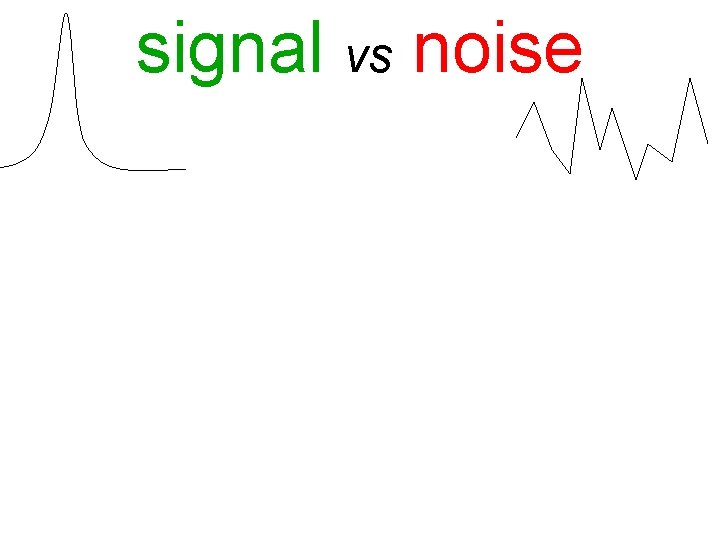
signal vs noise
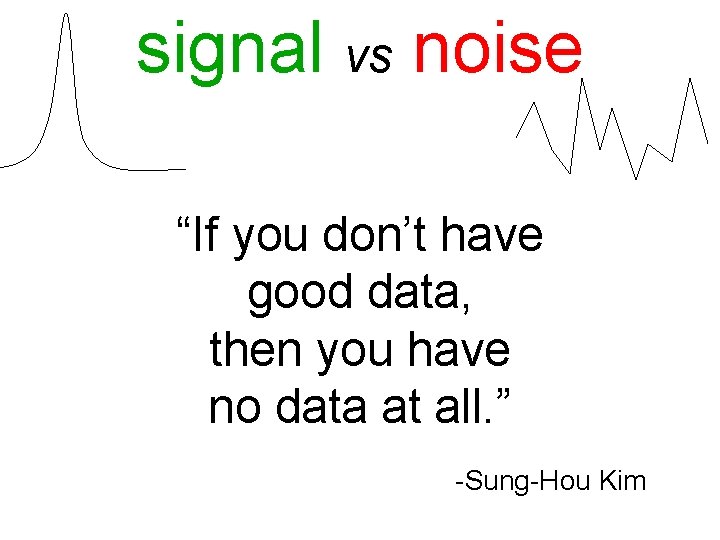
signal vs noise “If you don’t have good data, then you have no data at all. ” -Sung-Hou Kim
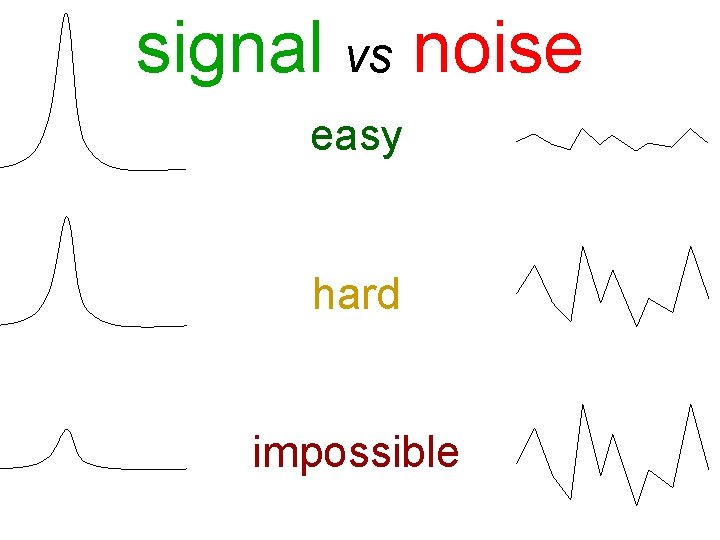
signal vs noise easy hard impossible
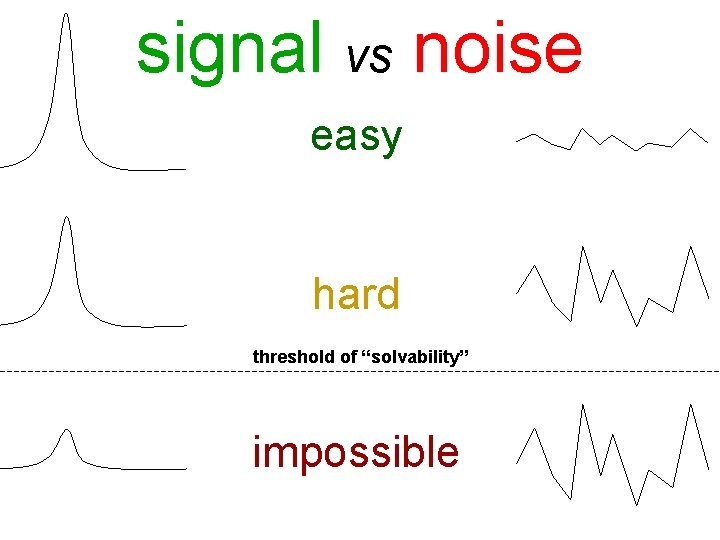
signal vs noise easy hard threshold of “solvability” impossible
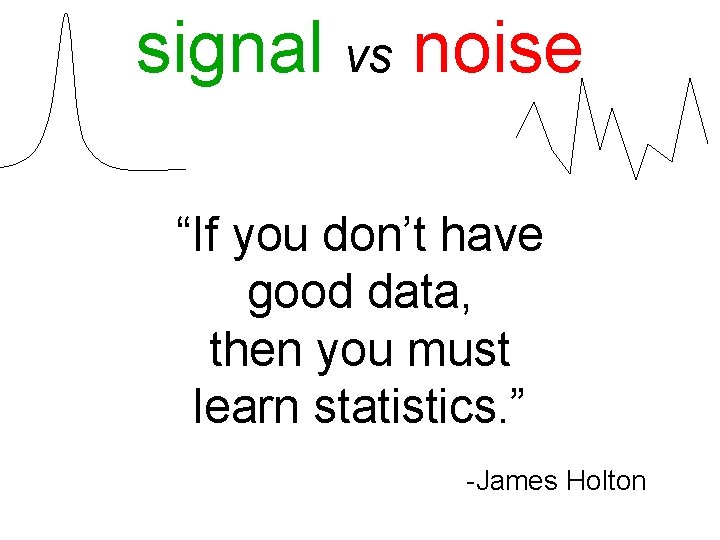
signal vs noise “If you don’t have good data, then you must learn statistics. ” -James Holton
Adding noise
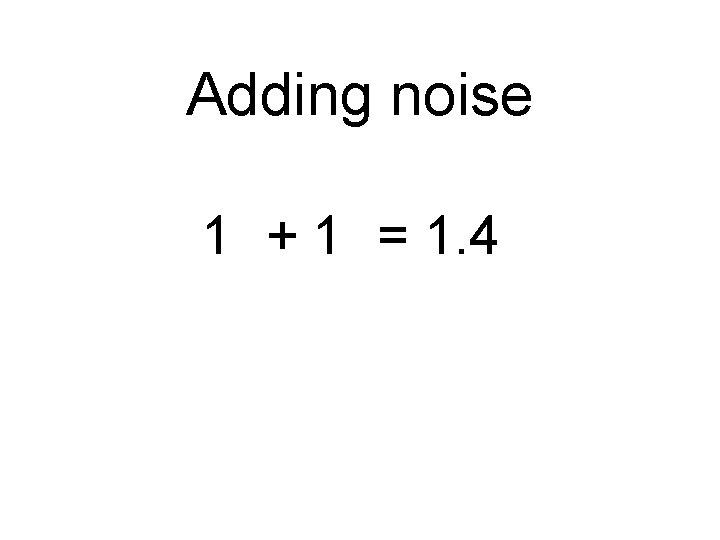
Adding noise 2 2 1 + 1 = 1. 4 2
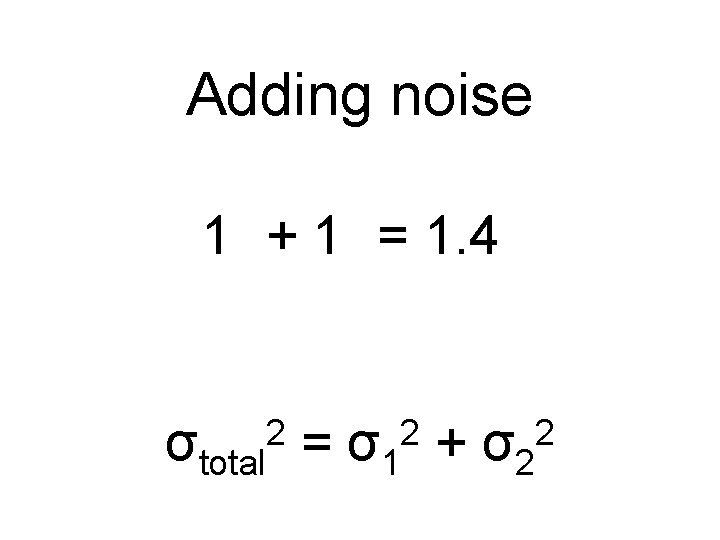
Adding noise 2 2 2 1 + 1 = 1. 4 3 + 1 = 3. 2 σtotal = σ1 + σ2 2
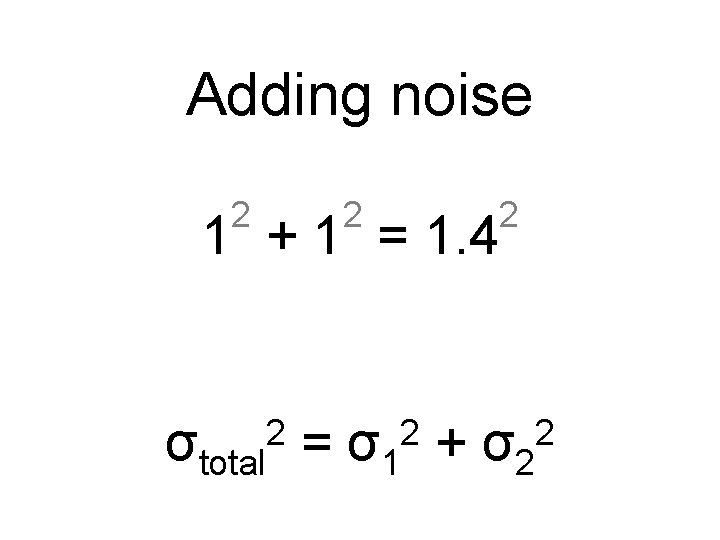
Adding noise 2 2 2 1 + 1 = 1. 4 3 + 1 = 3. 2 σtotal = σ1 + σ2 2
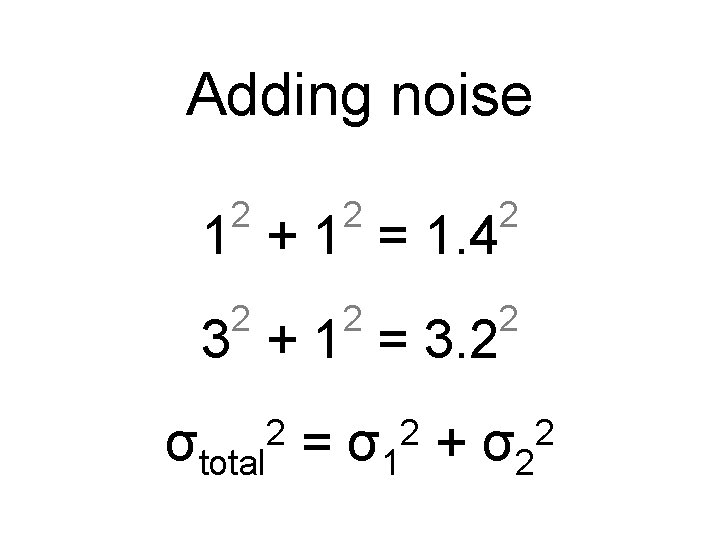
Adding noise 2 2 2 1 + 1 = 1. 4 3 + 1 = 3. 2 σtotal = σ1 + σ2 2
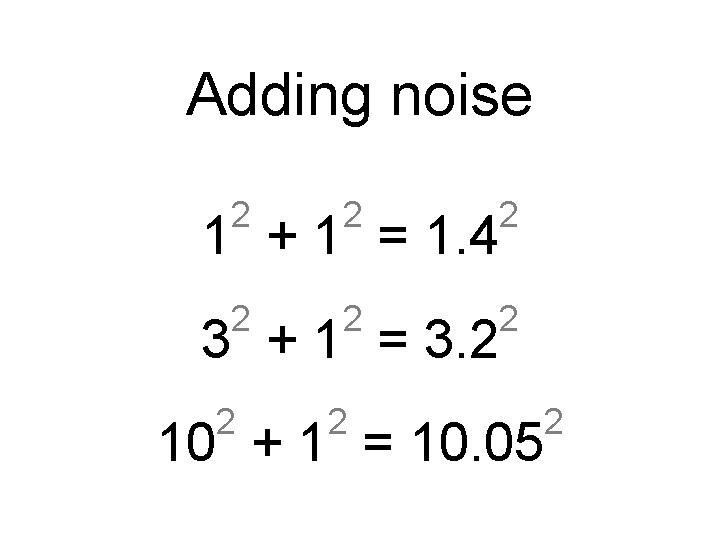
Adding noise 2 2 2 1 + 1 = 1. 4 3 + 1 = 3. 2 2 2 10 + 1 = 10. 05 2
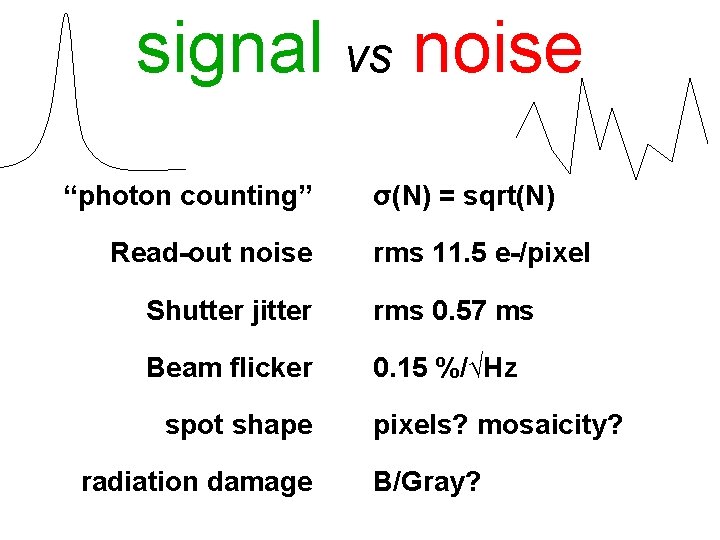
signal vs noise “photon counting” Read-out noise σ(N) = sqrt(N) rms 11. 5 e-/pixel Shutter jitter rms 0. 57 ms Beam flicker 0. 15 %/√Hz spot shape radiation damage pixels? mosaicity? B/Gray?
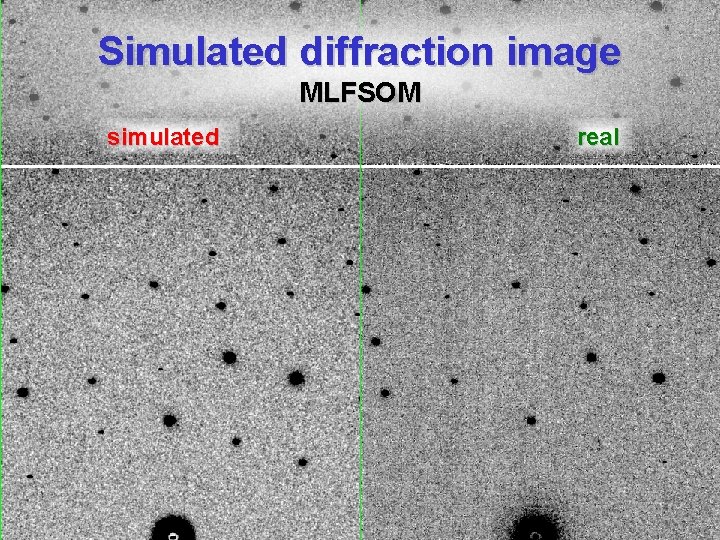
Simulated diffraction image MLFSOM simulated real
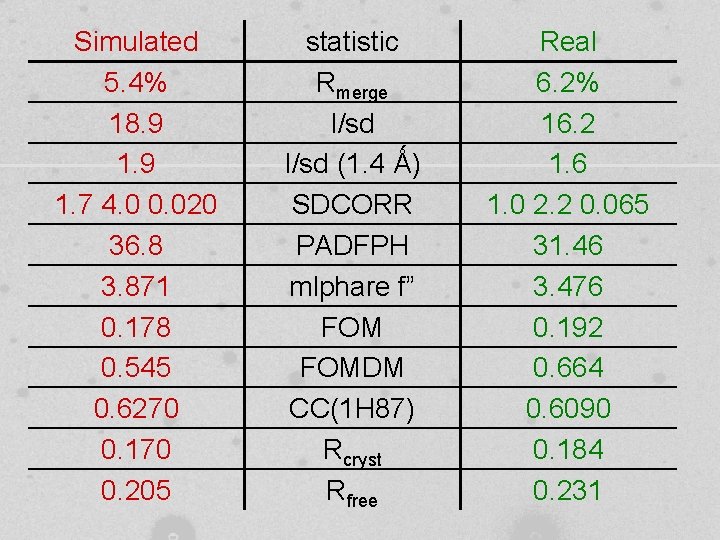
Simulated 5. 4% 18. 9 1. 7 4. 0 0. 020 36. 8 3. 871 0. 178 0. 545 0. 6270 0. 170 0. 205 statistic Rmerge I/sd (1. 4 Ǻ) SDCORR PADFPH mlphare f” FOMDM CC(1 H 87) Rcryst Rfree Real 6. 2% 16. 2 1. 6 1. 0 2. 2 0. 065 31. 46 3. 476 0. 192 0. 664 0. 6090 0. 184 0. 231
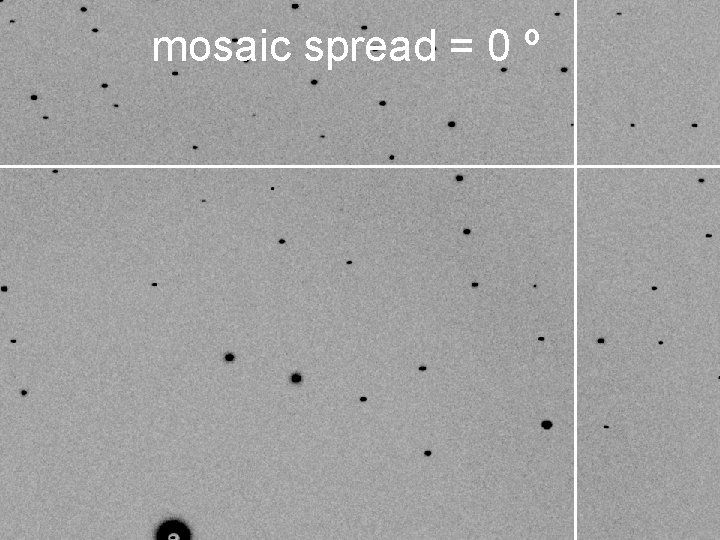
mosaic spread = 0 º
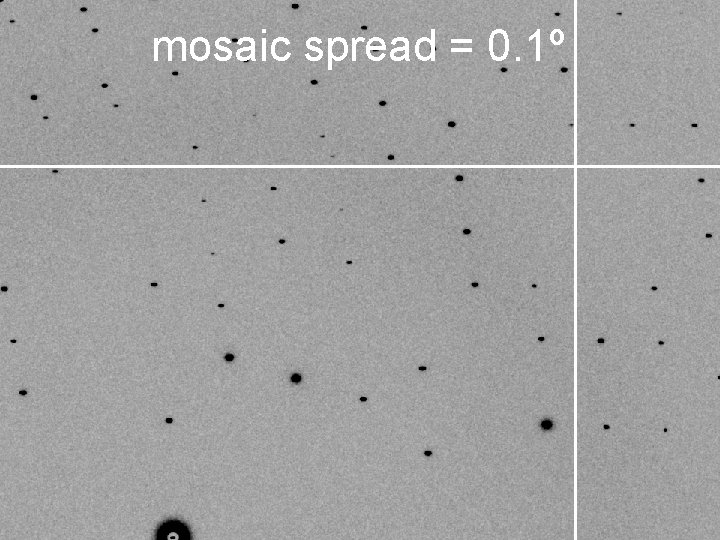
mosaic spread = 0. 1º
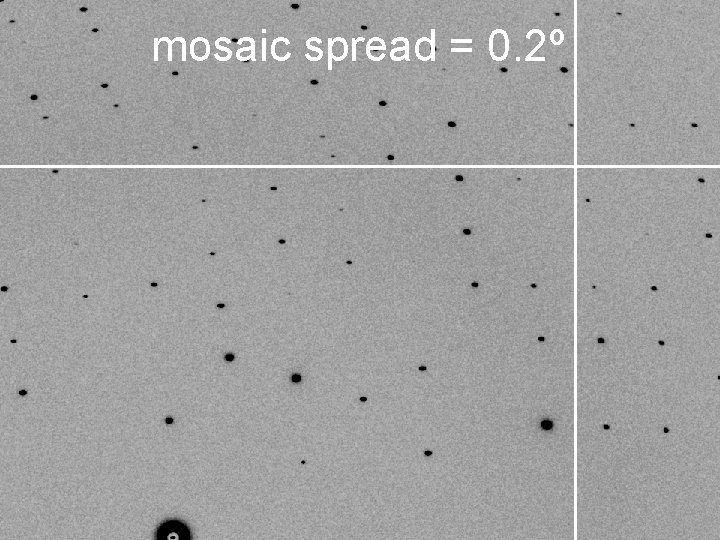
mosaic spread = 0. 2º
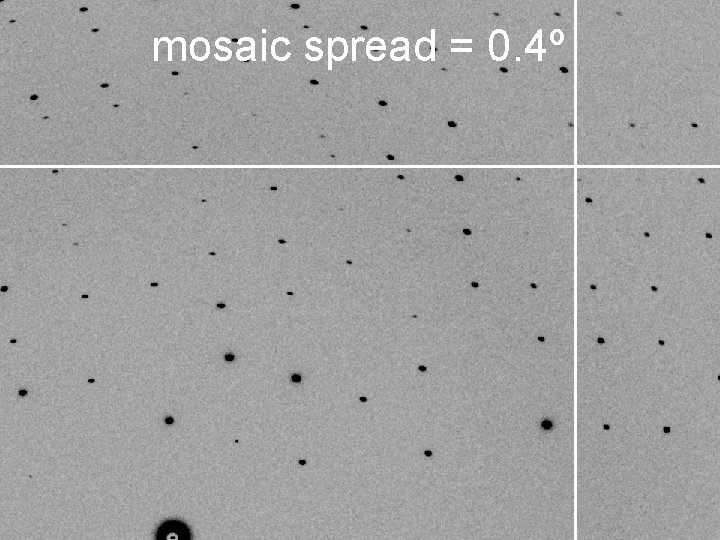
mosaic spread = 0. 4º
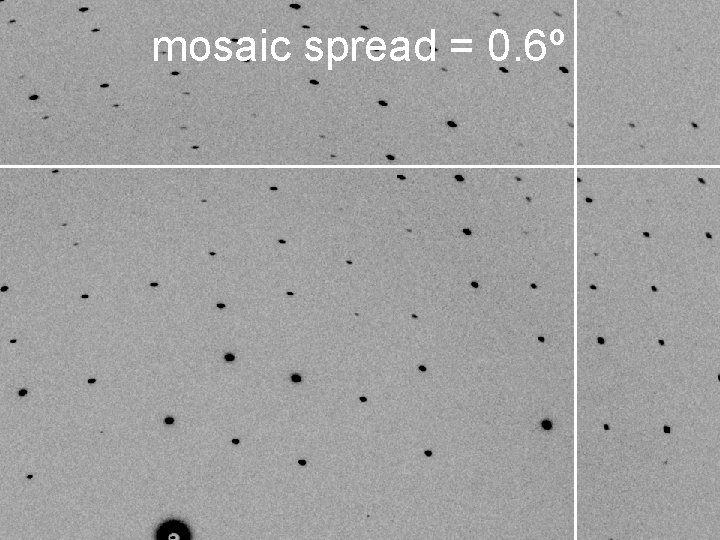
mosaic spread = 0. 6º
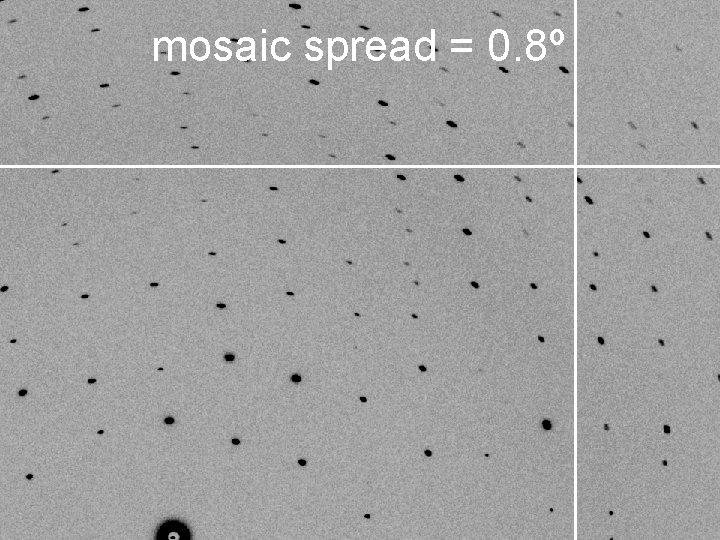
mosaic spread = 0. 8º
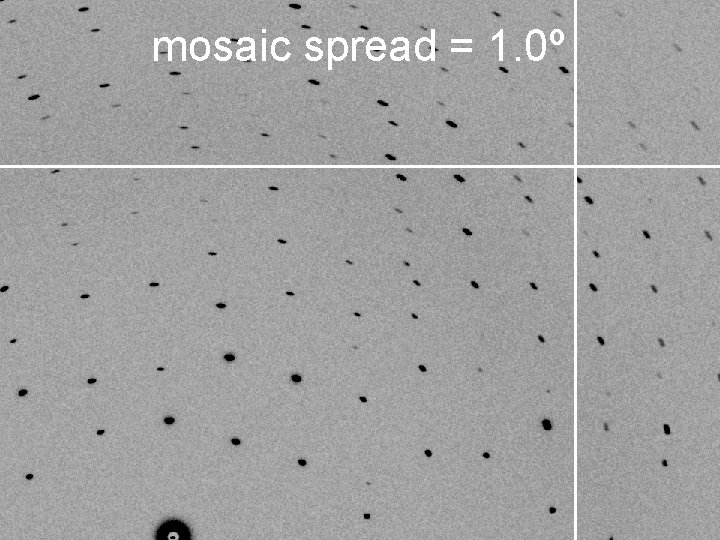
mosaic spread = 1. 0º
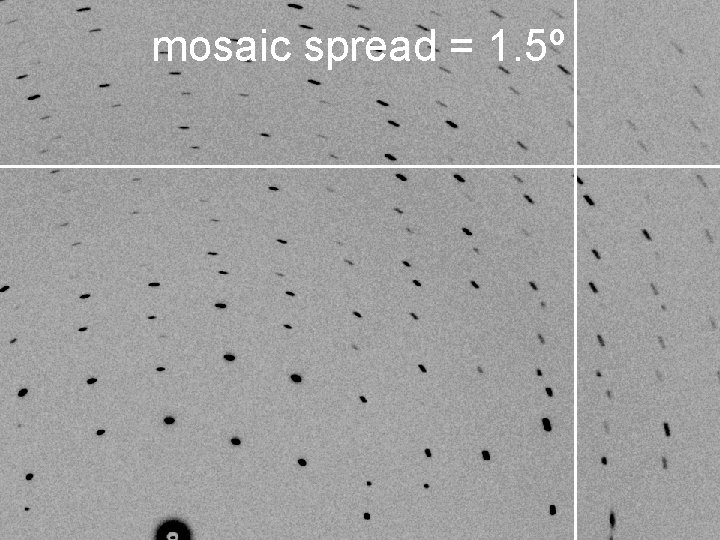
mosaic spread = 1. 5º
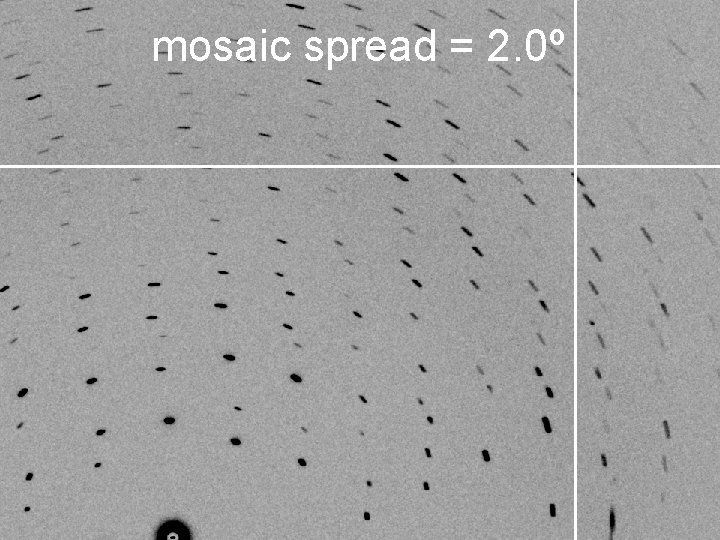
mosaic spread = 2. 0º
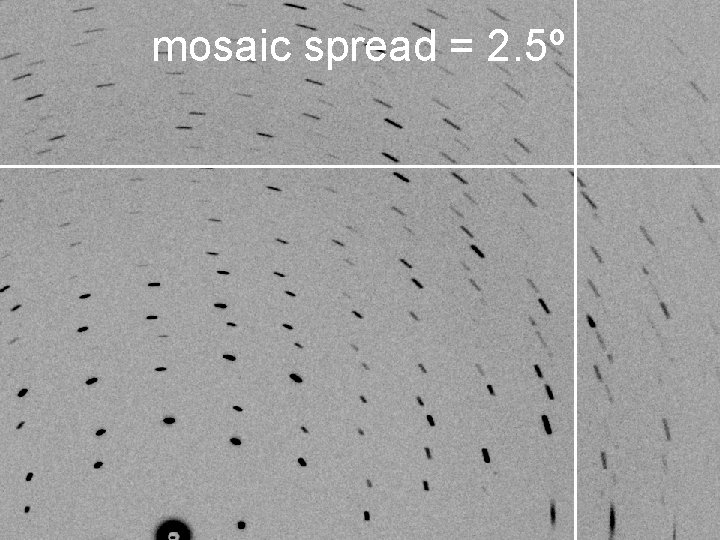
mosaic spread = 2. 5º
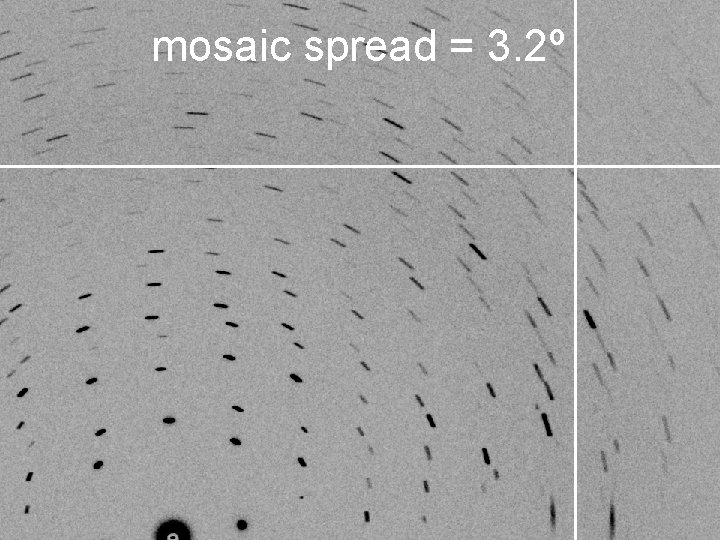
mosaic spread = 3. 2º
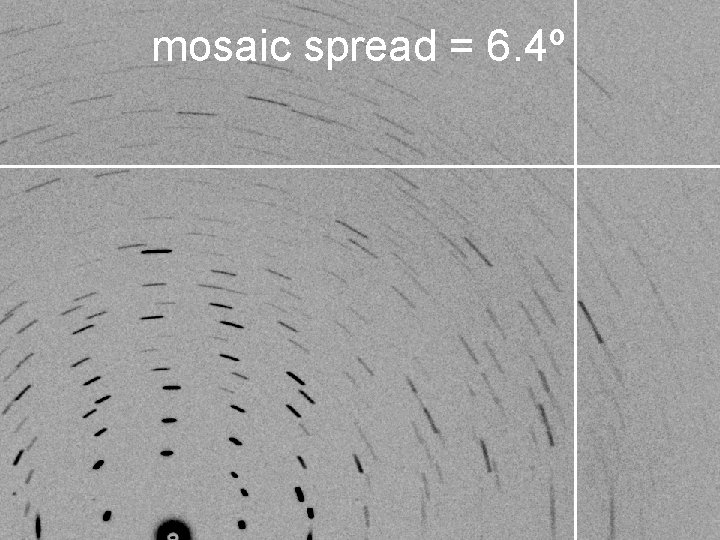
mosaic spread = 6. 4º
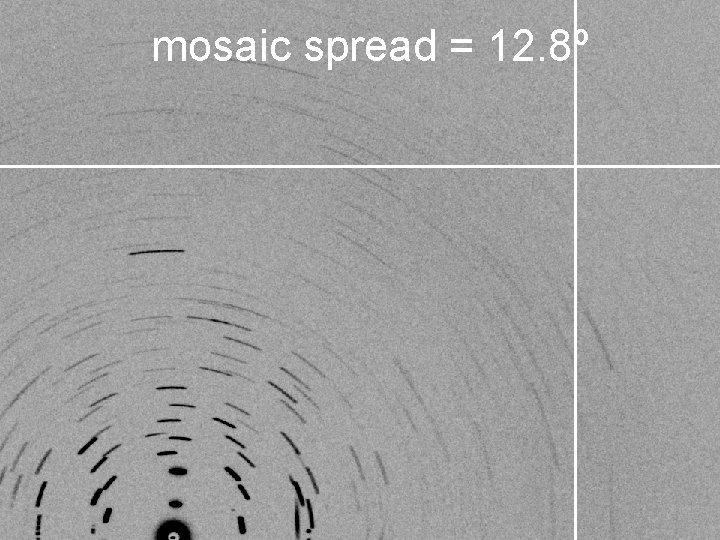
mosaic spread = 12. 8º
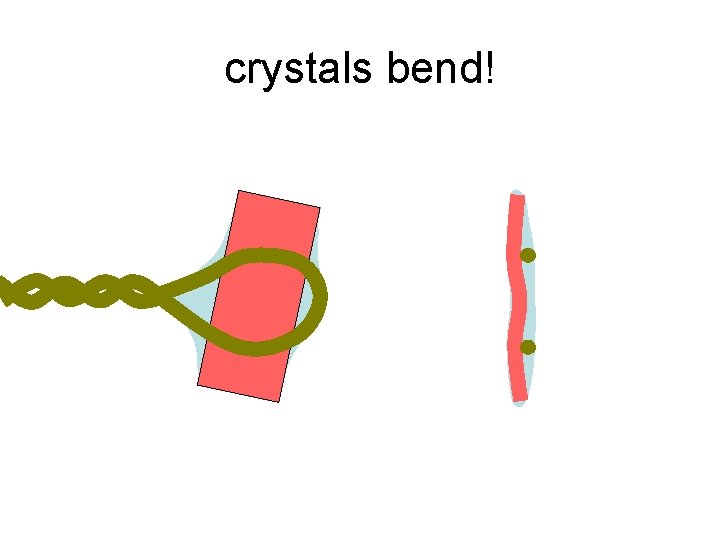
crystals bend!
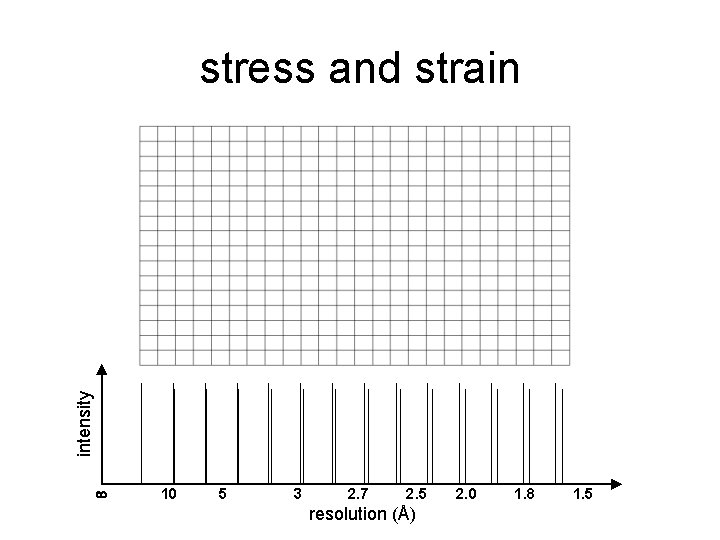
intensity stress and strain 10 5 3 2. 7 2. 5 resolution (Å) 2. 0 1. 8 1. 5
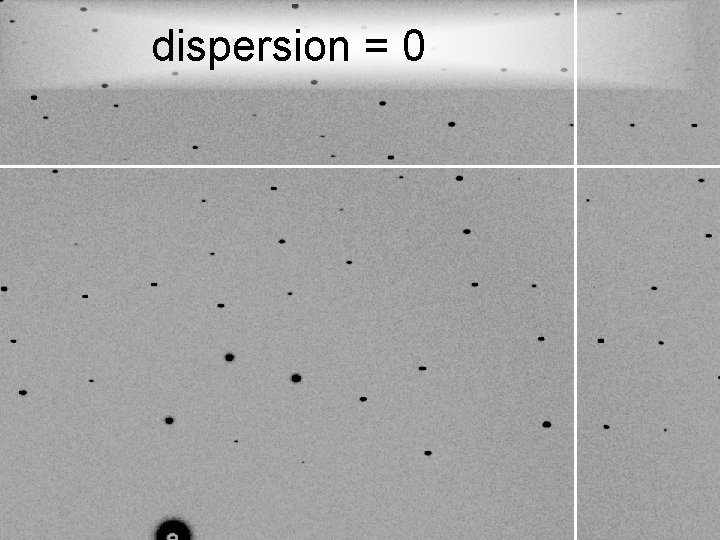
dispersion = 0
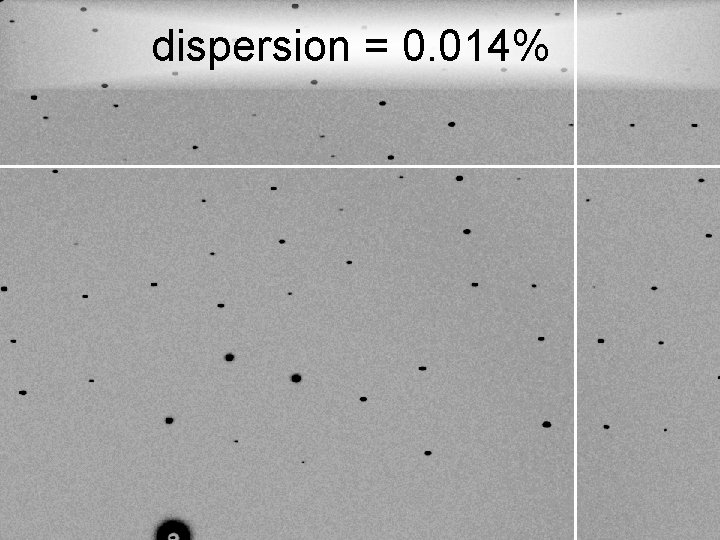
dispersion = 0. 014%
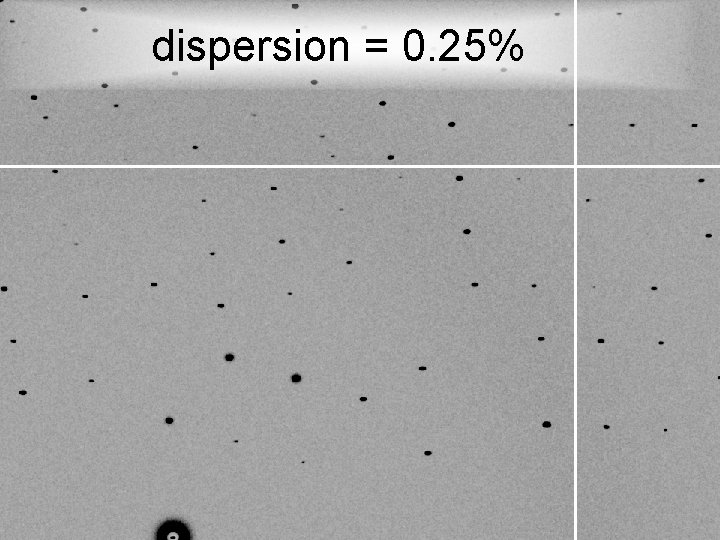
dispersion = 0. 25%
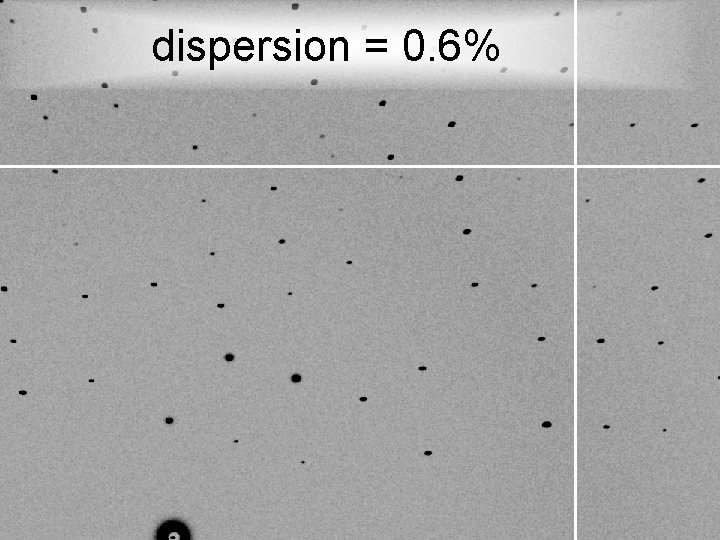
dispersion = 0. 6%
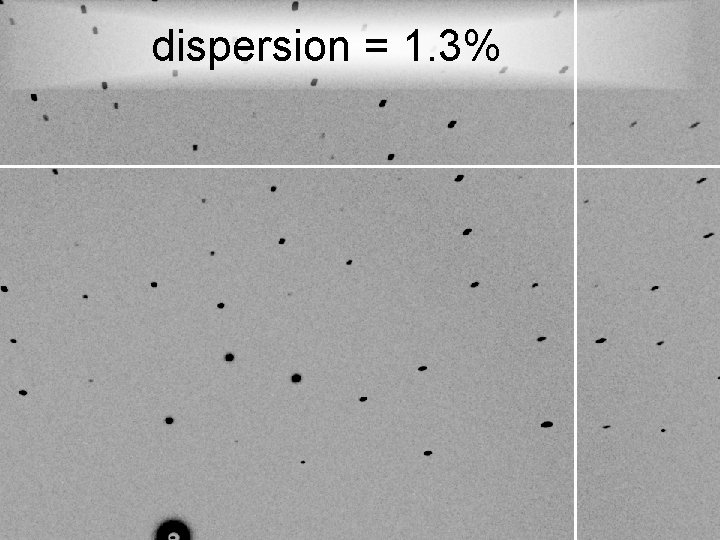
dispersion = 1. 3%
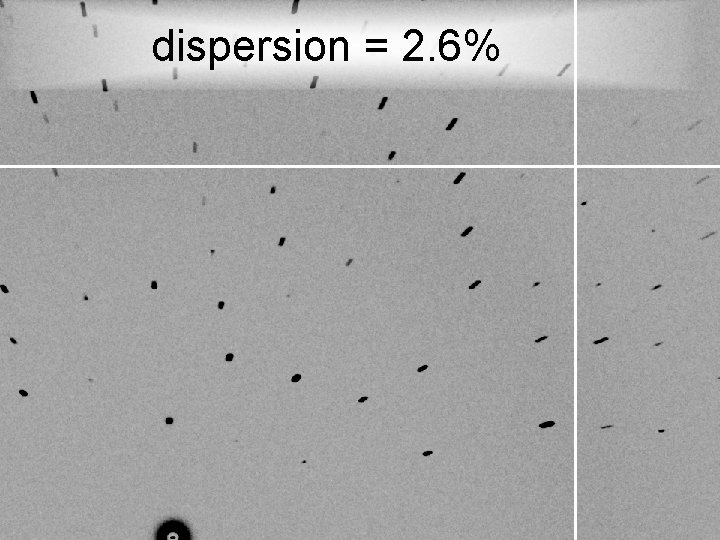
dispersion = 2. 6%
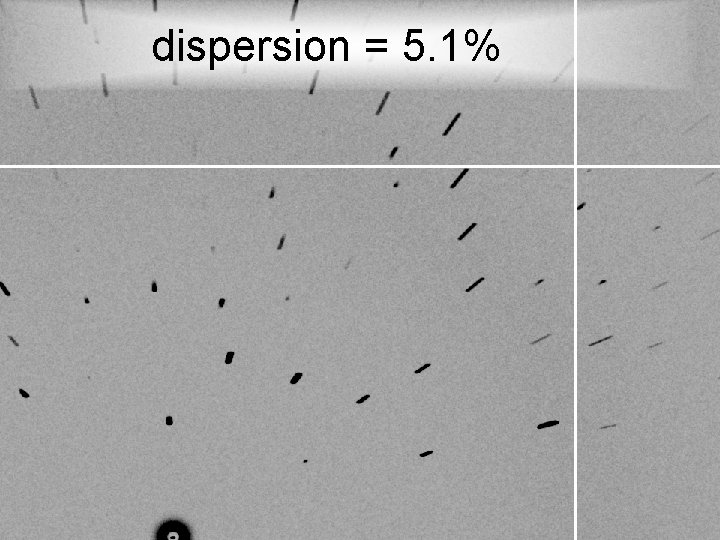
dispersion = 5. 1%
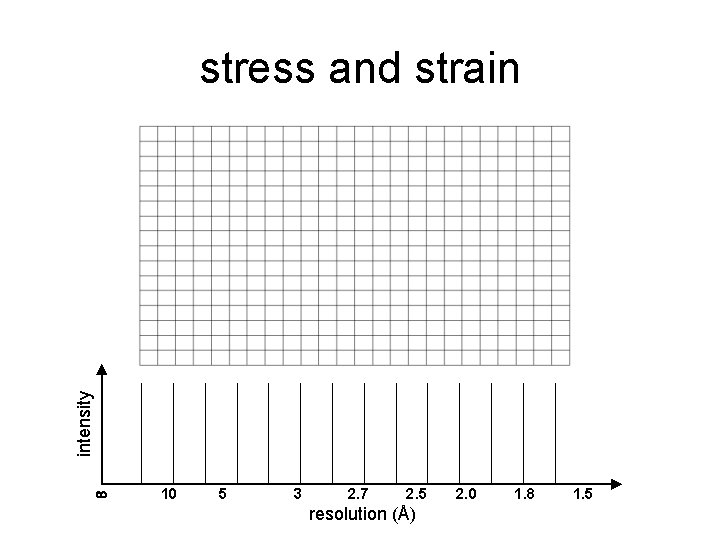
intensity stress and strain 10 5 3 2. 7 2. 5 resolution (Å) 2. 0 1. 8 1. 5
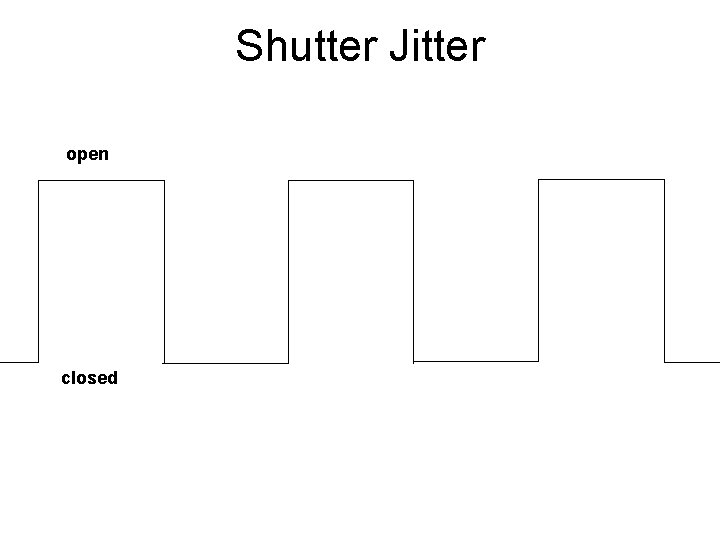
Shutter Jitter open closed
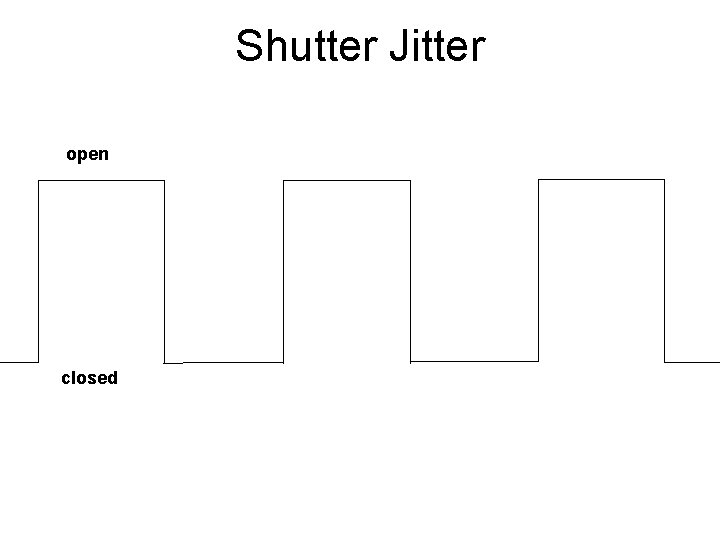
Shutter Jitter open closed
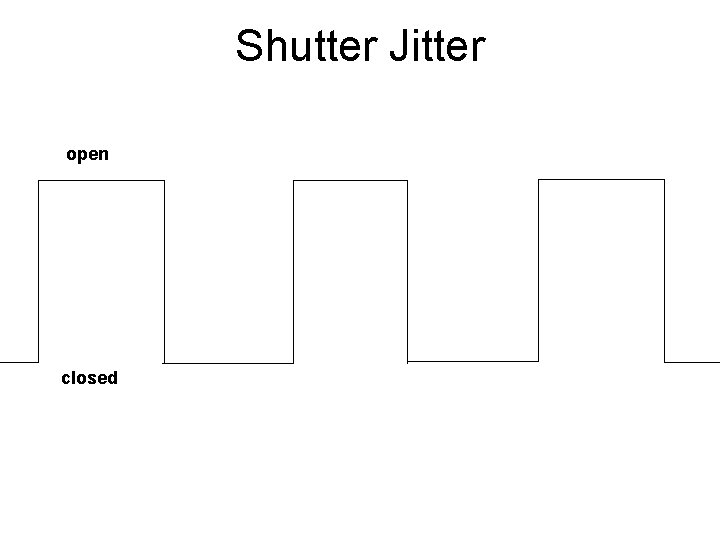
Shutter Jitter open closed
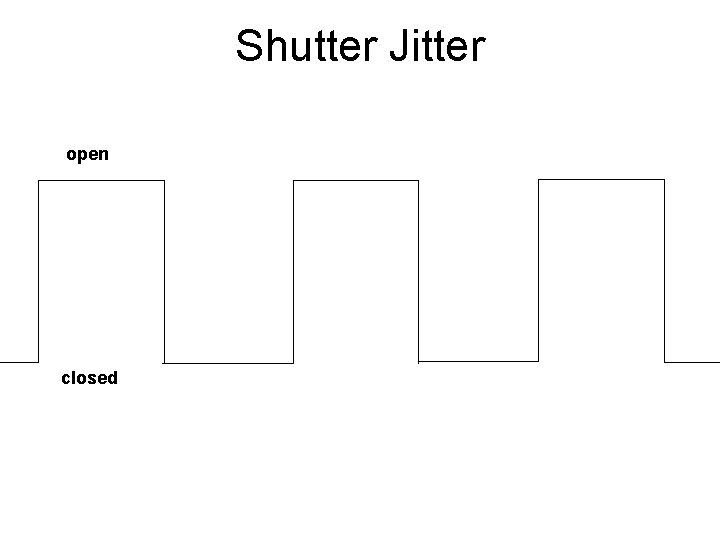
Shutter Jitter open closed
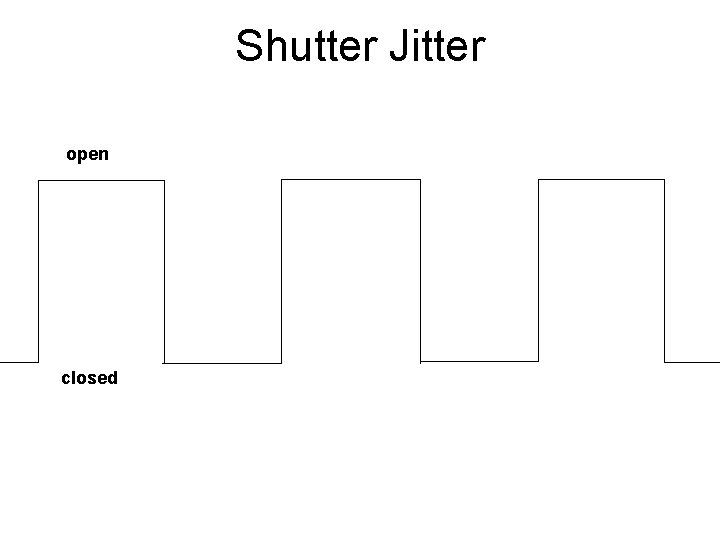
Shutter Jitter open closed
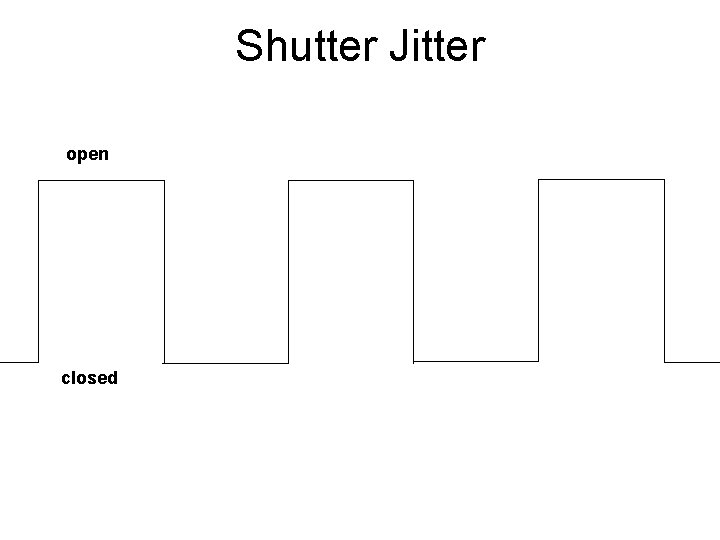
Shutter Jitter open closed
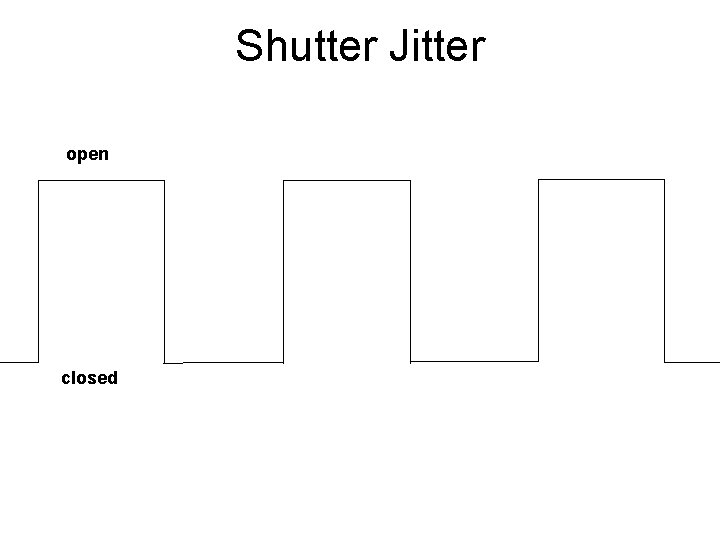
Shutter Jitter open closed
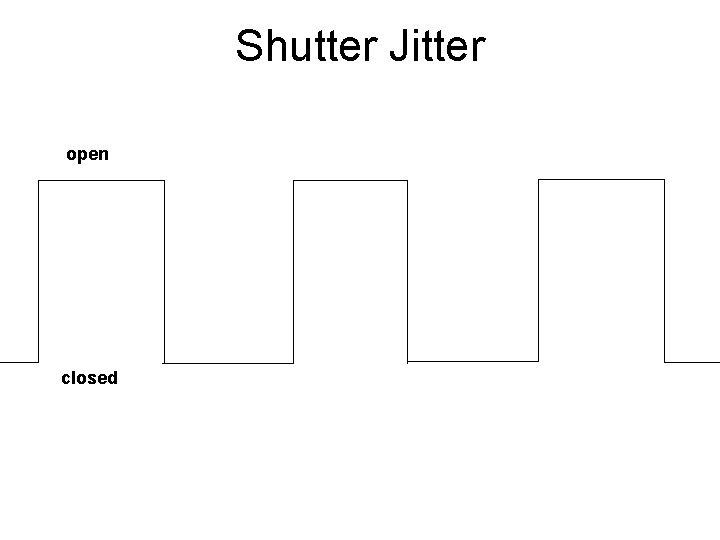
Shutter Jitter open closed
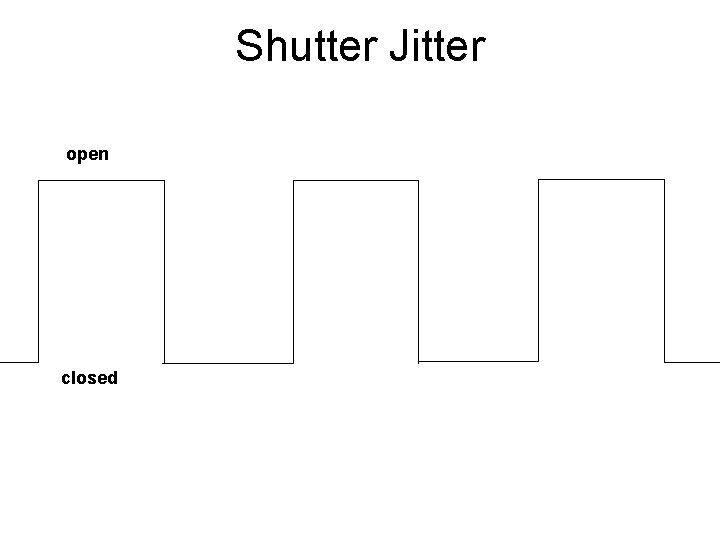
Shutter Jitter open closed
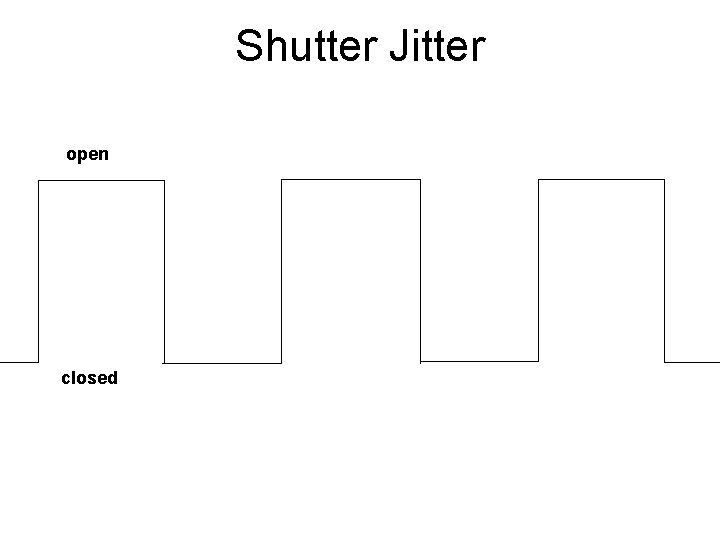
Shutter Jitter open closed
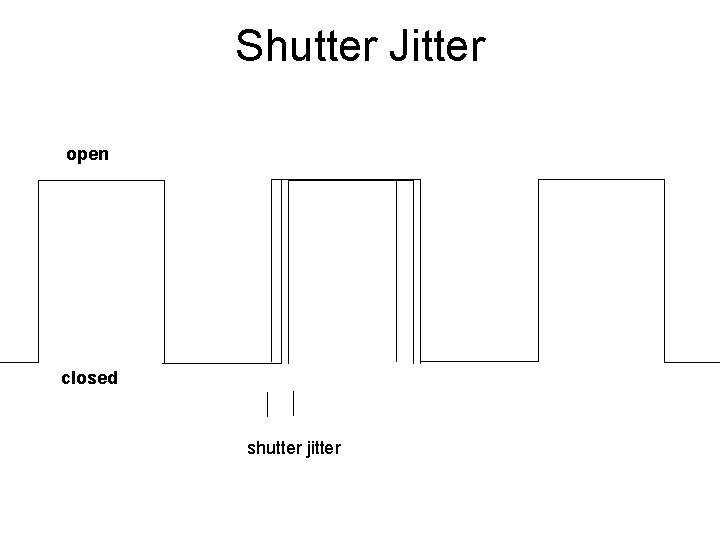
Shutter Jitter open closed shutter jitter
CC to correct model Shutter Jitter rms timing error (% exposure)
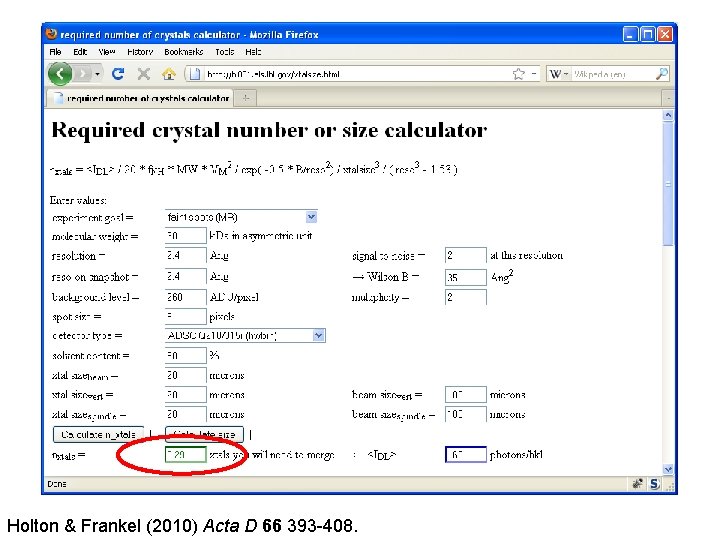
Holton & Frankel (2010) Acta D 66 393 -408.
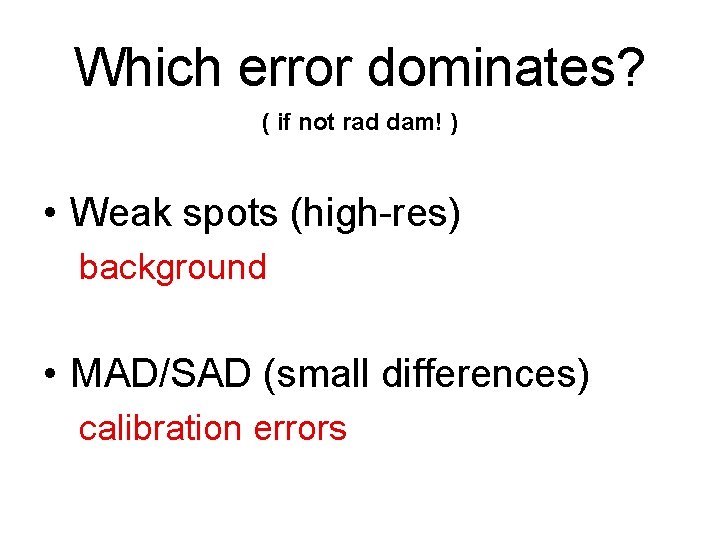
Which error dominates? ( if not rad dam! ) • Weak spots (high-res) background • MAD/SAD (small differences) calibration errors
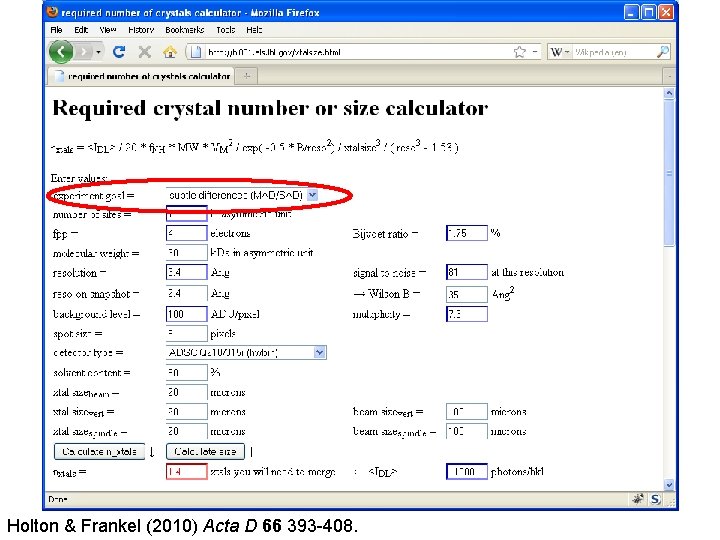
Holton & Frankel (2010) Acta D 66 393 -408.
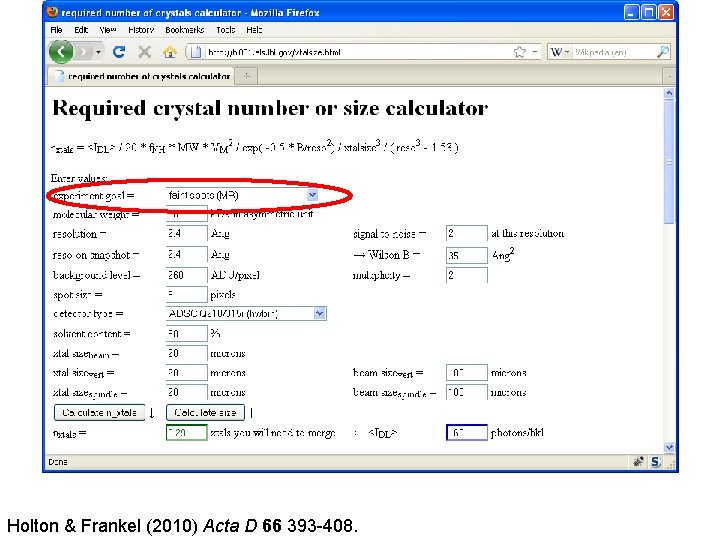
Holton & Frankel (2010) Acta D 66 393 -408.
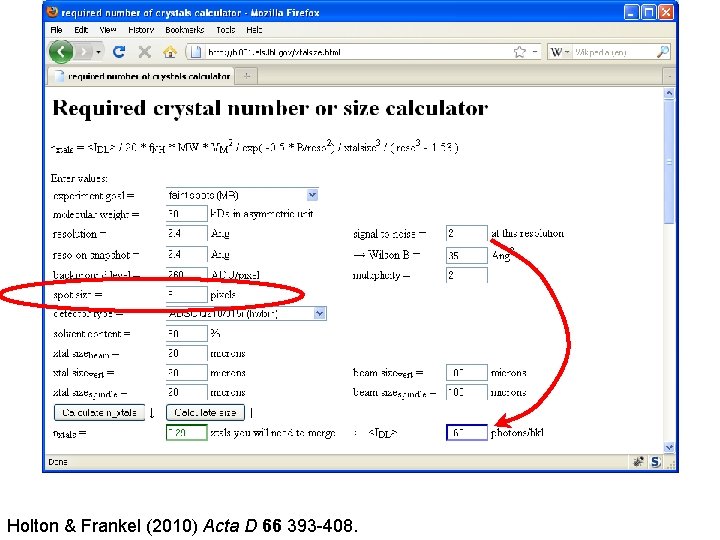
Holton & Frankel (2010) Acta D 66 393 -408.
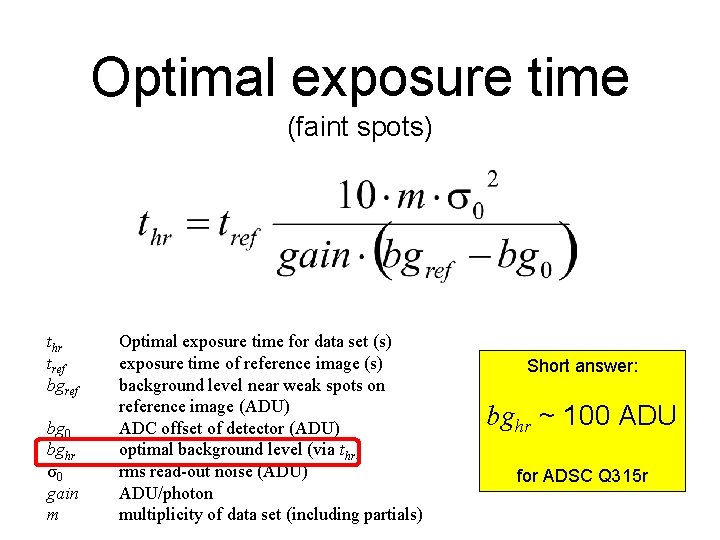
Optimal exposure time (faint spots) thr tref bg 0 bghr σ0 gain m Optimal exposure time for data set (s) exposure time of reference image (s) background level near weak spots on reference image (ADU) ADC offset of detector (ADU) optimal background level (via thr) rms read-out noise (ADU) ADU/photon multiplicity of data set (including partials) Short answer: bghr ~ 100 ADU for ADSC Q 315 r
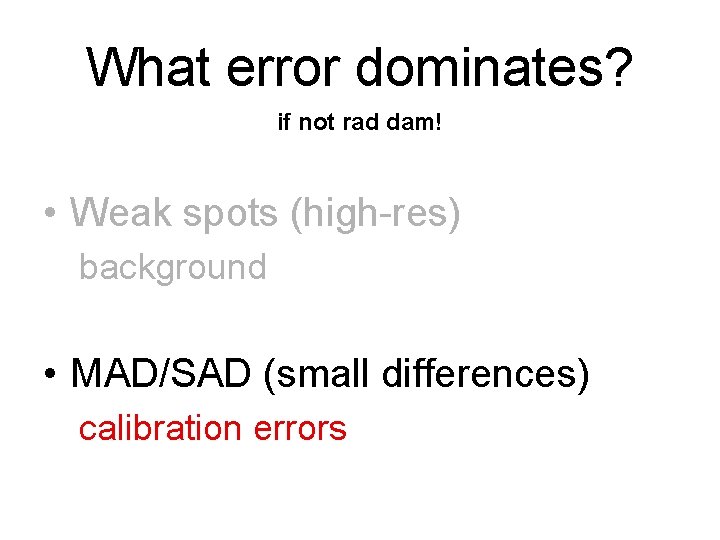
What error dominates? if not rad dam! • Weak spots (high-res) background • MAD/SAD (small differences) calibration errors
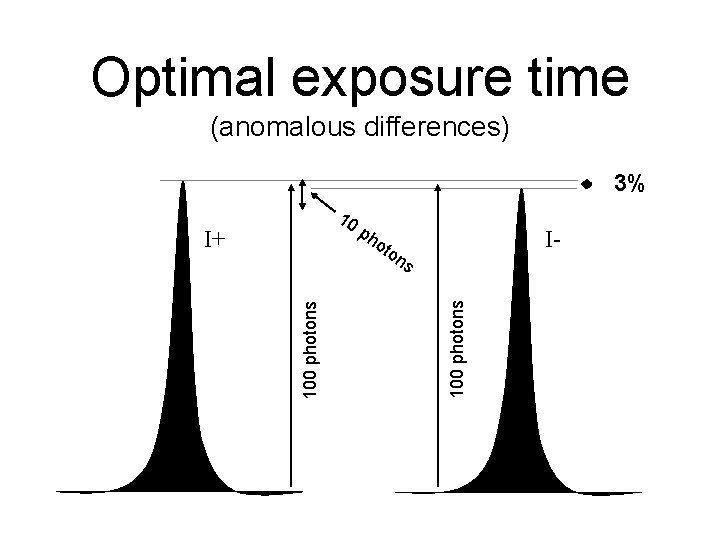
Optimal exposure time (anomalous differences) 3% 10 I+ ph o I- ton 100 photons s
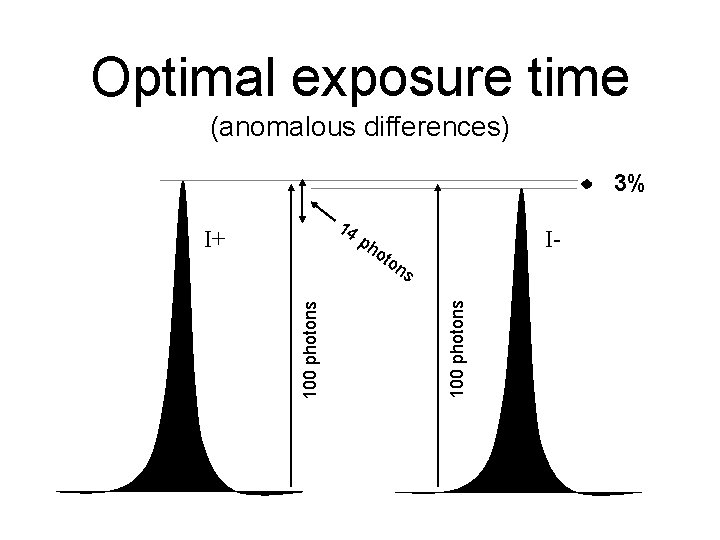
Optimal exposure time (anomalous differences) 3% 14 I+ I- ph o ton 100 photons s
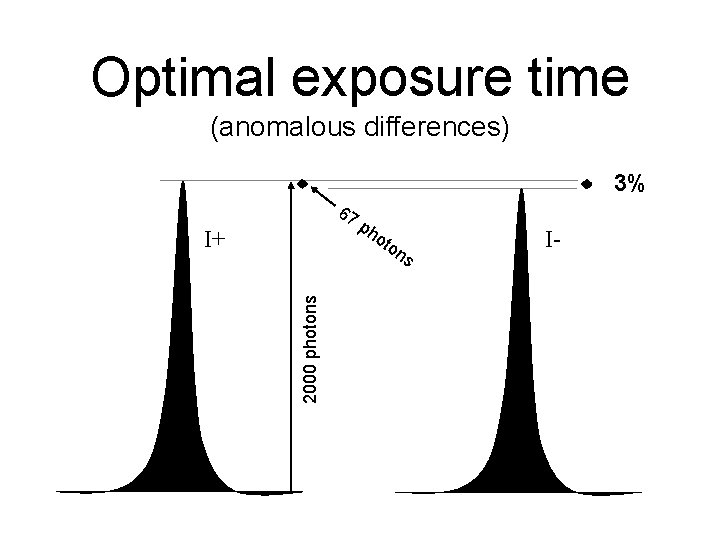
Optimal exposure time (anomalous differences) 3% 67 I+ ph o ton 2000 photons s I-
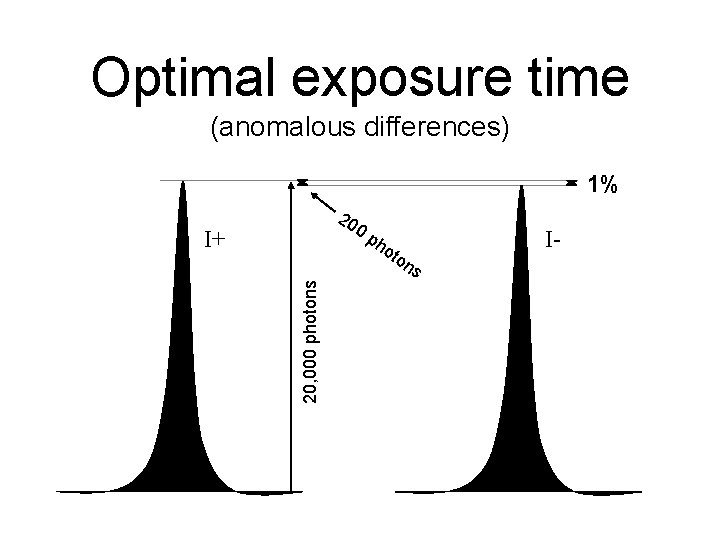
Optimal exposure time (anomalous differences) 1% 20 0 p I+ 20, 000 photons ho ton s I-
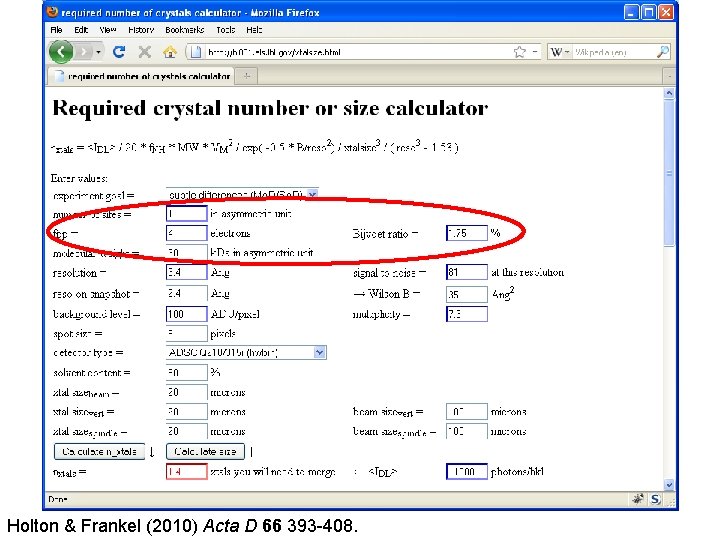
Holton & Frankel (2010) Acta D 66 393 -408.
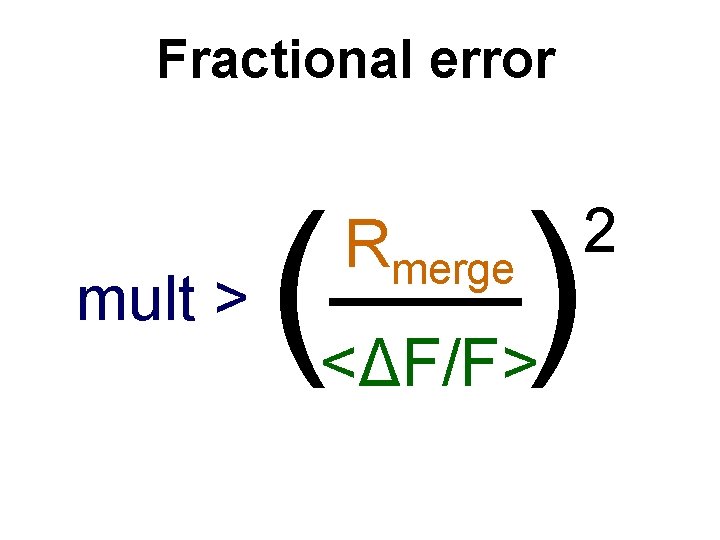
Fractional error mult > (—) Rmerge <ΔF/F> 2
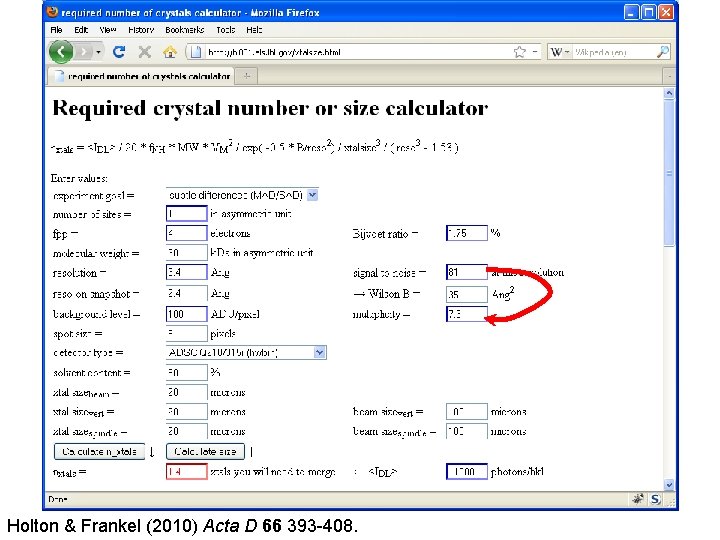
Holton & Frankel (2010) Acta D 66 393 -408.
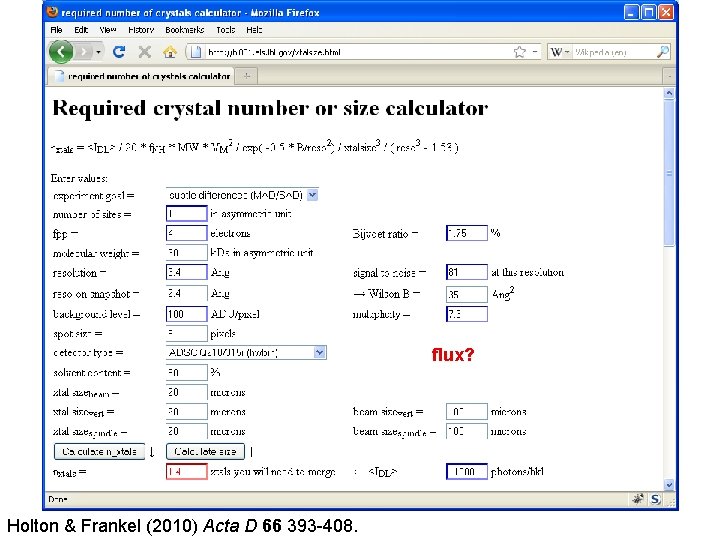
flux? Holton & Frankel (2010) Acta D 66 393 -408.
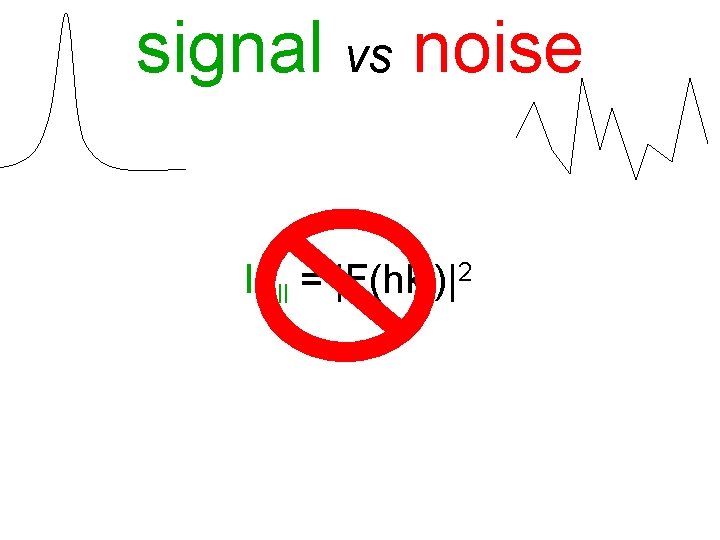
signal vs noise Ifull = |F(hkl)|2
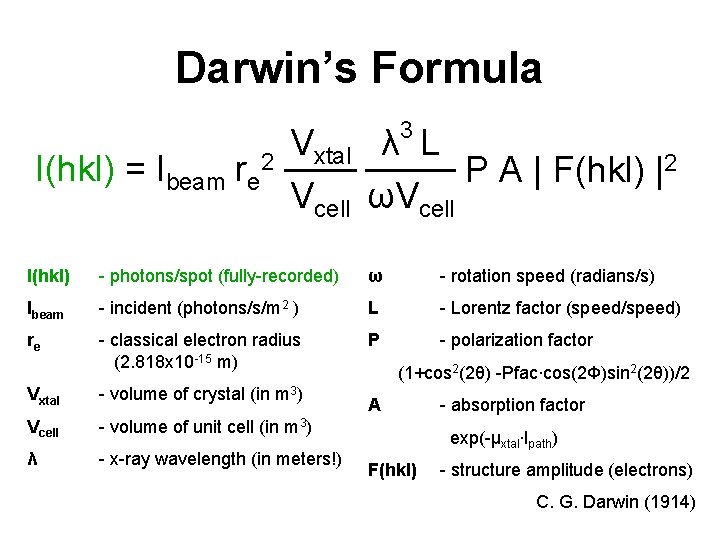
Darwin’s Formula 3 I(hkl) = Ibeam re 2 Vxtal λ L P A | F(hkl) |2 Vcell ωVcell I(hkl) - photons/spot (fully-recorded) ω - rotation speed (radians/s) Ibeam - incident (photons/s/m 2 ) L - Lorentz factor (speed/speed) re - classical electron radius (2. 818 x 10 -15 m) P - polarization factor Vxtal - volume of crystal (in m 3) Vcell - volume of unit cell (in m 3) λ - x-ray wavelength (in meters!) (1+cos 2(2θ) -Pfac∙cos(2Φ)sin 2(2θ))/2 A - absorption factor exp(-μxtal∙lpath) F(hkl) - structure amplitude (electrons) C. G. Darwin (1914)
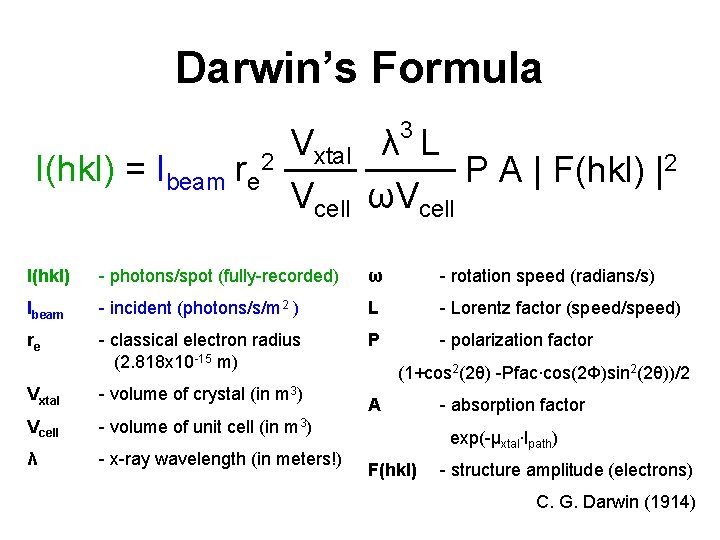
Darwin’s Formula 3 I(hkl) = Ibeam re 2 Vxtal λ L P A | F(hkl) |2 Vcell ωVcell I(hkl) - photons/spot (fully-recorded) ω - rotation speed (radians/s) Ibeam - incident (photons/s/m 2 ) L - Lorentz factor (speed/speed) re - classical electron radius (2. 818 x 10 -15 m) P - polarization factor Vxtal - volume of crystal (in m 3) Vcell - volume of unit cell (in m 3) λ - x-ray wavelength (in meters!) (1+cos 2(2θ) -Pfac∙cos(2Φ)sin 2(2θ))/2 A - absorption factor exp(-μxtal∙lpath) F(hkl) - structure amplitude (electrons) C. G. Darwin (1914)
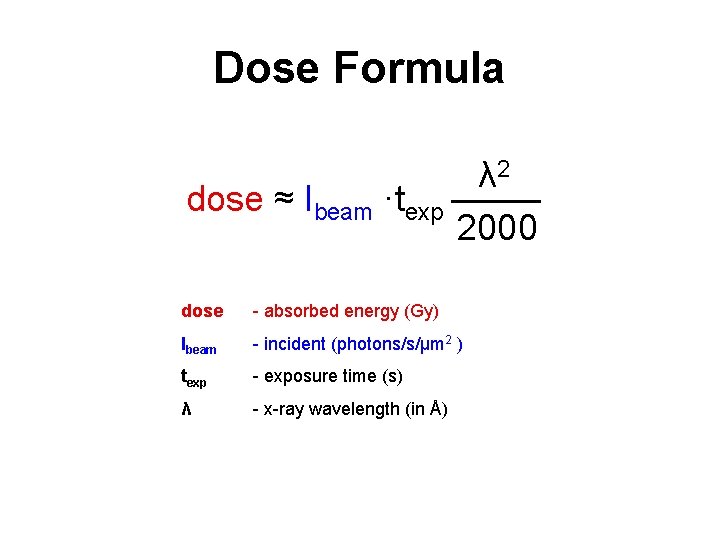
Dose Formula dose ≈ Ibeam ·texp λ 2 2000 dose - absorbed energy (Gy) Ibeam - incident (photons/s/μm 2 ) texp - exposure time (s) λ - x-ray wavelength (in Å)
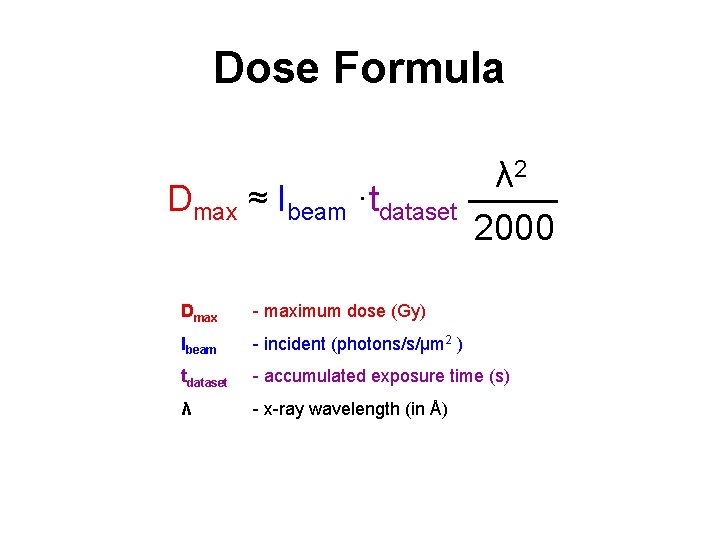
Dose Formula Dmax ≈ Ibeam ·tdataset λ 2 2000 Dmax - maximum dose (Gy) Ibeam - incident (photons/s/μm 2 ) tdataset - accumulated exposure time (s) λ - x-ray wavelength (in Å)
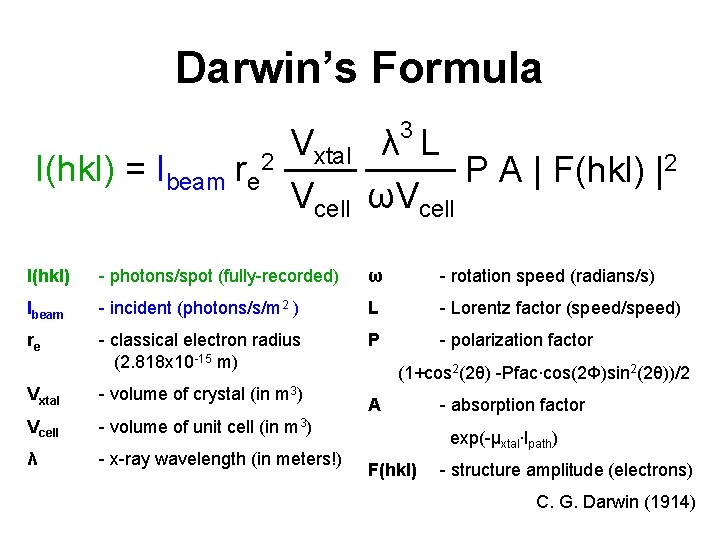
Darwin’s Formula 3 I(hkl) = Ibeam re 2 Vxtal λ L P A | F(hkl) |2 Vcell ωVcell I(hkl) - photons/spot (fully-recorded) ω - rotation speed (radians/s) Ibeam - incident (photons/s/m 2 ) L - Lorentz factor (speed/speed) re - classical electron radius (2. 818 x 10 -15 m) P - polarization factor Vxtal - volume of crystal (in m 3) Vcell - volume of unit cell (in m 3) λ - x-ray wavelength (in meters!) (1+cos 2(2θ) -Pfac∙cos(2Φ)sin 2(2θ))/2 A - absorption factor exp(-μxtal∙lpath) F(hkl) - structure amplitude (electrons) C. G. Darwin (1914)
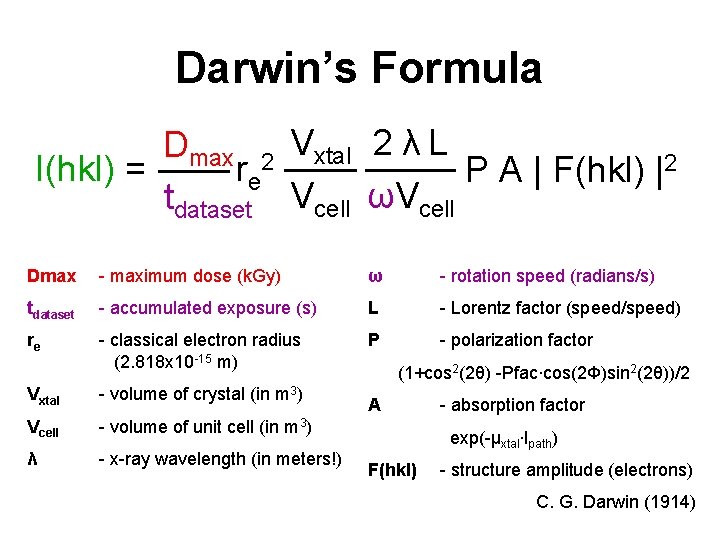
Darwin’s Formula Dmax 2 Vxtal 2 λ L I(hkl) = re P A | F(hkl) |2 tdataset Vcell ωVcell Dmax - maximum dose (k. Gy) ω - rotation speed (radians/s) tdataset - accumulated exposure (s) L - Lorentz factor (speed/speed) re - classical electron radius (2. 818 x 10 -15 m) P - polarization factor Vxtal - volume of crystal (in m 3) Vcell - volume of unit cell (in m 3) λ - x-ray wavelength (in meters!) (1+cos 2(2θ) -Pfac∙cos(2Φ)sin 2(2θ))/2 A - absorption factor exp(-μxtal∙lpath) F(hkl) - structure amplitude (electrons) C. G. Darwin (1914)
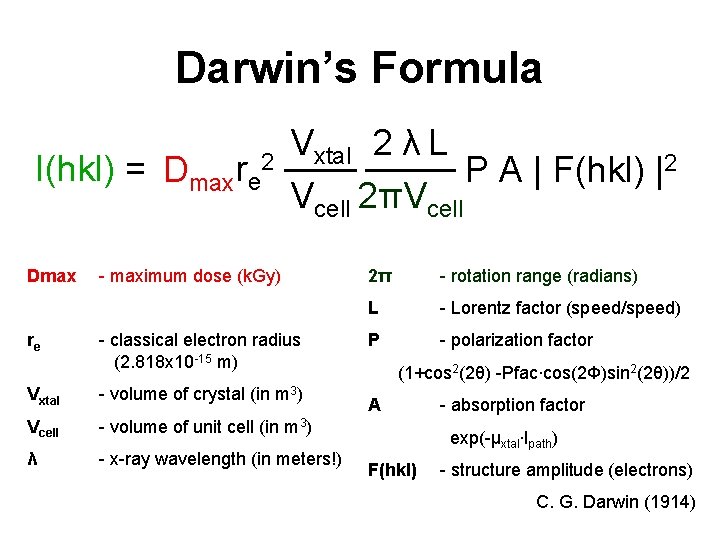
Darwin’s Formula I(hkl) = Dmax re 2 Dmax re Vxtal 2 λ L P A | F(hkl) |2 Vcell 2πVcell - maximum dose (k. Gy) - classical electron radius (2. 818 x 10 -15 m) Vxtal - volume of crystal (in m 3) Vcell - volume of unit cell (in m 3) λ - x-ray wavelength (in meters!) 2π - rotation range (radians) L - Lorentz factor (speed/speed) P - polarization factor (1+cos 2(2θ) -Pfac∙cos(2Φ)sin 2(2θ))/2 A - absorption factor exp(-μxtal∙lpath) F(hkl) - structure amplitude (electrons) C. G. Darwin (1914)
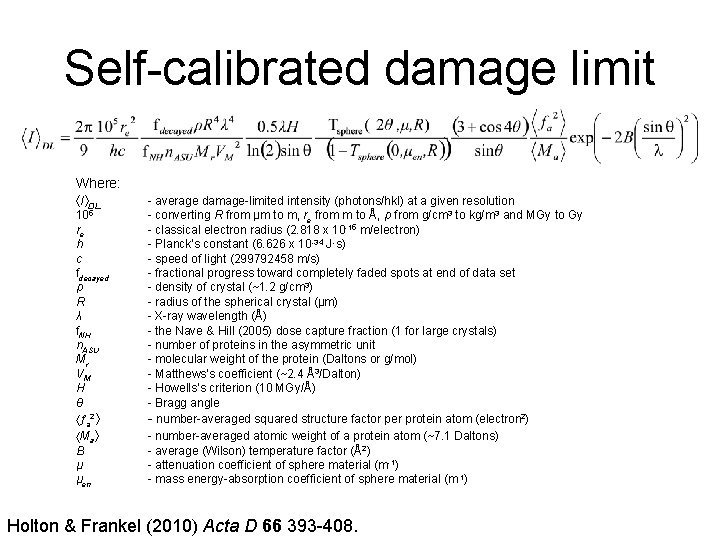
Self-calibrated damage limit Where: I DL 105 re h c fdecayed ρ R λ f. NH n. ASU Mr VM H θ a 2 Ma B μ μen - average damage-limited intensity (photons/hkl) at a given resolution - converting R from μm to m, re from m to Å, ρ from g/cm 3 to kg/m 3 and MGy to Gy - classical electron radius (2. 818 x 10 -15 m/electron) - Planck’s constant (6. 626 x 10 -34 J∙s) - speed of light (299792458 m/s) - fractional progress toward completely faded spots at end of data set - density of crystal (~1. 2 g/cm 3) - radius of the spherical crystal (μm) - X-ray wavelength (Å) - the Nave & Hill (2005) dose capture fraction (1 for large crystals) - number of proteins in the asymmetric unit - molecular weight of the protein (Daltons or g/mol) - Matthews’s coefficient (~2. 4 Å3/Dalton) - Howells’s criterion (10 MGy/Å) - Bragg angle - number-averaged squared structure factor per protein atom (electron 2) - number-averaged atomic weight of a protein atom (~7. 1 Daltons) - average (Wilson) temperature factor (Å2) - attenuation coefficient of sphere material (m-1) - mass energy-absorption coefficient of sphere material (m-1) Holton & Frankel (2010) Acta D 66 393 -408.
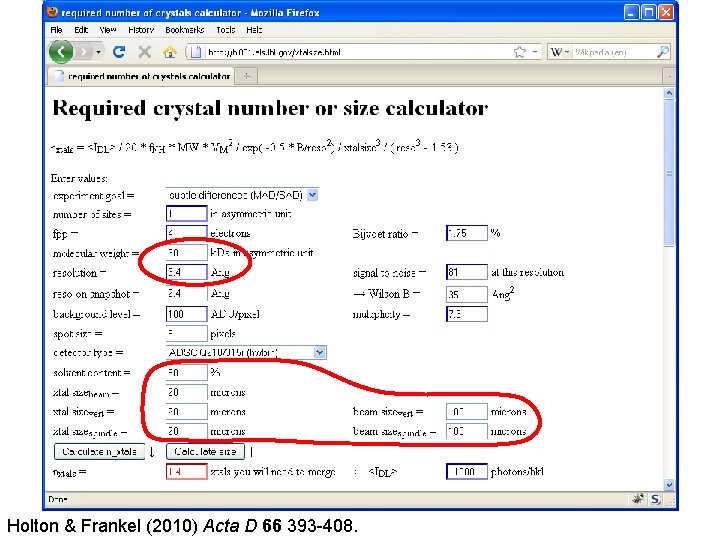
Holton & Frankel (2010) Acta D 66 393 -408.

Observed damage limits MW (k. Da) Resolution (Å) VM (Å3/Da) No. of xtals n 0 reference 62 ? [1] 1. 9 2. 4? 20* 30 13 130 Gonzalez & Nave 1994 14 1. 6 2. 0 22* 35 1 25 Teng & Moffat 2000 28 2. 1 2. 5 30 20 1 12 Glaeser et al. 2000 24 2. 0 2. 5 22 5 x 30 5 9. 8 Facciotti et al. 2003 400 3. 5 2. 5 65* 20 1 9. 3 Sliz et al. 2003 28. 6 1. 98 1. 58 11 5 2 5. 2 Coulibaly et. al. 2007 0. 8 1. 3 1. 5 10 1. 5 x 5 3 3. 7 Nelson et al. 2005 Sawaya et al. 2007 78 2. 65 3. 06 56 16[2]x 5 x 5 4 3. 6 Li et al. 2004 73 3. 4 3. 67 69 5 13 3. 2 Standfuss et al. 2007 21 1. 5 2. 4 11. 4 1 x 1 x 20 90 3. 1 Moukhametzianov et al. 2008 6000 3. 46 3. 4 70 70 17 180 Schuwirth et al. 2005 [1] [2] Wilson Crystal B (Å2) size (μm) Estimated for 100 Å unit cell in P 43212 with VM = 2. 4 Taken from 400 um 3 illuminated volume quoted by Moukhametzianov et al. (2008) and 5 um beam Holton (2009) J. Synchrotron Rad. 16 133 -42.
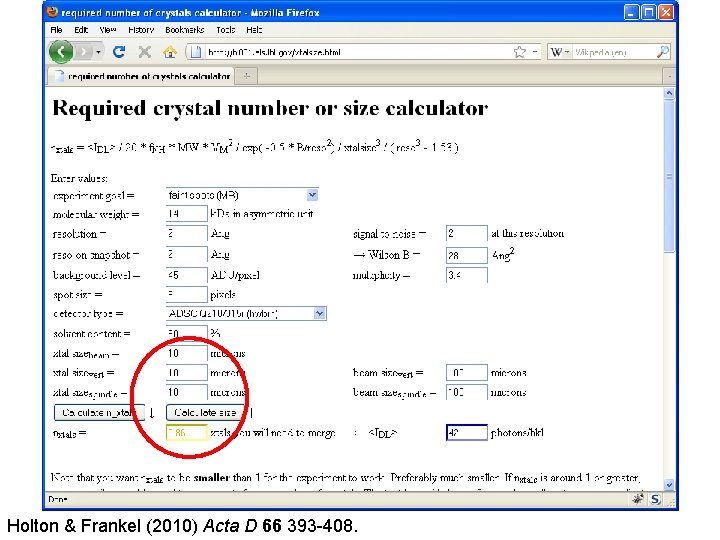
Holton & Frankel (2010) Acta D 66 393 -408.
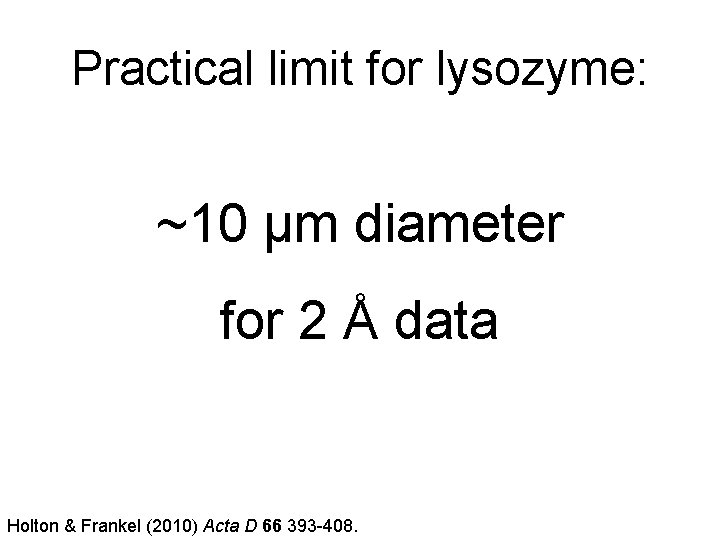
Practical limit for lysozyme: ~10 μm diameter for 2 Å data Holton & Frankel (2010) Acta D 66 393 -408.
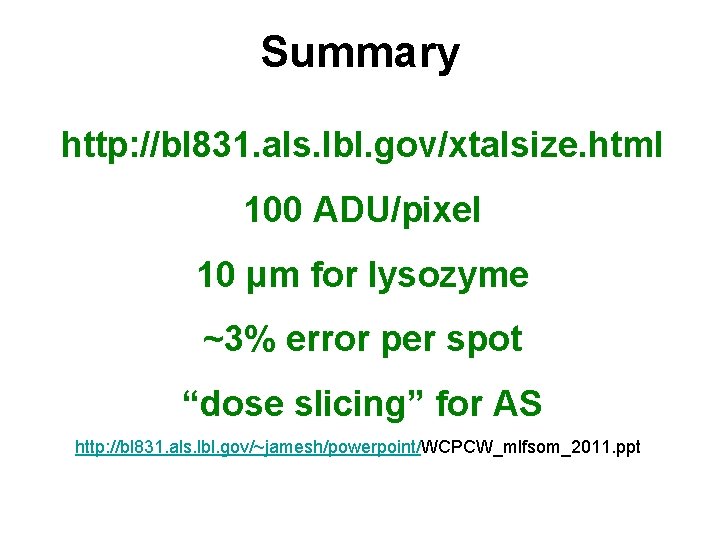
Summary http: //bl 831. als. lbl. gov/xtalsize. html 100 ADU/pixel 10 μm for lysozyme ~3% error per spot “dose slicing” for AS http: //bl 831. als. lbl. gov/~jamesh/powerpoint/WCPCW_mlfsom_2011. ppt
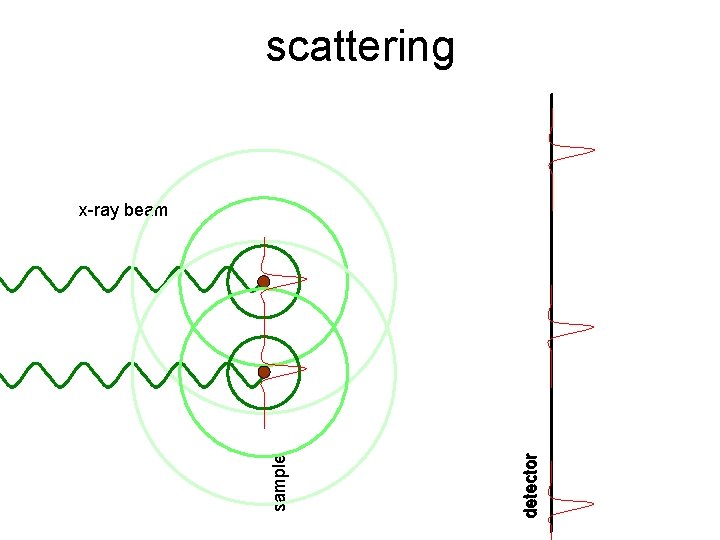
scattering detector sample x-ray beam
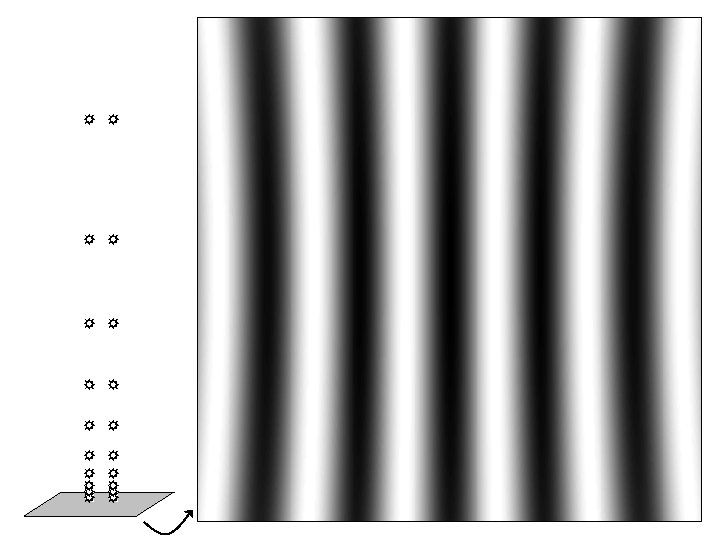
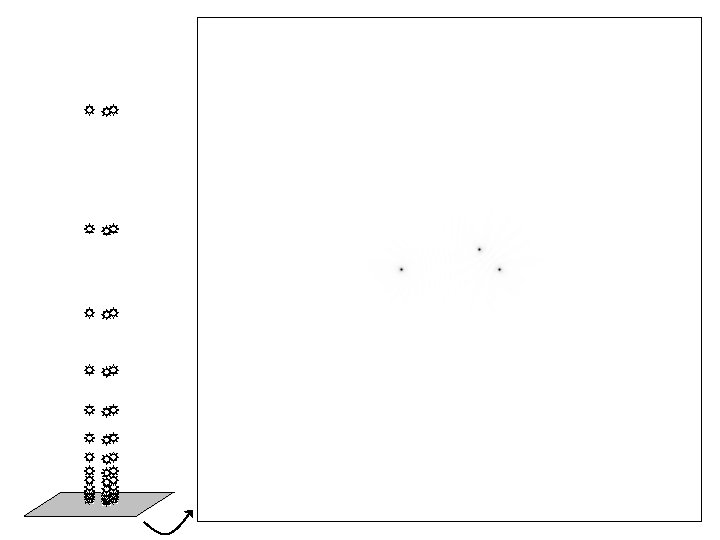
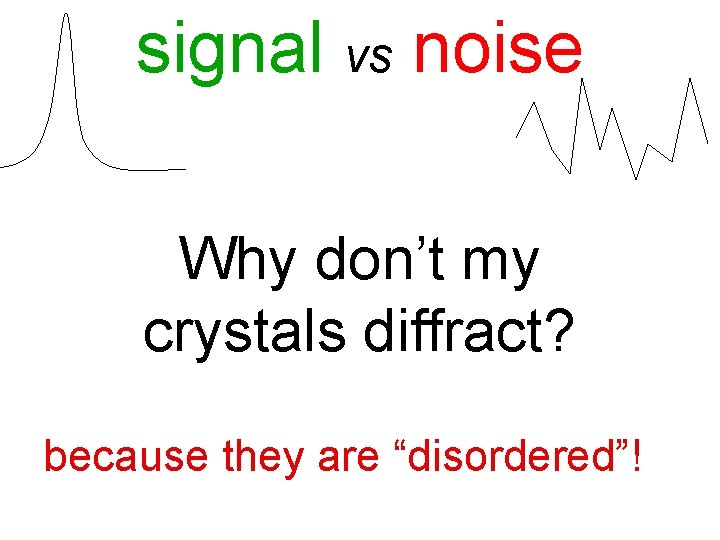
signal vs noise Why don’t my crystals diffract? because they are “disordered”!
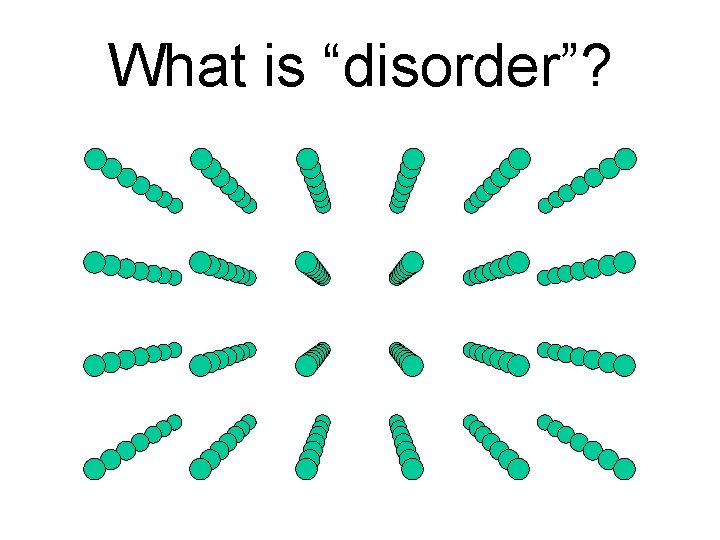
What is “disorder”?
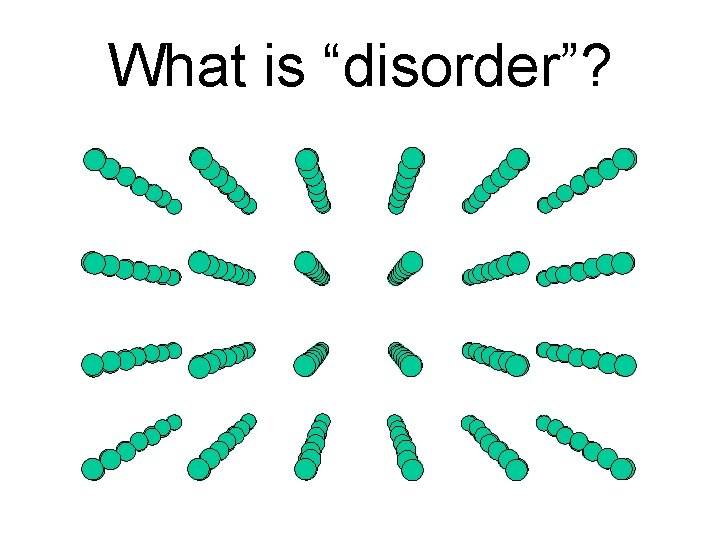
What is “disorder”?
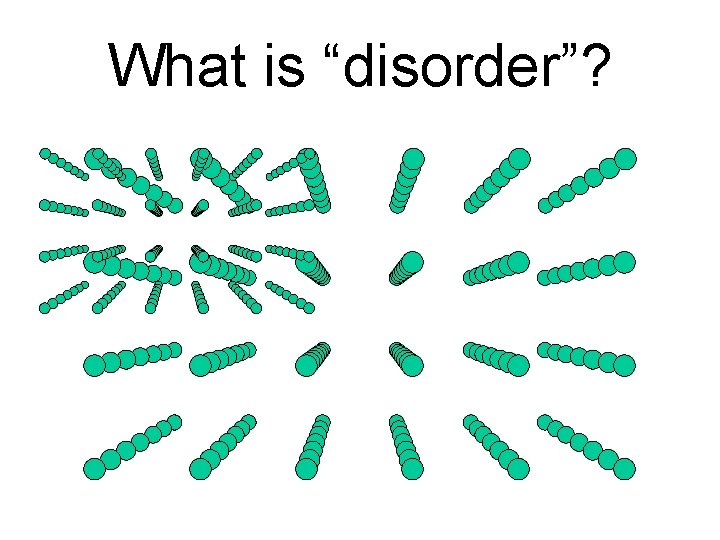
What is “disorder”?
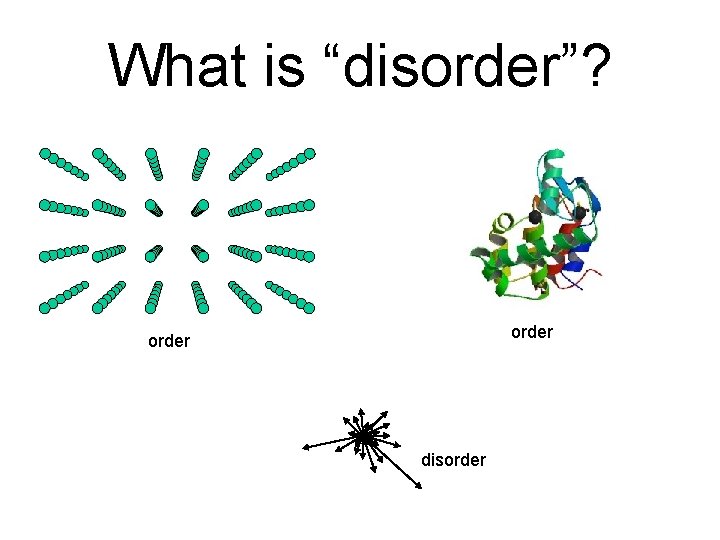
What is “disorder”? order disorder
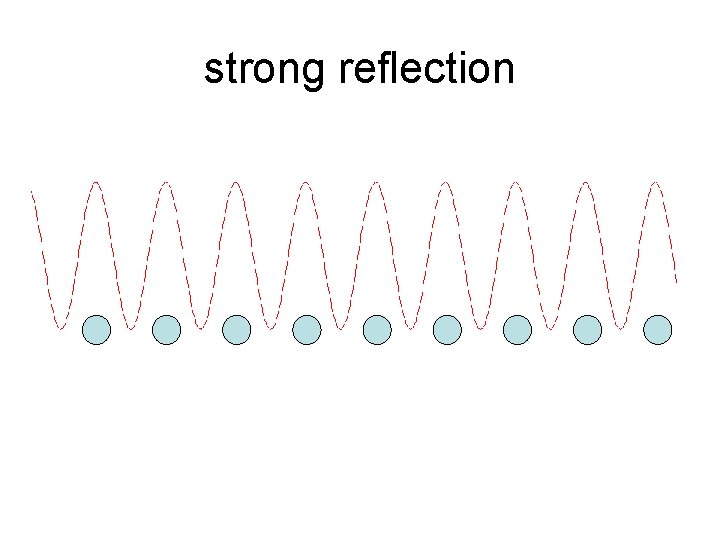
strong reflection
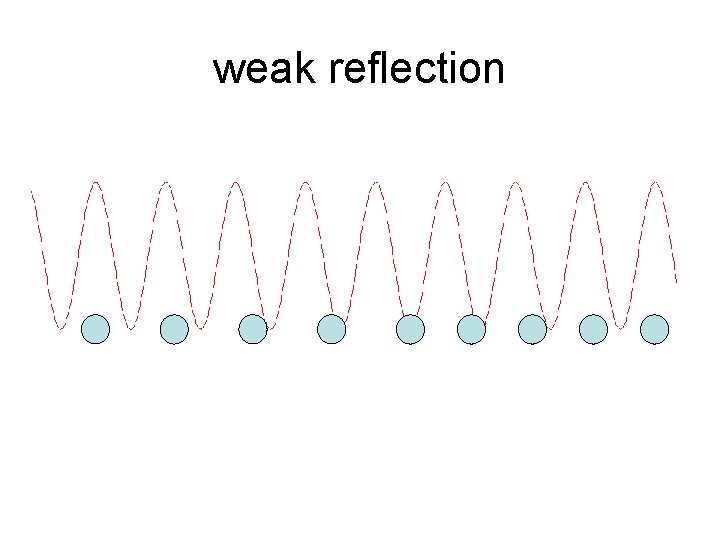
weak reflection
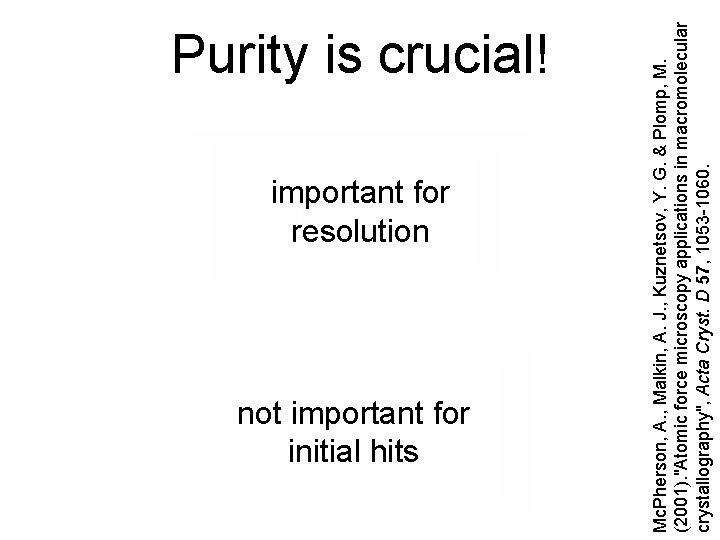
important for resolution not important for initial hits Mc. Pherson, A. , Malkin, A. J. , Kuznetsov, Y. G. & Plomp, M. (2001). "Atomic force microscopy applications in macromolecular crystallography", Acta Cryst. D 57, 1053 -1060. Purity is crucial!
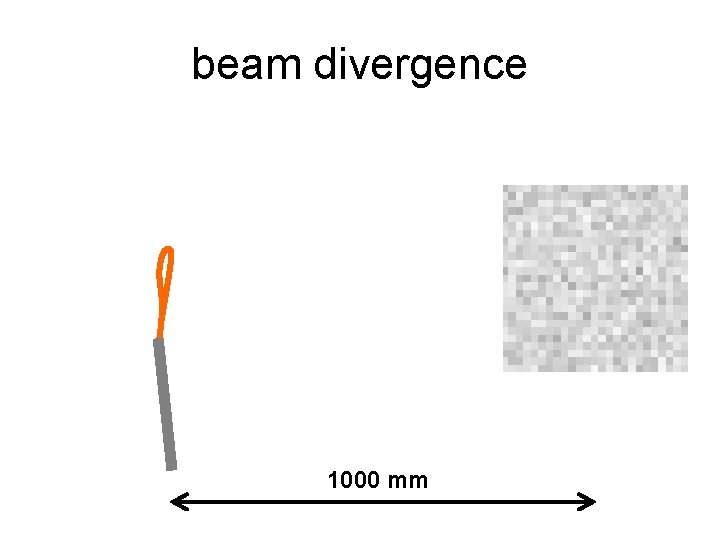
beam divergence 1000 mm
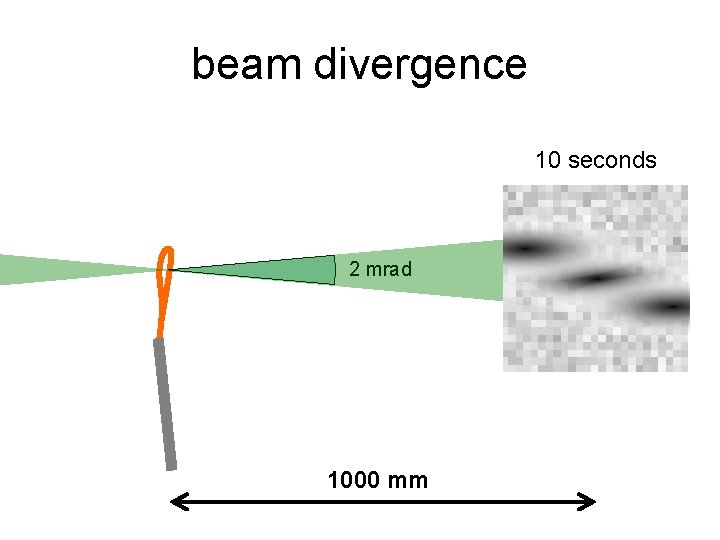
beam divergence 10 seconds 2 mrad 1000 mm
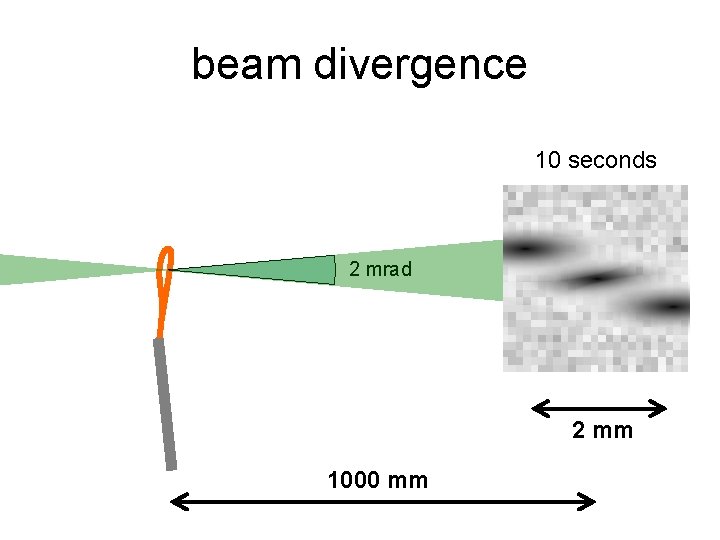
beam divergence 10 seconds 2 mrad 2 mm 1000 mm
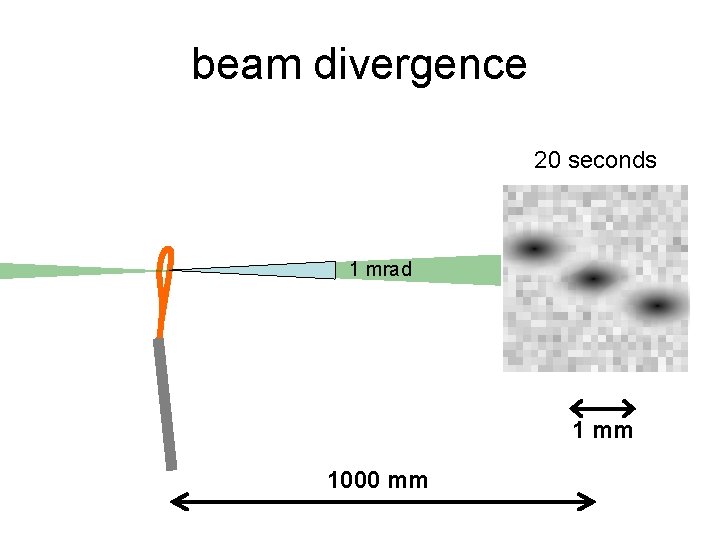
beam divergence 20 seconds 1 mrad 1 mm 1000 mm
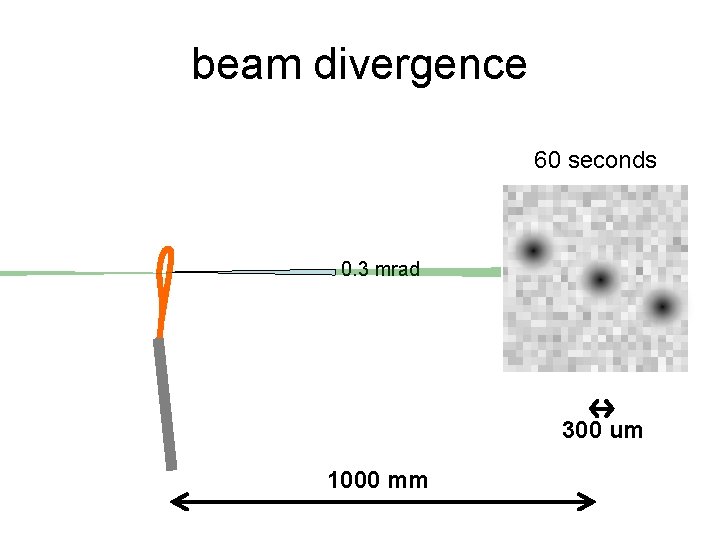
beam divergence 60 seconds 0. 3 mrad 300 um 1000 mm
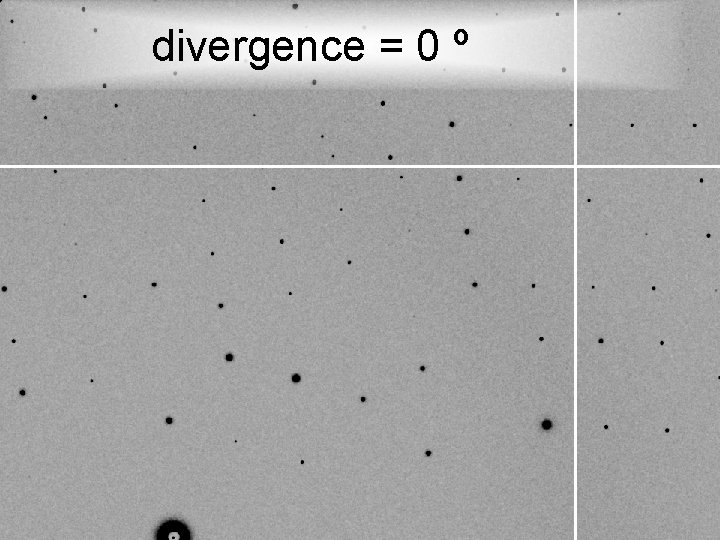
divergence = 0 º
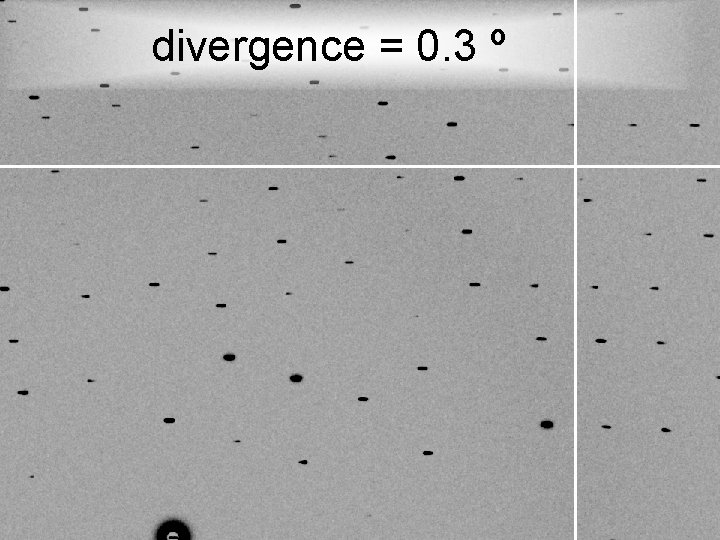
divergence = 0. 3 º
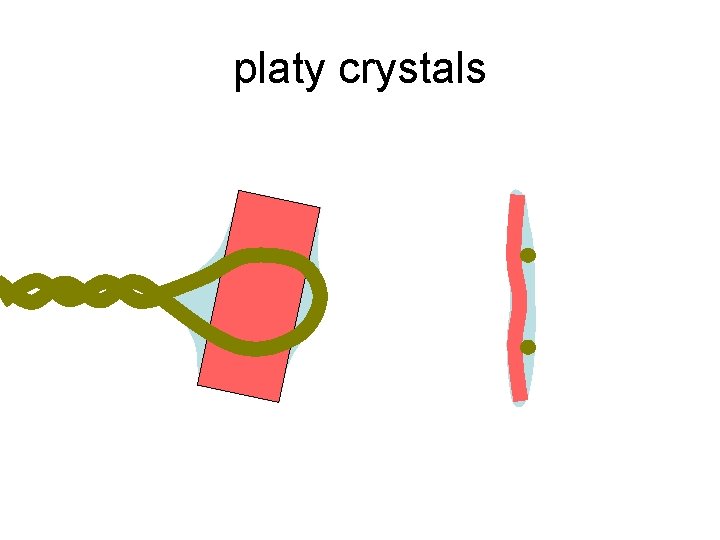
platy crystals
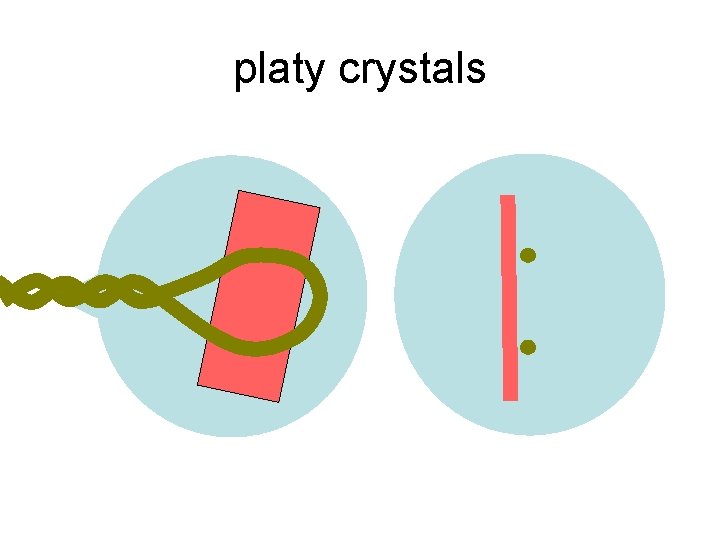
platy crystals
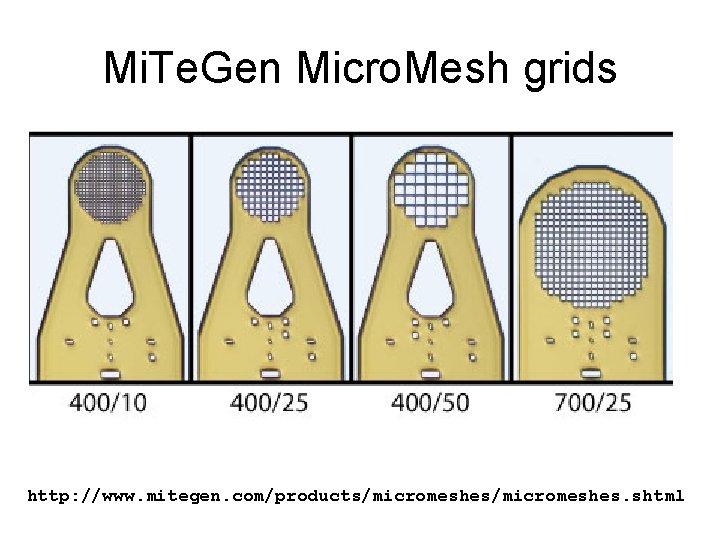
Mi. Te. Gen Micro. Mesh grids http: //www. mitegen. com/products/micromeshes. shtml
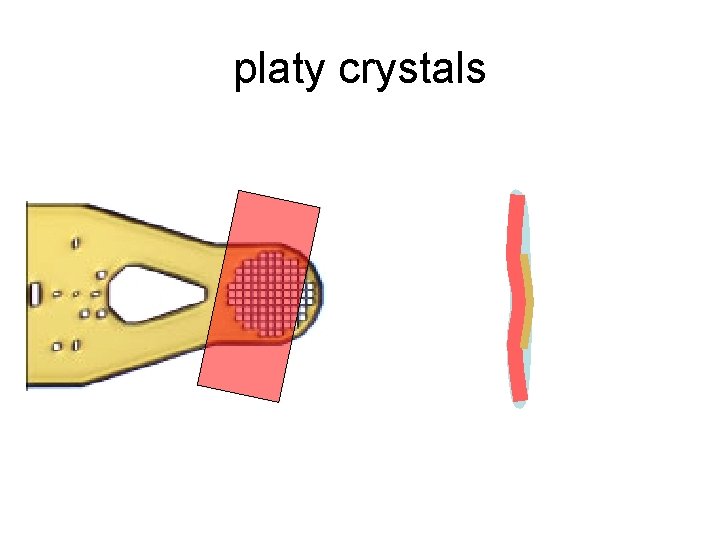
platy crystals
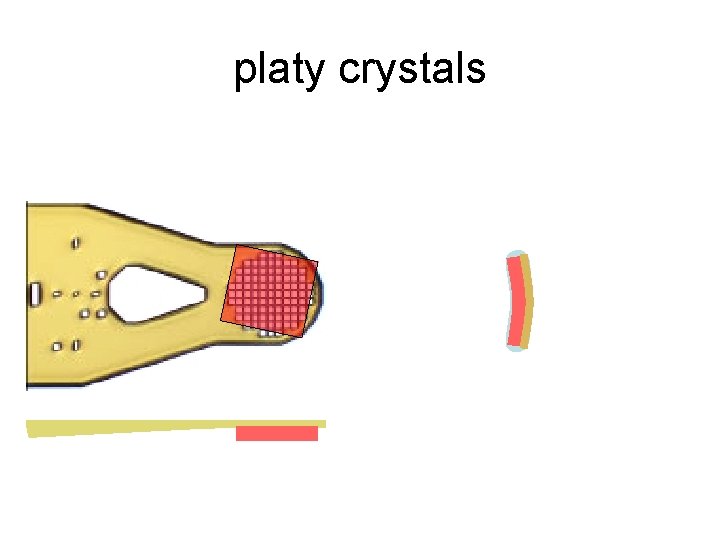
platy crystals
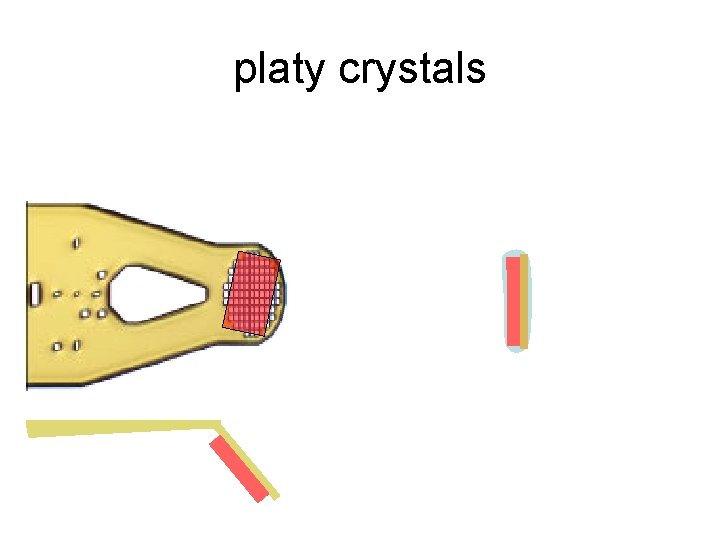
platy crystals
- Slides: 110