RADIOGRAPHIC INTERPRETATION OF INFECTION TRAUMA Diagnostic imaging of


")
")


 Air : -1000 HU Fat : -80")
 Sublingual space (long black arrow), submandibular space (long white arrow), mylohyoid muscle (star),")
 Inset: schematic of coronal plane through the oral cavity. The shaded")
 Coronal CT view at the level of the oral cavity. Sublingual")

 shows a large")
 Axial bone CT shows an endodontically treated (root canal) second molar root")

 and coronal (B) contrast-enhanced CTs demonstrate")
 T 1 image : good anatomical detail")

 Axial contrast-enhanced CT. Calcified sialolith in Wharton's duct at the")
 Contrast-enhanced axial T 1 -weighted MRI of a different patient demonstrating")


- Slides: 56
RADIOGRAPHIC INTERPRETATION OF INFECTION & TRAUMA
Diagnostic imaging of maxillofacial and fascial space infections Anatomical extent of the process Surgically drainable abscesses and fluid collections Demonstrating and assessing associated complications
Plain film examination • • • Periapical X ray Panoramic radiograph : odntogentic infection Anteroposterior and lateral view : cervical soft tissue (airway) submandibular, parapharyngeal, retropharyngeal space (airway compromise)
Periapical X ray
Abscess adjacent to primary tooth
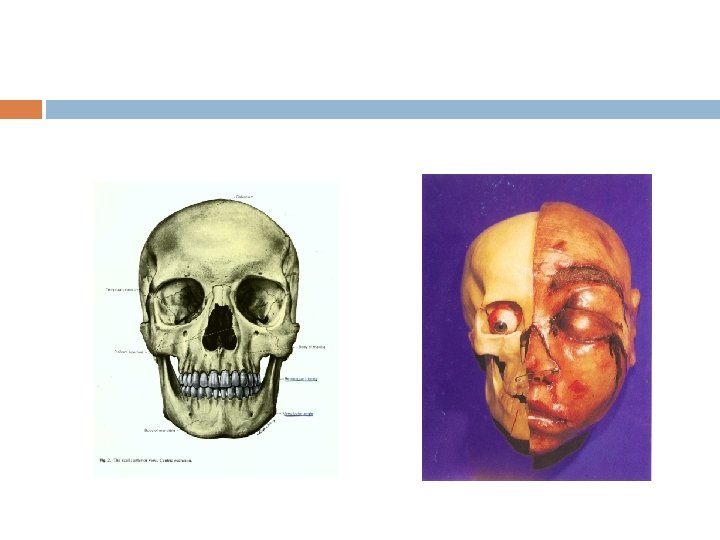
Anatomic location
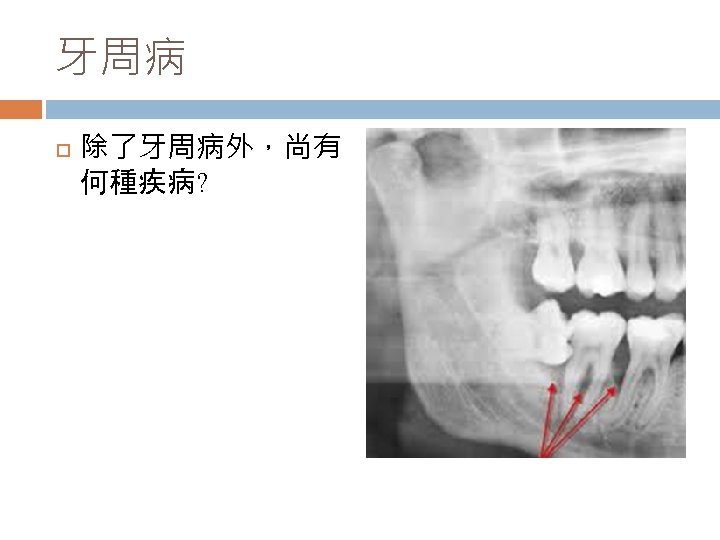
Caries and periapical lesion
pericoronitis
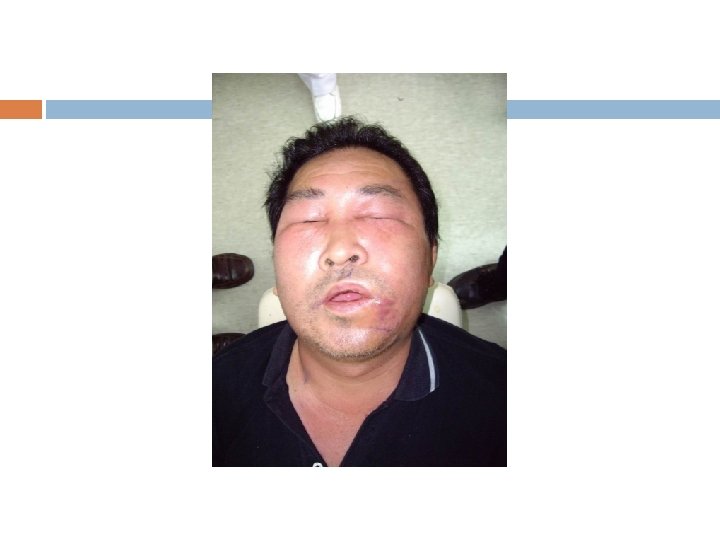
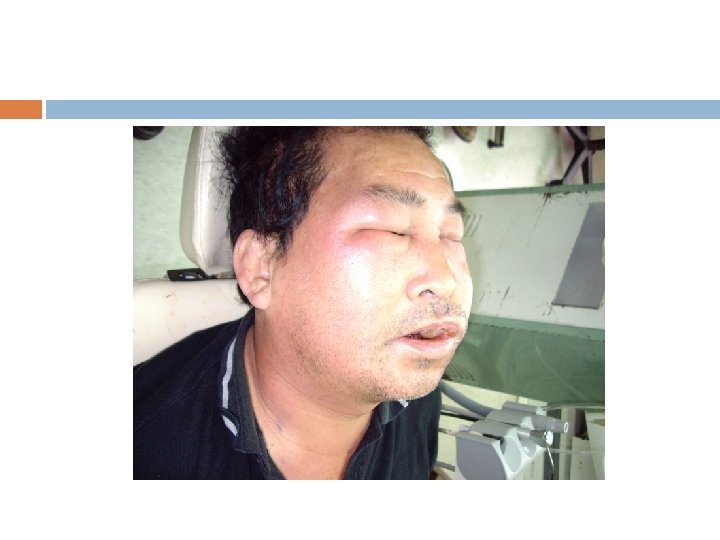
Preoperative clinical aspects. Proptotic left globe, periorbital swelling preventing spontaneous opening of the eye, subconjunctival ecchymosis, and impairment of ocular motility to the right side
CT scan in axial view. Maxillary sinus filled with pus. Close relationship between upper molar root apexes and maxillary sinus (C). Intraoral view of residual root of tooth #26 affected by extensive carious lesion (D).
Sinusitis Upper molars
Sinusitis (water’s view)
Prevertebral Space Infection(lateral view)
X-ray neck P. A. View : Showing severe acute deviation of trachea to Rt. side
Computed tomograph 3 -dimensional picture Gray scales : more negative --- black more positive --- white CT readily assess the integrity of cortical bone Short time required for CT examination Relative low cost compared to MRI
Computed tomograph CT numbers : Hounsfield units(HU) Air : -1000 HU Fat : -80 to -100 HU Water : 0 HU Blood : 60 to 110 HU Bone : 1000 HU
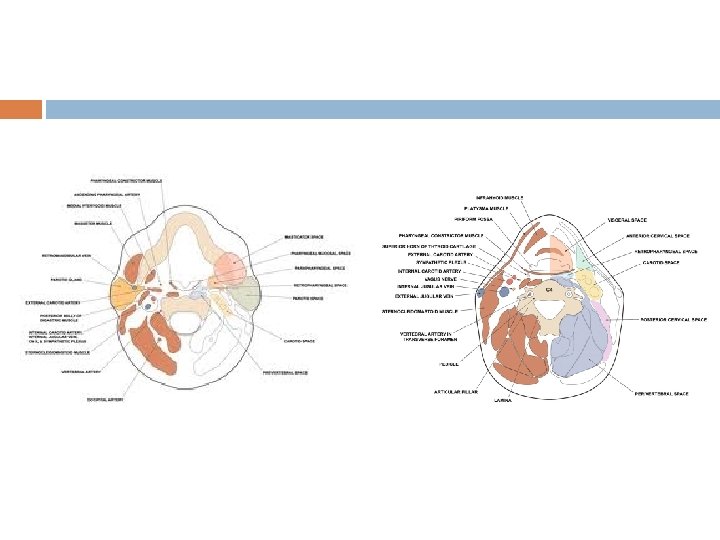
(A) Sublingual space (long black arrow), submandibular space (long white arrow), mylohyoid muscle (star), hyoglossus muscle (black arrowhead). The root of the tongue is identified by the genioglossus (black circle) and the lingual septum (white arrowhead). The lateral boundary of the submandibular space is formed by the fascial layers on the medial margin of the platysma muscle (dashed white arrow). •
• (C) Inset: schematic of coronal plane through the oral cavity. The shaded purple area illustrates the horseshoe shaped configuration of the submandibular space and the bilateral continuity of the space ventral to the mylohyoid anterior belly of the digastric muscles.
• (B) Coronal CT view at the level of the oral cavity. Sublingual space (long black arrow), submandibular space (long white arrow), mylohyoid muscle (star), genioglossus (black circle), and the lingual septum (white arrowhead), platysma muscle (dashed white arrow), buccinator muscle (curved arrow).
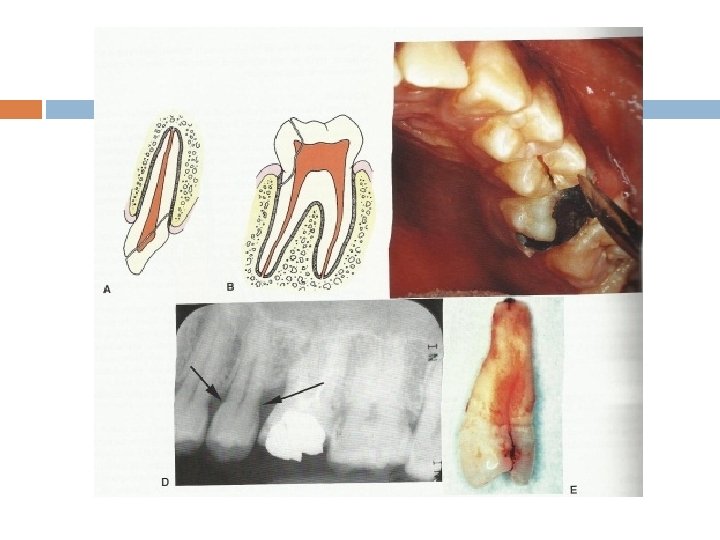
• Schematic diagram of the relationship of the tooth roots to the sublingual, submandibular, and buccal spaces. Infection extending through the lingual cortex from premolar and molar teeth will involve the sublingual space, whereas infection from molar teeth will involve the submandibular space.
• Submandibular space abscess or phlegmon. Axial contrast-enhanced CT (A) shows a large fluid collection within the right submandibular space (arrow), with thickening of the buccinator muscle on the lateral aspect of the mandible and stranding in the subcutaneous tissues representing myositis and cellulits respectively.
(B) Axial bone CT shows an endodontically treated (root canal) second molar root with apical periodontitis (C).
Ludwigs angina
Ludwigs angina • Acute respiratory distress. Axial (A) and coronal (B) contrast-enhanced CTs demonstrate extensive edema and soft tissue thickening of the tongue, sublingual, and submandibular space seen clinically as angioedema, cellulitis, and hematoma. A calcification lies within the genioglossus muscle (arrow), representing either a foreign body or displaced sialolith and is the likely initiating factor.
Magnetic resonance imaging 3 D (以往CT只有2 D) T 1 image : good anatomical detail T 2 image : very sensitive in detecting disease processes T 1 : fat, highly proteinaceous tissue T 2 : water content
MRI
Sialolithiasis • Sialolithiasis. (A) Axial contrast-enhanced CT. Calcified sialolith in Wharton's duct at the junction of the superficial lobe with the deep lobe of the submandibular gland. (B) Axial contrastenhanced CT from the same patient in A. The black arrow points to a thickened and enhancing wall of the dilated submandibular duct. .
Sialolithiasis • (C) Contrast-enhanced axial T 1 -weighted MRI of a different patient demonstrating a calcified sialolith in left Wharton's duct (arrow). (D) Axial T 2 weighted MRI of the same patient in C showing the sialolith with surrounding fluid (arrow). The actual size of this stone was approximately 20% smaller than measured on the MRIs. Size inaccuracies for sialoliths generally would only affect sialoendoscopic or interventional retrieval or lithotripsy.
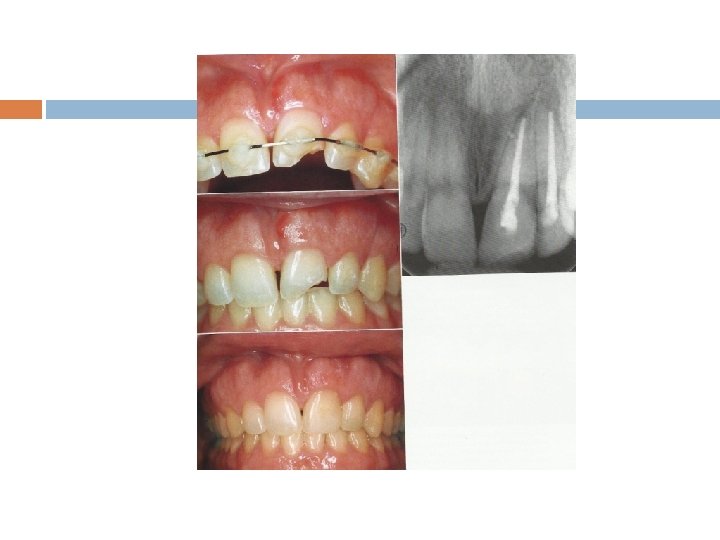
Radiographic interpretation trauma
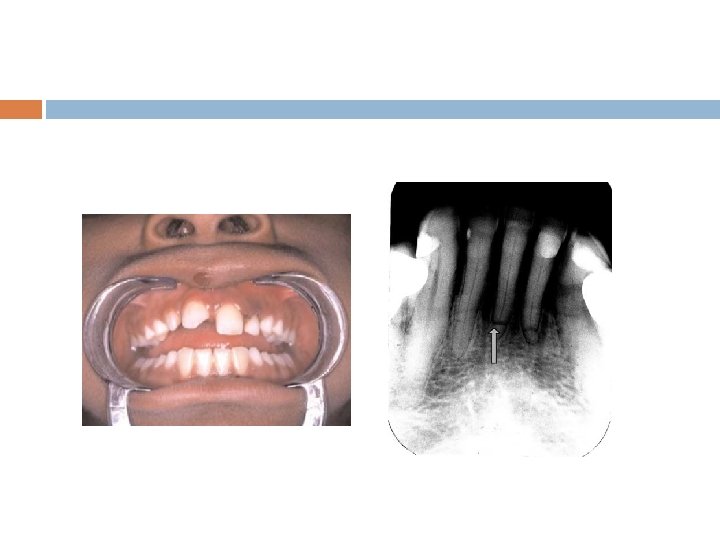
Radiographic examination Presence of root fracture Degree of extrusion or intrusion Presence of preexisting periapical disease Extent of root development Size of the pulp chamber and root canal Presence of jaw fractures Tooth fragments and foreign bodies lodged in soft tissue
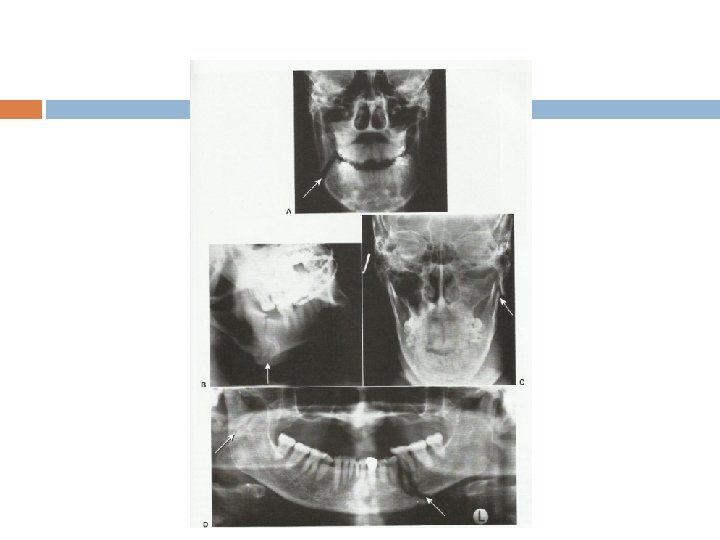
有幾處有 Fracture lines
Anatomic distribution of mandibular fracture
Maxillary fracture Infraorbital fracture Lateral wall fracture
Waters view
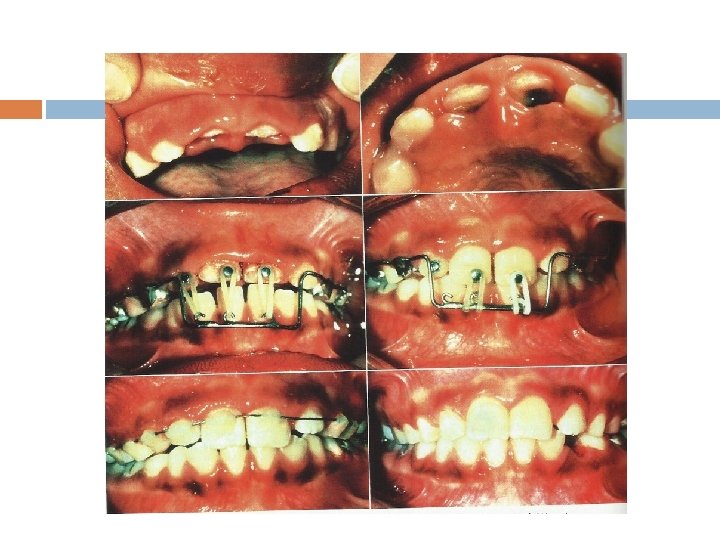
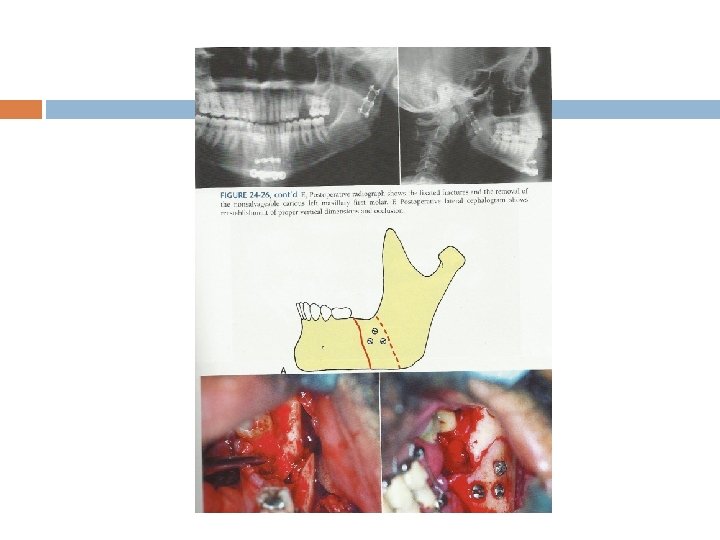
Peri-oral soft tissue avulsion and
Maxillary fractures, comminuted mandibular ramus/body fractures and bilateral condyle fractures.
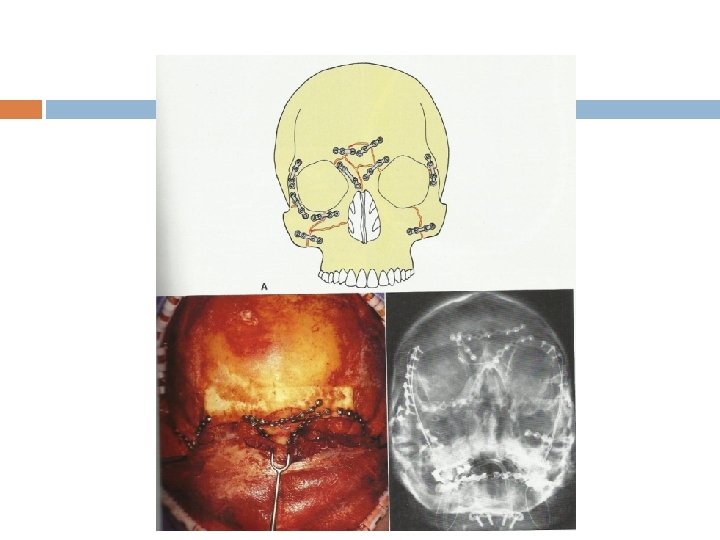
Le Fort midfacial fractures
3 -D CT reconstruction showing a Le Fort type 1 fracture
Le. Fort Fracture II
Le. Fort Fracture III
Zygomatic complex fracture
Zygomaticomaxillary arch Fracture
Submental-vertex view
The End