PCR quantitation What is RealTime PCR RealTime PCR


 • cheap SYBRgreen How do")


![E = 10 [– 1/slope]](https://slidetodoc.com/presentation_image_h2/60624f6c3de2b28da7b307c7a9f87d8d/image-49.jpg "E = 10 [– 1/slope]")

 E = (10^(-1/slope)-1)*100 Ex. slope = -3, 81 efficency= (10^(-1/-3. 81)-1)*100")


![ΔΔCt method experiment control -[(Cttg-Ctcg)-(Cttg-Ctcg)] 2 Ex! D Ct = target gene– ref gene](https://slidetodoc.com/presentation_image_h2/60624f6c3de2b28da7b307c7a9f87d8d/image-62.jpg "ΔΔCt method experiment control -[(Cttg-Ctcg)-(Cttg-Ctcg)] 2 Ex! D Ct = target gene– ref gene")


 Endogenous control Gene of interest • Small")
 Too much variation in")


 Endogenous control Gene of interest • Small")
 Too much variation in")
- Slides: 82
PCR quantitation
What is Real-Time PCR? Real-Time PCR is a specialized technique that allows a PCR reaction to be visualized “in real time” as the reaction progresses. This enables researchers to quantify the amount of DNA in the sample at the start of the reaction!
What is Real-Time PCR? Differences with normal PCR? • 20 ul PCR reactions • SYBR Green or probes § § 94°C 4 min 94°C 15 sec 40 x 61°C 30 sec 72°C 30 sec
What is Real-Time PCR used for? Real-Time PCR has become a cornerstone of molecular biology: • Gene expression analysis – Medical research (SNP, tumor and normal, signaling pathway) – Drug research • Disease diagnosis – Viral quantification • Food testing – Percent GMO food • Transgenic research – Gene copy number
What is Real-Time PCR? Taq polymerase can only synthesize DNA, so how do we study gene expression (RNA) using q. PCR? Reverse transcription RNA -> DNA (c. DNA)
What’s Wrong With Agarose Gels? Low sensitivity § Low resolution § Non-automated § Size-based discrimination only § Results are not expressed as numbers based on personal evaluation § Ethidium bromide staining is not very quantitative § End point analysis §
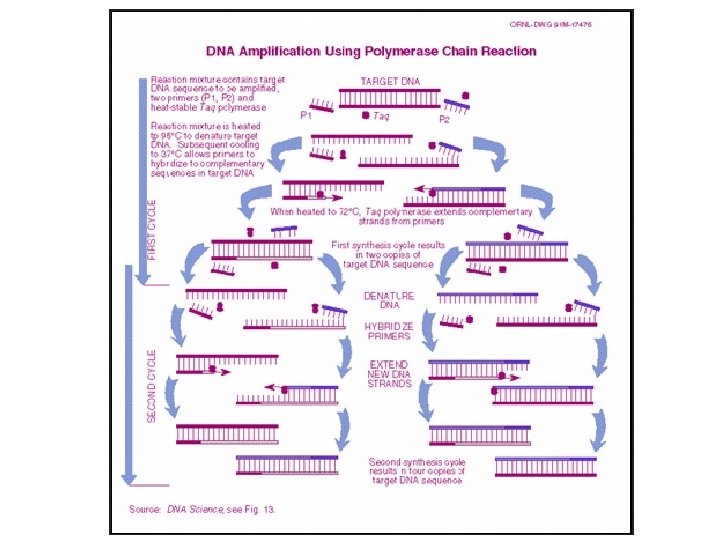
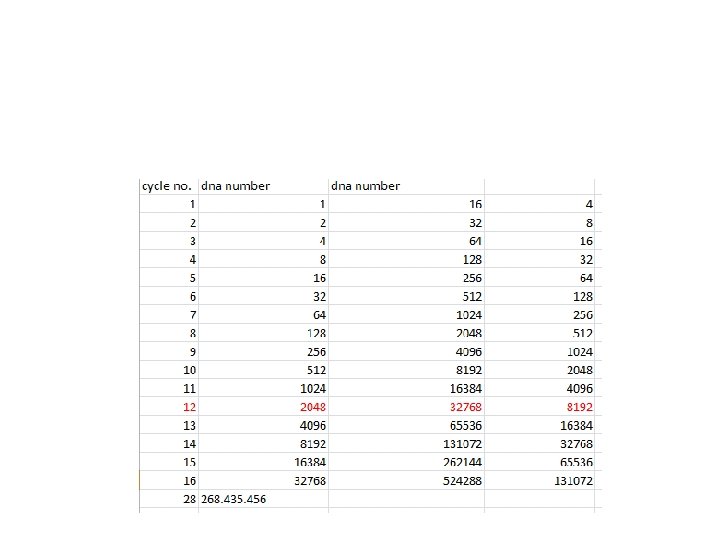
PCR The amount of DNA doubles after each cycle Assuming 100% efficient PCR reactions After n cycles there will be 2 n times as much DNA
Gel base detection
Reporter in q. PCR
Reporter in q. PCR
Reporter in q. PCR
PCR The amount of DNA doubles after each cycle Assuming 100% efficient PCR reactions After n cycles there will be 2 n times as much DNA
16
Plot of real time pcr
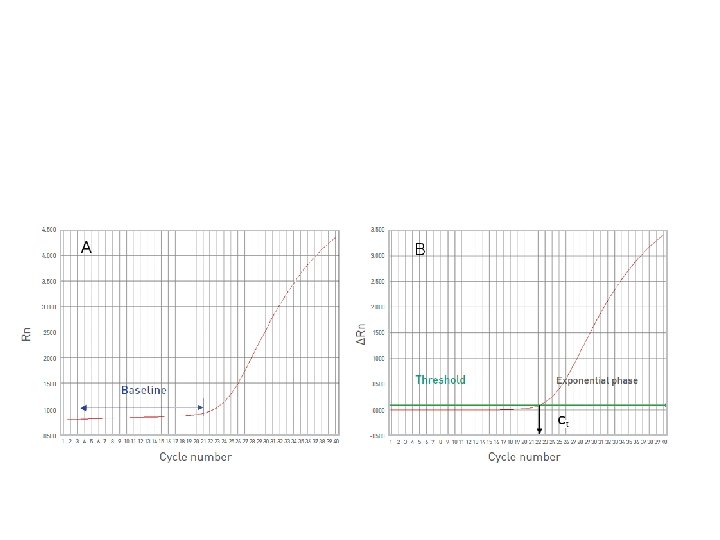
• Rn: Normalized reporter is the ratio of the fluorescence emission intensity of the reporter dye to the fluorescence emission intensity of the passive reference dye • ΔRn is the normalization of Rn obtained by subtracting the baseline: (ΔRn = Rn –baseline).
20
Linear ~20 to ~1500 21
Linear ~20 to ~1500 Fluorescent Units PCR baseline subtracted RFU Arithmetic scale Same region as log scale Cycle number
threshold = 300 23
Amplification curve: log view Plateau Linear Exponential Always use during analysis Amplification curve: linear view
Endpoint analysis Different concentrations give similar endpoint results!
Imagining Real-Time PCR …So that’s how PCR is usually presented. To understand real-time PCR, let’s imagine ourselves in a PCR reaction tube at cycle number 25…
Imagining Real-Time PCR What’s in our tube, at cycle number 25? A soup of nucleotides, primers, template, amplicons, enzyme, etc. ~1, 000 copies of the amplicon right now.
Imagining Real-Time PCR How did we get here? What was it like last cycle, 24? Almost exactly the same, except there were only 500, 000 copies of the amplicon. And the cycle before that, 23? Almost the same, but only 250, 000 copies of the amplicon. And what about cycle 22? Not a whole lot different. 125, 000 copies of the amplicon.
Imagining Real-Time PCR How did we get here? If we were to graph the amount of DNA in our tube, from the start until right now, at cycle 25, the graph would look like this:
Imagining Real-Time PCR So where are we going? What’s it going to be like after the next cycle, in cycle 26? Probably there will be 2, 000 amplicons. And cycle 27? Maybe 4, 000 amplicons. And at cycle 200? In theory, there would be 1, 000, 000, 000, 000, 000, 000 amplicons… ?
Imagining Real-Time PCR If we plot the amount of DNA in our tube going forward from cycle 25, we see that it actually looks like this: So where are we going? • • Realistically, at the chain reaction progresses, it gets exponentially harder to find primers, and nucleotides. And the polymerase is wearing out. So exponential growth does not go on forever!
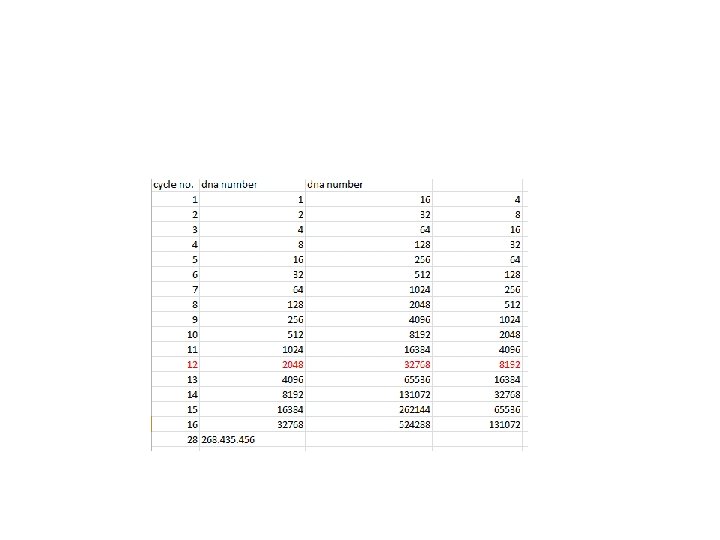
Imagining Real-Time PCR Measuring Quantities How can all this be used to measure DNA quantities? ? What if YOU started with FOUR times as much DNA template as I did? I have 1, 000 copies at cycle 25. You have 4, 000 copies! So… You had 2, 000 copies at cycle 24. And… You had 1, 000 copies at cycle 23.
Imagining Real-Time PCR Measuring Quantities So… if YOU started with FOUR times as much DNA template as I did… Then you’d reach 1, 000 copies exactly TWO cycles earlier than I would!
Imagining Real-Time PCR Measuring Quantities What if YOU started with EIGHT times LESS DNA template than I did? You’d only have 125, 000 copies right now at cycle 25… …and you’ll have 250, 000 at 26, 500, 000 at 27, and by cycle 28 you’ll have caught up with 1, 000 copies! So… you’d reach 1, 000 copies exactly THREE cycles later than I would!
The “ct value” Imagining Real-Time PCR • • The value that represents the cycle number where the amplification curve crosses an arbitrary threshold. Ct values are directly related to the starting quantity of DNA, by way of the formula: Quantity = 2^Ct Ct Values: Measuring Quantities 23 Threshold 25 28
threshold Ct
Imagining Real-Time PCR Measuring Quantities There’s a DIRECT relationship between the starting amount of DNA, and the cycle number that you’ll reach an arbitrary number of DNA copies (Ct value). DNA amount = 2 ^ Cycle Number
How do We Measure DNA in a PCR Reaction? We use reagents that fluoresce in the presence of amplified DNA! Ex. SYBR Green dye They bind to double-stranded DNA and emit light when illuminated with a specific wavelength.
• ds. DNA intercalating dye • Unspecific (optimization) • cheap SYBRgreen How do We Measure DNA in a PCR Reaction? 5’ 3’ Extension 3’ 5’ ID 5’ Taq ID ID Taq 5’ ID 3’ Apply Excitation Wavelength l l 3’ 5’ l ID ID ID Taq l ID l Taq 5’ ID 5’ 3’
Melting curve – Test the presence of unspecific amplification, contamination, primer dimers, . .
Taq. Man probes • Sequence-specific • Doesn´t need much optimization • More expensive
What Type of Instruments are used with Real. Time PCR? Real-time PCR instruments consist of TWO main components: • Thermal Cycler (PCR machine) • Optical Module (to detect fluorescence in the tubes during the run)
What Type of Instruments are used with Real. Time PCR? • Adequate, optical plates Ø 96/384 wells Ø Standard/fast • Optical sealing adhesive
Quantification and Normalization • First basic underlying principle: every cycle there is a doubling of product. • Second basic principle: we do not need to know exact quantities of DNA, instead we will only deal with relative quantities. • Third basic principle: we have to have not only a “target” gene but also a “normalizer” gene. • Key formula: Quantity = 2 ^ (Cta – Ctb)
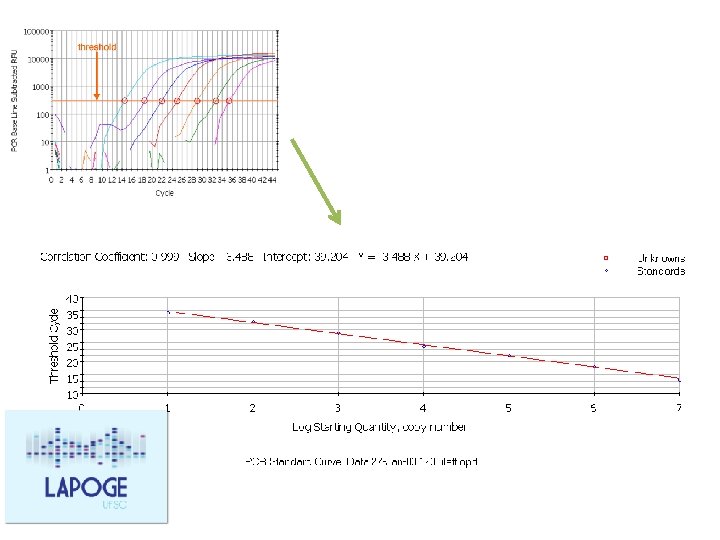
Standard Curve Quantification and Normalization Prepare a 2 -fold serial dilution of a DNA sample: Recomendation: add always a standard curve in every run
E = 10 [– 1/slope]
E = 10^(-1/slope) E = (10^(-1/slope)-1)*100 Ex. slope = -3, 81 efficency= (10^(-1/-3. 81)-1)*100 = 83% Ideal: efficency >95% 51
IL 1 -b vit RPLP 0 con RPLP 0 vit IL 1 -b con 53
EFFICIENCY DDCt METHOD APPROXIMATION METHOD 54
IL 1 -b vit RPLP 0 con RPLP 0 vit IL 1 -b con 55
56
control D Ct = target - ref RPLP 0 con D Ct = 9. 70 IL 1 -b con av =19. 93 experiment av =29. 63 D Ct = target - ref IL 1 -b vit D Ct = -1. 7 RPLP 0 vit av =18. 03 av =19. 80 Difference = DCt-DCt = DDCt = 9. 70 -(-1. 7) = 11. 40 57
DDCt = 11. 40 for IL 1 -beta • 2 DDCt variant: assumes efficiency is 100% Fold change = 211. 40 = 2702 • But our efficiency for IL 1 -beta is 93% – Fold change = 1. 9311. 40 = 1800 • Pfaffl equation corrected for RPLP 0 efficiency – Fold change = 1901 58
IL 1 -beta IL 1 -b vit IL 1 -b con av =18. 03 av =29. 63 AFTER N CYCLES: change = (efficiency)n AFTER N CYCLES: ratio vit/con = (1. 93)29. 63 -18. 03 =1. 9311. 60 = 2053 59
RPLP 0 con RPLP 0 vit av =19. 80 av =19. 93 AFTER N CYCLES: change = (efficiency)n AFTER N CYCLES: ratio vit/con = (1. 87)19. 93 -19. 80 =1. 870. 13 = 1. 08 60
Quantification and Normalization “normalizer” gene • Knowing the amount of m. RNA in one sample from one specific gene does not tell us much. . • You need to know the total amount of m. RNA in your sample • You also dont know how much the m. RNA level has changed compared to other m. RNA levels • Example: m. RNA levels of a gene increase 2 x after induction It is possable that all (1) genexpression in the cell has increased (2) the induced samples contained more total m. RNA We have to compare the expression of our gene to another gene which expression is normally constant, a housekeeping gene (ex. TBP, 18 S)
ΔΔCt method experiment control -[(Cttg-Ctcg)-(Cttg-Ctcg)] 2 Ex! D Ct = target gene– ref gene D Ct = 9. 70 D Ct = target gene– ref gene D Ct = -1. 70 Difference = DCt-DCt = DDCt = 9. 70 -(-1. 7) = 11. 40 Fold change = 211. 40 = 2702 Always in duplicate or triplicate!
Calculando a eficiência dos primers em q. PCR Ideal: N = N 0. 2 n N = número de moléculas amplificadas N 0 = número de moléculas inicial n = Número de ciclos threshold Ct Curva padrão
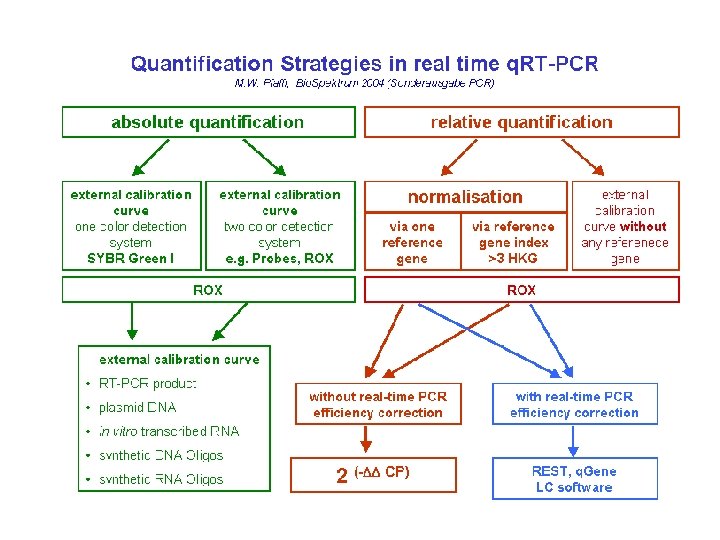
Quantification and Normalization
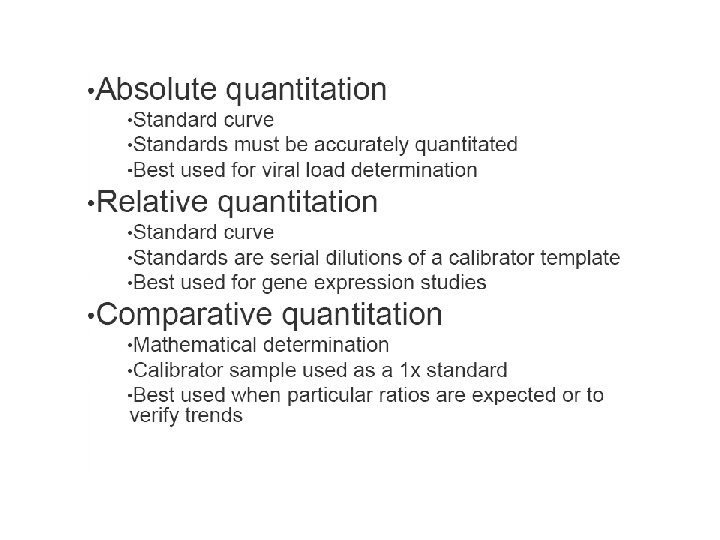
Absolute quantification
Good Comparative Ct example (for gene expression) Endogenous control Gene of interest • Small variation in endogenous control Ct values • Shape of curve, including linear phase (log view)
1 Bad Comparative Ct example 1 2 2 3 1) Too much variation in endogenous control Ct values 2) Sigmoidal curves. Check baseline levels 3) No amplification
Endogenous control gene: • Present in all experimental samples • Expression does not vary between treatments, tissues, age, etc. i. e. constant expression levels • By using an endogenous control as an active reference you can normalize quantification of m. RNA target for differences in the amount of total RNA added to each sample. i. e. loading control • Commonly used: 18 S or 25 S r. RNA, actin, GAPDH, ubiquitin, etc
Reference sample • Used in Comparative CT and relative standard curve experiments • Sample used as the basis for relative quantitation results. i. e. Everything gets expressed and compared relative to this sample. • Also called calibrator • It doesn’t matter which sample is used, however normally the negative control is used.
Amplification curve: log view Plateau Linear Exponential Always use during analysis Amplification curve: linear view
It's all about Ct Threshold Ct
Threshold set too high Threshold set too low
Threshold is important • Threshold determines Ct values • Ct values are used to calculate relative expression, presence/absence, etc. It's all about Ct values • Threshold should be set in the linear portion (parallel lines) in log view. Always check! • Do not use Ct values of 35 or higher. Repeat using more c. DNA/DNA
Good Comparative Ct example (for gene expression) Endogenous control Gene of interest • Small variation in endogenous control Ct values • Shape of curve, including linear phase (log view)
1 Bad Comparative Ct example 1 2 2 3 1) Too much variation in endogenous control Ct values 2) Sigmoidal curves. Check baseline levels 3) No amplification