
Web Application for Realtime Forex Rate and Stock

Web Application for Real-time Forex Rate and Stock Price Prediction HKUST FYP Group RO 5 HO Cheuk Yin (Ronald) WONG Hoi Ming (Henry)
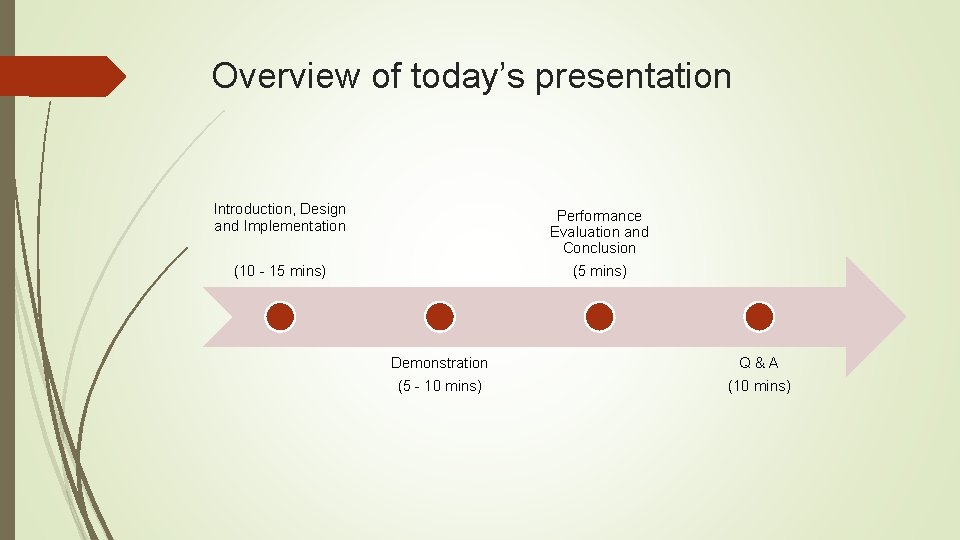
Overview of today’s presentation Introduction, Design and Implementation Performance Evaluation and Conclusion (10 - 15 mins) (5 mins) Demonstration (5 - 10 mins) Q&A (10 mins)

Background of our project Both stocks and foreign currencies (forex) are ubiquitous! Purchase forexes when travelling to other countries Fluctuation in forex rates impact the prices of imported goods and cost of living! Transaction of forexes and stocks for investment purposes!

Background of our project If future prices and price trends can be predicted… 1. Investors: Make better decision and (hopefully) gain in returns! 2. Governments: Make more accurate policies to stabilize their currencies! 3. General public (you and me): Reduce cost of travelling and living!
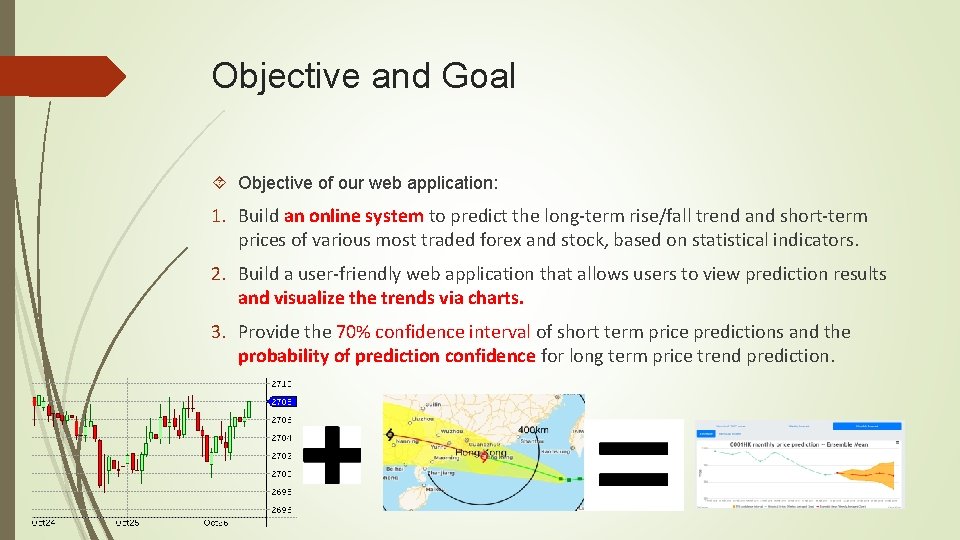
Objective and Goal Objective of our web application: 1. Build an online system to predict the long-term rise/fall trend and short-term prices of various most traded forex and stock, based on statistical indicators. 2. Build a user-friendly web application that allows users to view prediction results and visualize the trends via charts. 3. Provide the 70% confidence interval of short term price predictions and the probability of prediction confidence for long term price trend prediction.
Objective and Goal In one sentence: To provide short term price prediction and long term price trend prediction in a user-friendly approach How?
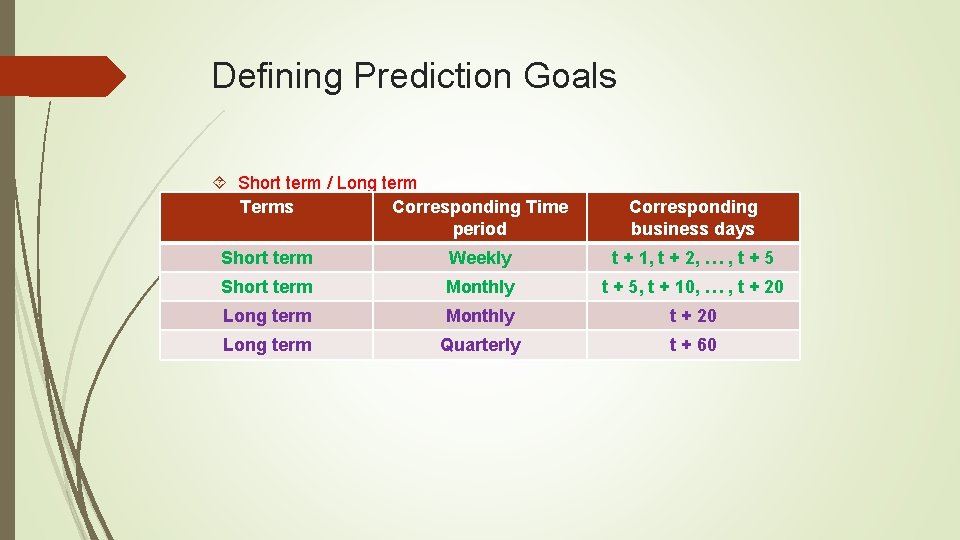
Defining Prediction Goals Short term / Long term Terms Corresponding Time period Corresponding business days Short term Weekly t + 1, t + 2, … , t + 5 Short term Monthly t + 5, t + 10, … , t + 20 Long term Monthly t + 20 Long term Quarterly t + 60
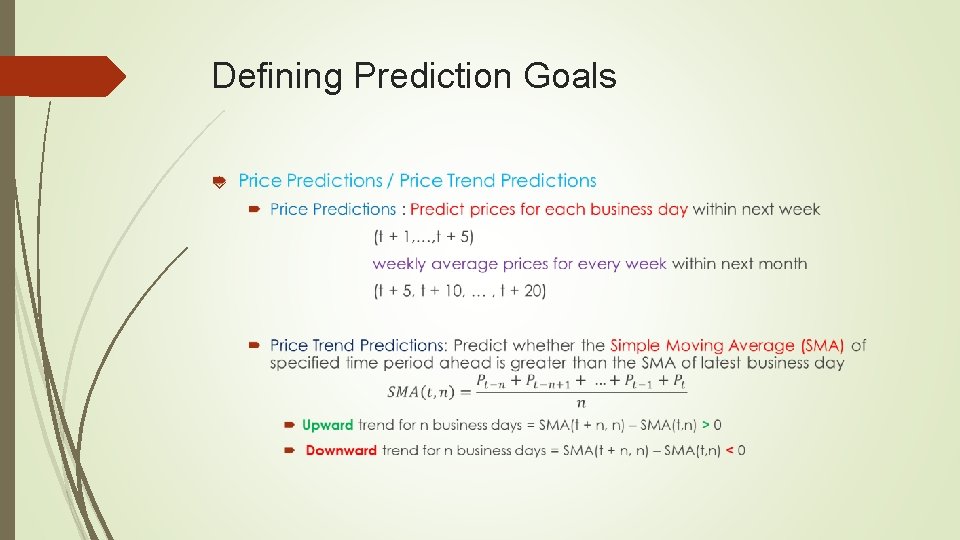
Defining Prediction Goals

Defining Prediction Goals Price predictions: Weekly price prediction Monthly price prediction
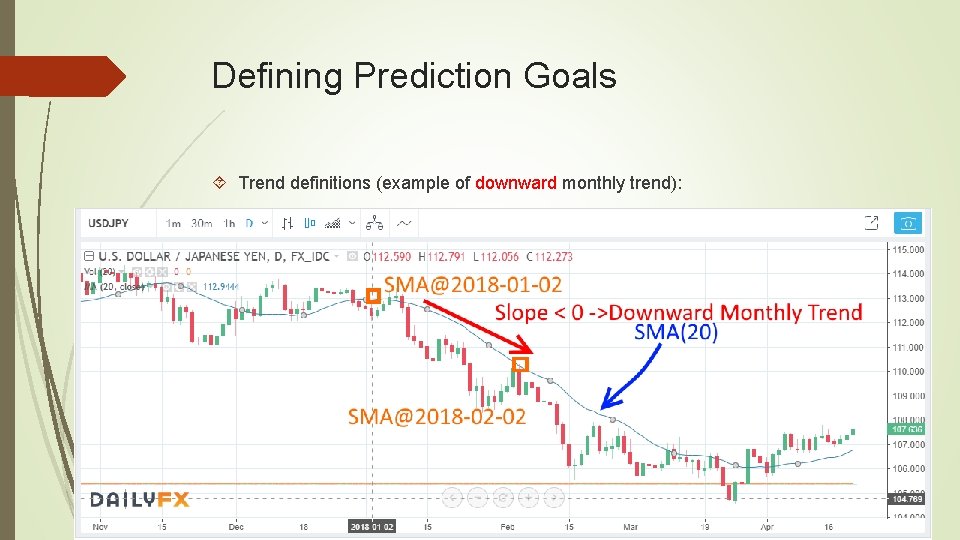
Defining Prediction Goals Trend definitions (example of downward monthly trend):
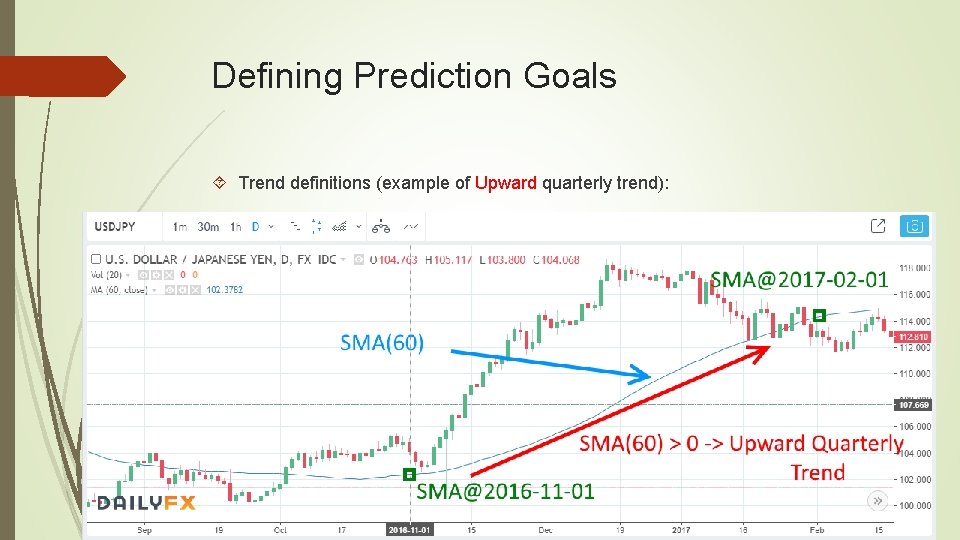
Defining Prediction Goals Trend definitions (example of Upward quarterly trend):
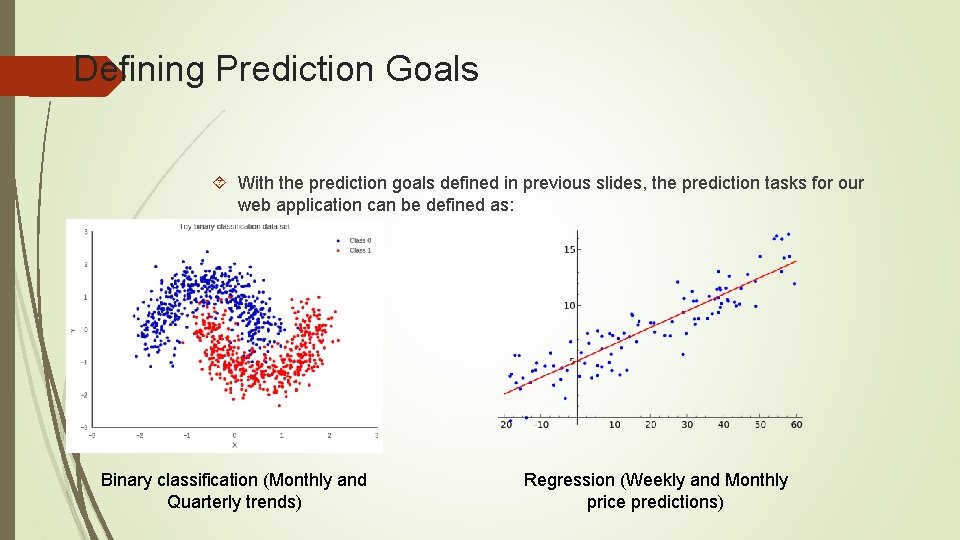
Defining Prediction Goals With the prediction goals defined in previous slides, the prediction tasks for our web application can be defined as: Binary classification (Monthly and Quarterly trends) Regression (Weekly and Monthly price predictions)
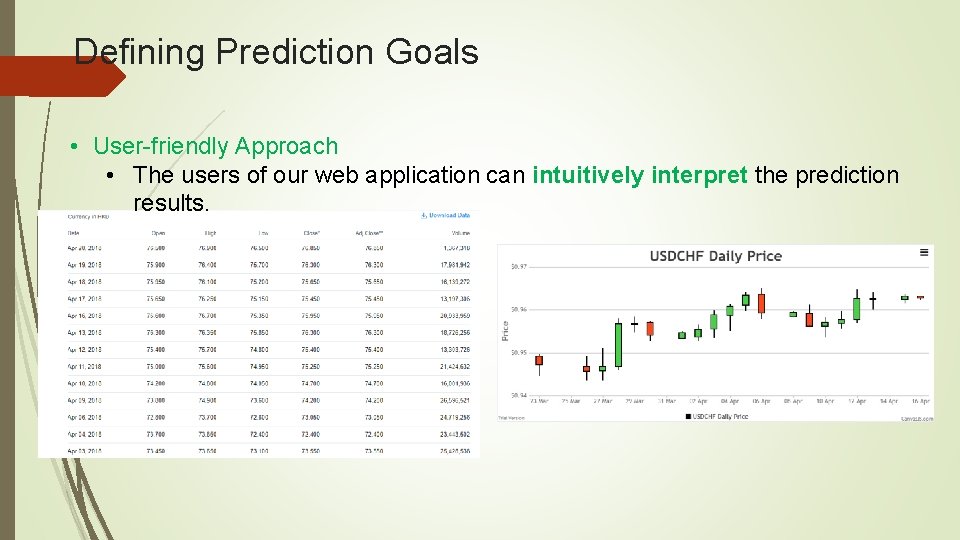
Defining Prediction Goals • User-friendly Approach • The users of our web application can intuitively interpret the prediction results.
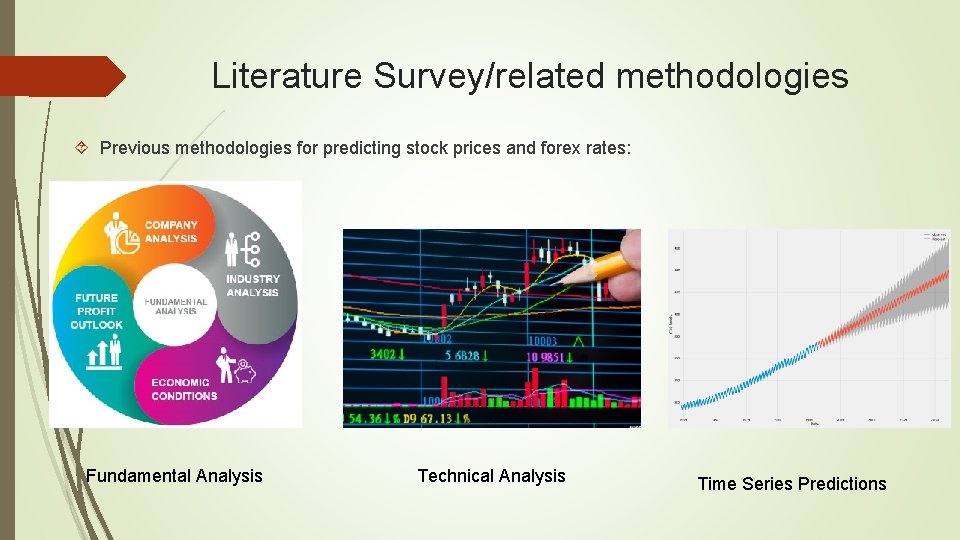
Literature Survey/related methodologies Previous methodologies for predicting stock prices and forex rates: Fundamental Analysis Technical Analysis Time Series Predictions
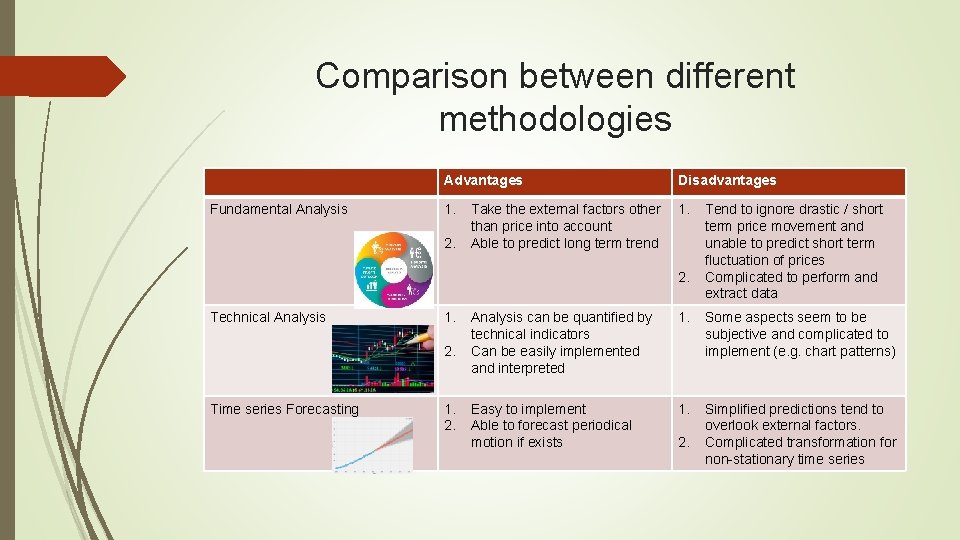
Comparison between different methodologies Fundamental Analysis Advantages Disadvantages 1. 2. Take the external factors other than price into account Able to predict long term trend 2. Technical Analysis 1. 2. Time series Forecasting 1. 2. Tend to ignore drastic / short term price movement and unable to predict short term fluctuation of prices Complicated to perform and extract data Analysis can be quantified by technical indicators Can be easily implemented and interpreted 1. Some aspects seem to be subjective and complicated to implement (e. g. chart patterns) Easy to implement Able to forecast periodical motion if exists 1. Simplified predictions tend to overlook external factors. Complicated transformation for non-stationary time series 2.
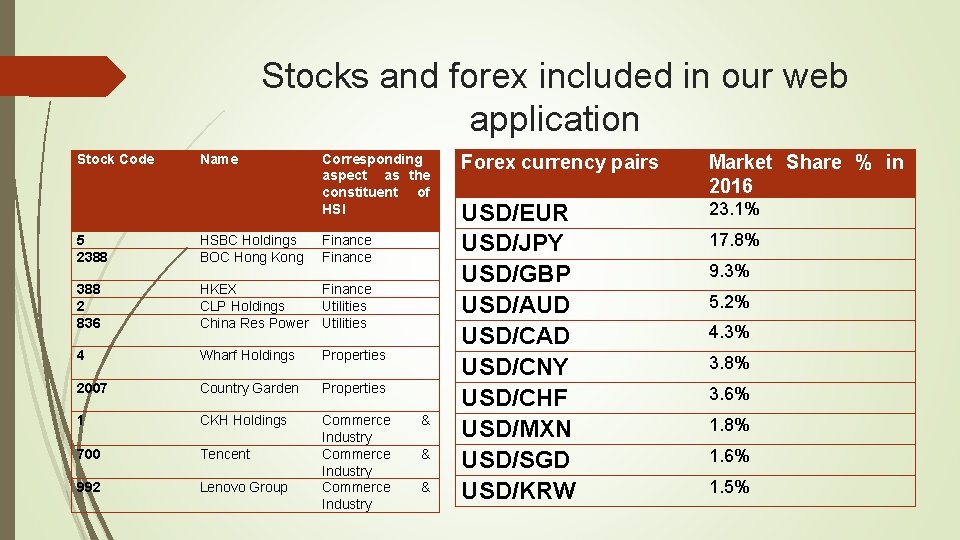
Stocks and forex included in our web application Stock Code Name Corresponding aspect as the constituent of HSI 5 2388 HSBC Holdings BOC Hong Kong Finance 388 2 836 HKEX Finance CLP Holdings Utilities China Res Power Utilities 4 Wharf Holdings Properties 2007 Country Garden Properties 1 CKH Holdings 700 Tencent 992 Lenovo Group Commerce Industry & & & Forex currency pairs Market Share % in 2016 USD/EUR USD/JPY USD/GBP USD/AUD USD/CAD USD/CNY USD/CHF USD/MXN USD/SGD USD/KRW 23. 1% 17. 8% 9. 3% 5. 2% 4. 3% 3. 8% 3. 6% 1. 8% 1. 6% 1. 5%
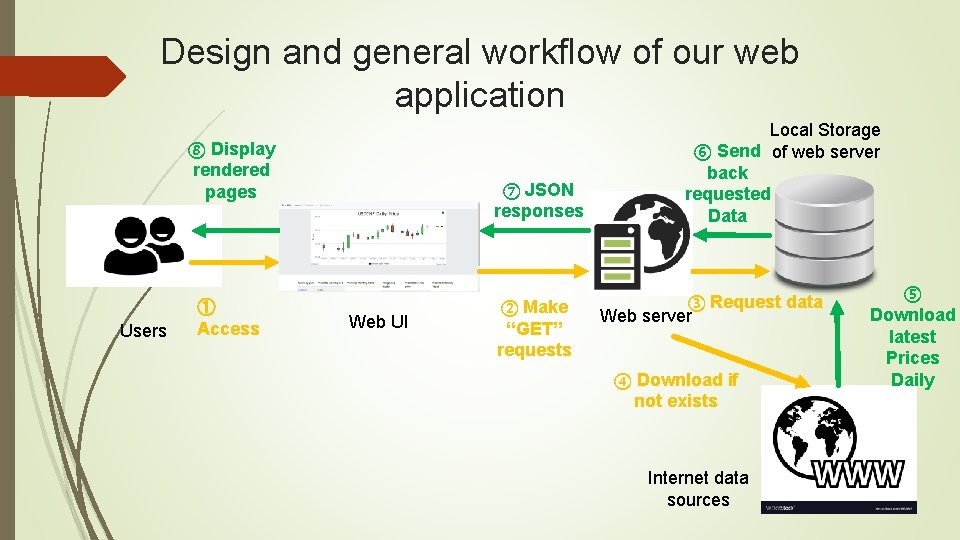
Design and general workflow of our web application ⑧ Display rendered pages Users ① Access ⑦ JSON responses Web UI ② Make “GET” requests Local Storage ⑥ Send of web server back requested Data ③ Request data Web server ④ Download if not exists Internet data sources ⑤ Download latest Prices Daily
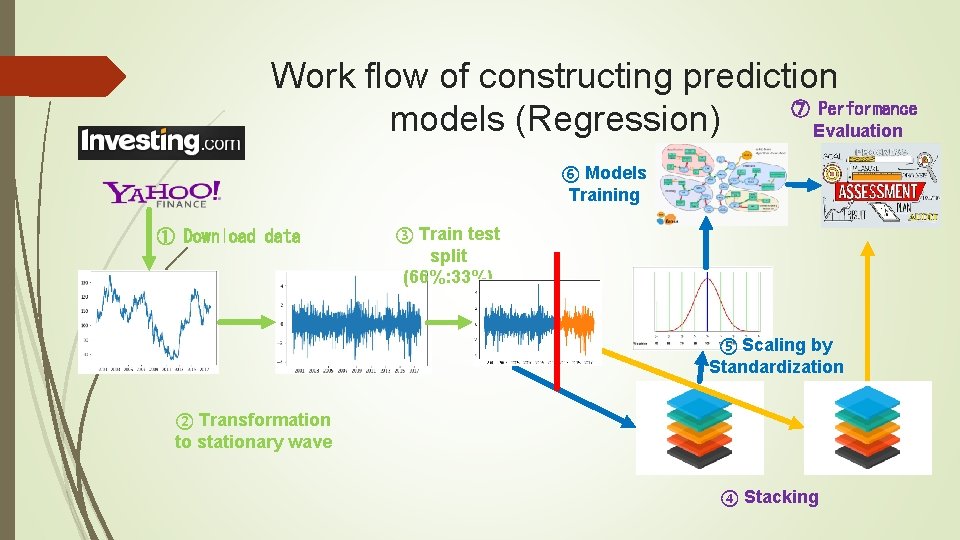
Work flow of constructing prediction ⑦ Performance models (Regression) Evaluation ⑥ Models Training ① Download data ③ Train test split (66%: 33%) ⑤ Scaling by Standardization ② Transformation to stationary wave ④ Stacking

Data Scraping of price data Get html pages from data sources (Stock: Yahoo Finance, Forex: Investing. com) Scrape and parse price data inside the html table elements Transformed into data frame / csv format for further usages / storages
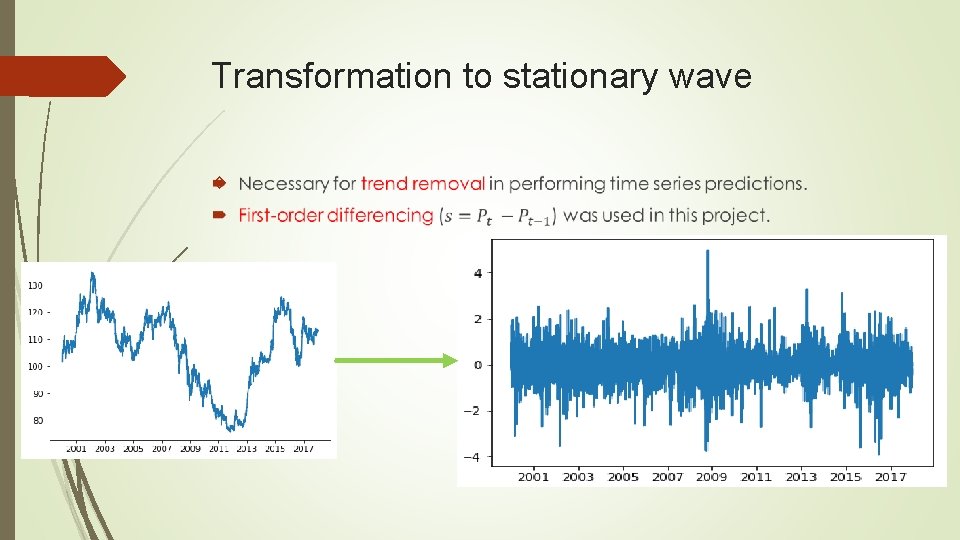
Transformation to stationary wave
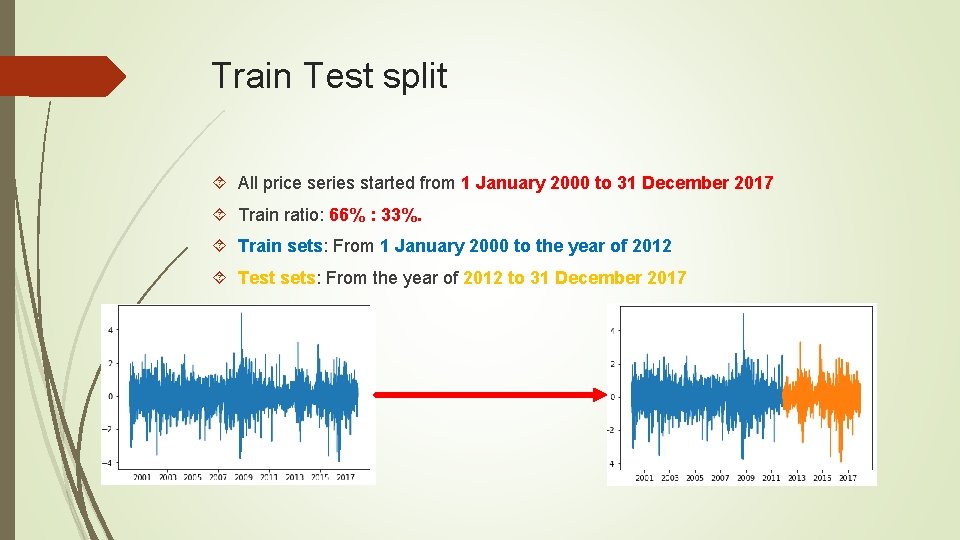
Train Test split All price series started from 1 January 2000 to 31 December 2017 Train ratio: 66% : 33%. Train sets: From 1 January 2000 to the year of 2012 Test sets: From the year of 2012 to 31 December 2017
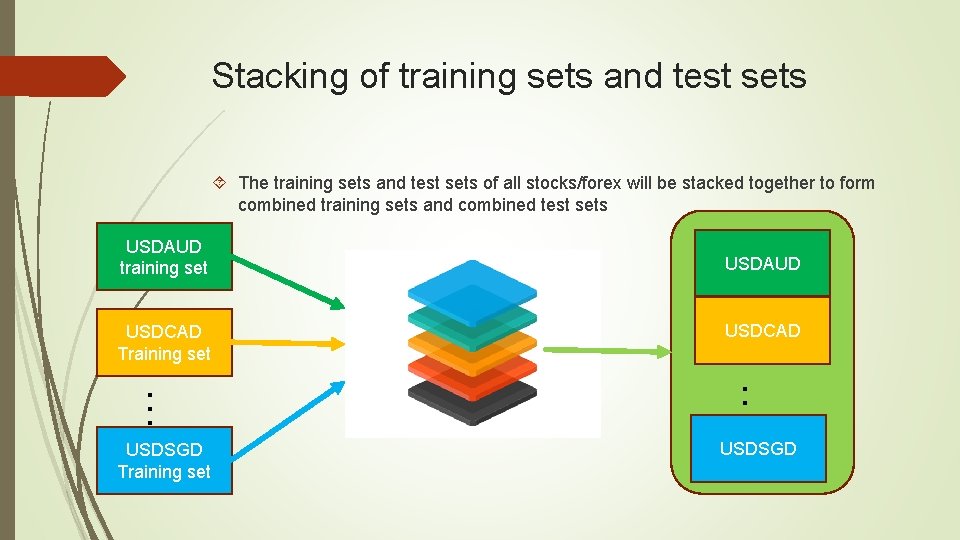
Stacking of training sets and test sets The training sets and test sets of all stocks/forex will be stacked together to form combined training sets and combined test sets USDAUD training set USDCAD Training set USDAUD USDCAD … … USDSGD Training set USDSGD
Stacking of training sets and test sets Reasons: 1. To provide a much larger size of data for training/validation (3000 for individual stocks/forex vs 30000 for combined dataset) 2. The past data from other stocks/forex can be used to improve prediction accuracy of any individual stocks / forex
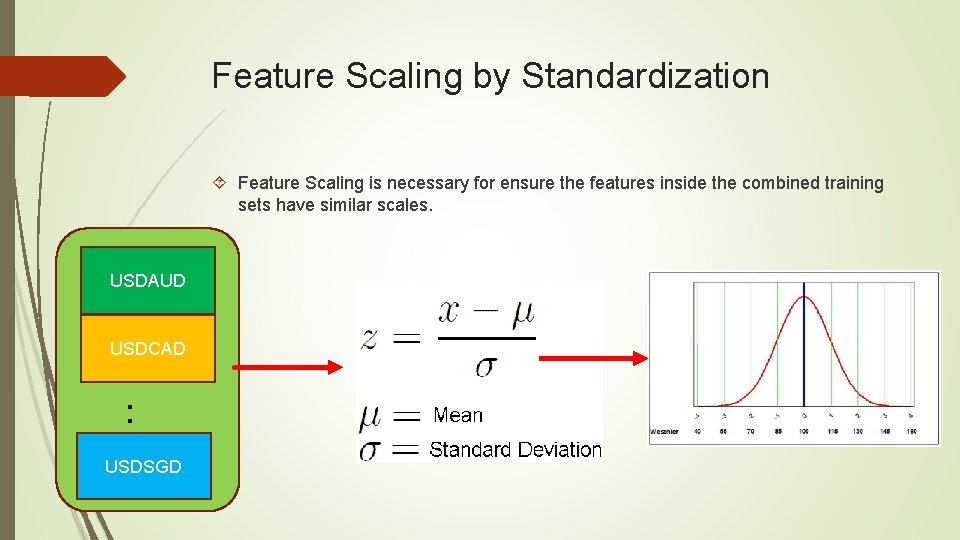
Feature Scaling by Standardization Feature Scaling is necessary for ensure the features inside the combined training sets have similar scales. USDAUD USDCAD … USDSGD
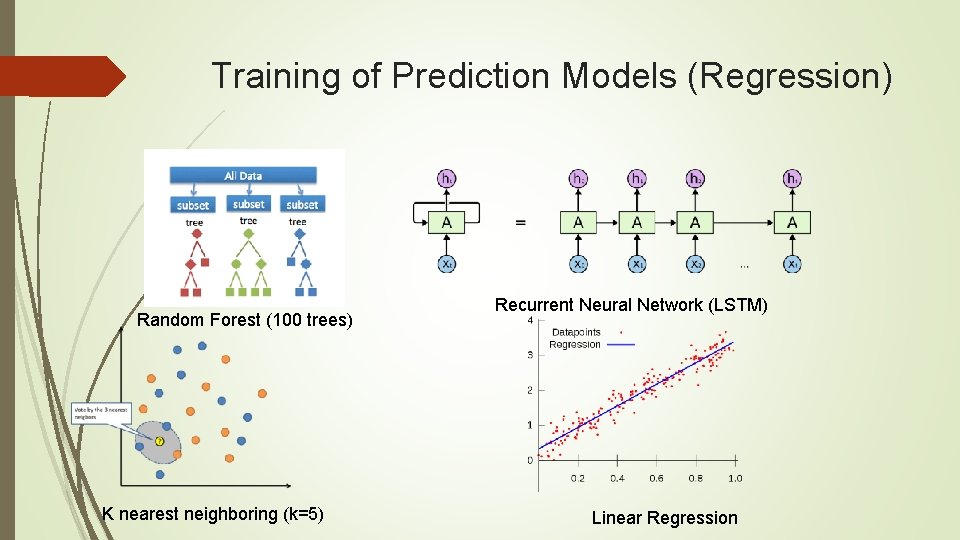
Training of Prediction Models (Regression) Random Forest (100 trees) K nearest neighboring (k=5) Recurrent Neural Network (LSTM) Linear Regression
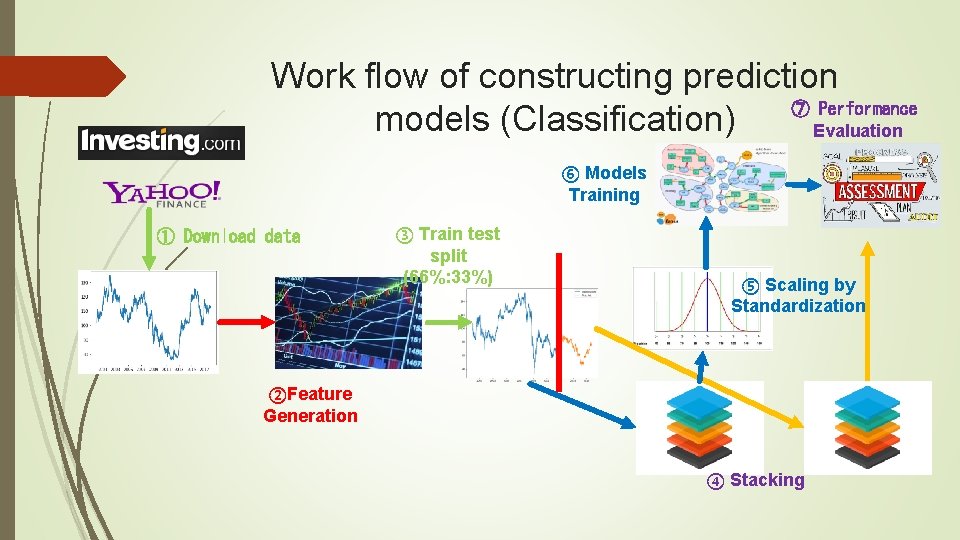
Work flow of constructing prediction ⑦ Performance models (Classification) Evaluation ⑥ Models Training ① Download data ③ Train test split (66%: 33%) ⑤ Scaling by Standardization ②Feature Generation ④ Stacking
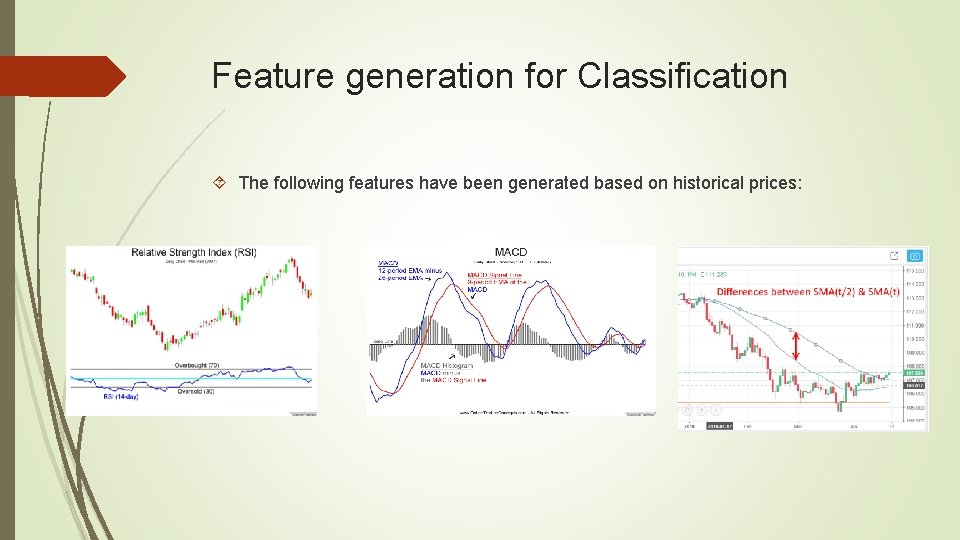
Feature generation for Classification The following features have been generated based on historical prices:
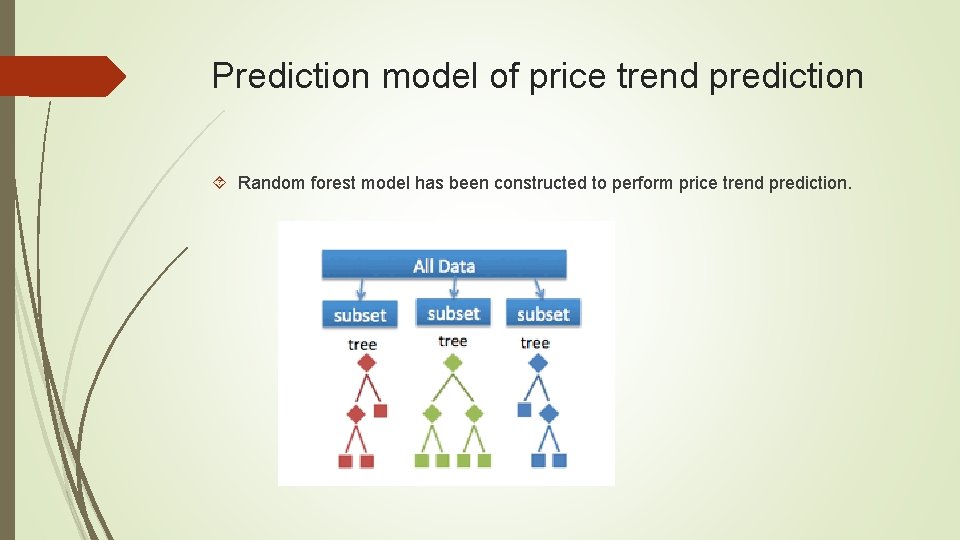
Prediction model of price trend prediction Random forest model has been constructed to perform price trend prediction.
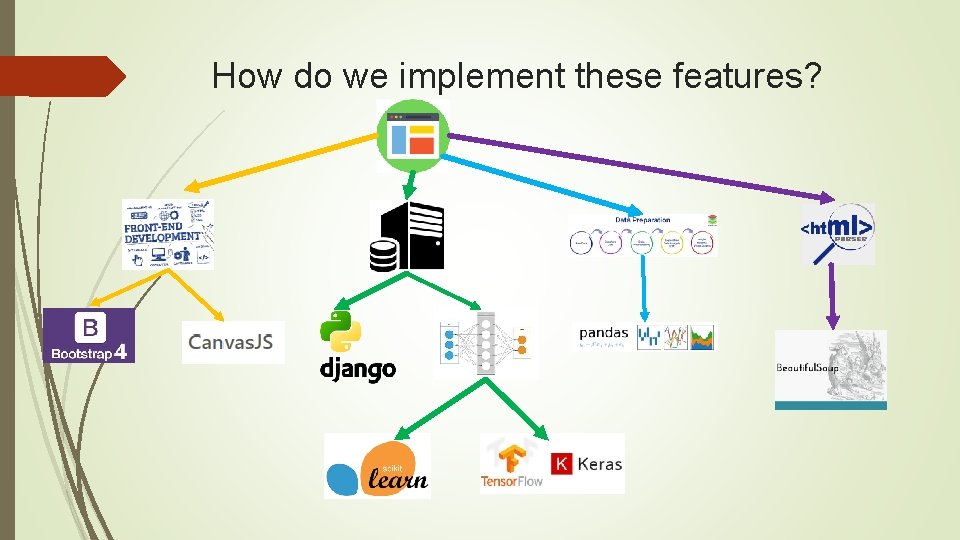
How do we implement these features?
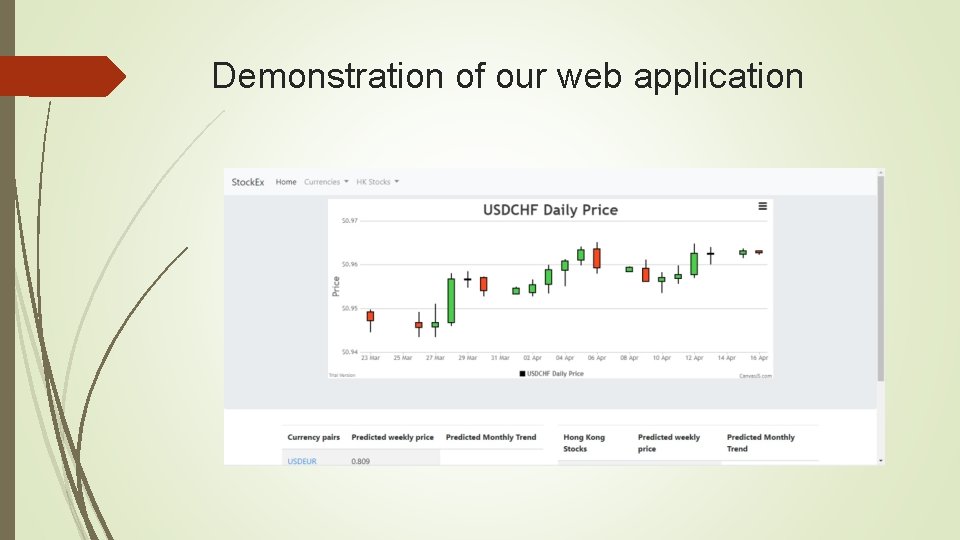
Demonstration of our web application
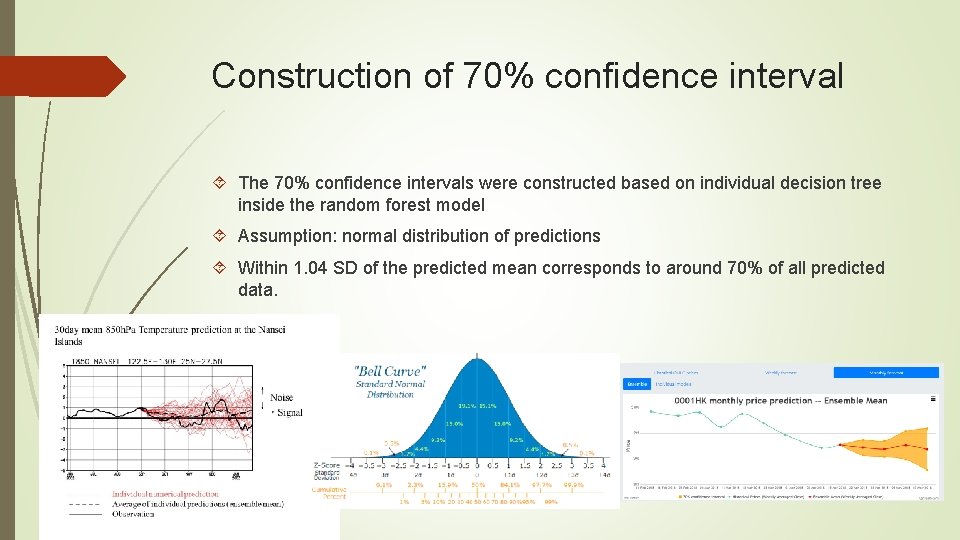
Construction of 70% confidence interval The 70% confidence intervals were constructed based on individual decision tree inside the random forest model Assumption: normal distribution of predictions Within 1. 04 SD of the predicted mean corresponds to around 70% of all predicted data.
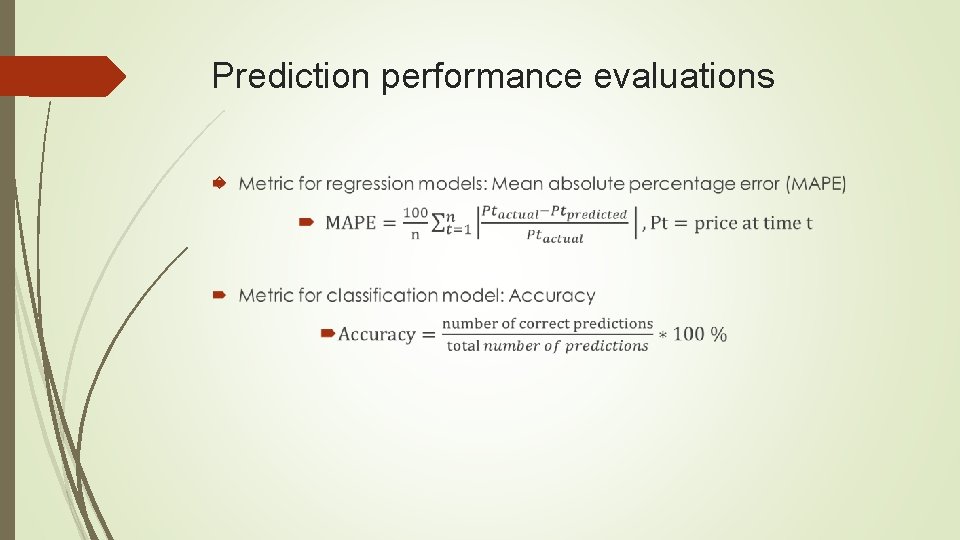
Prediction performance evaluations
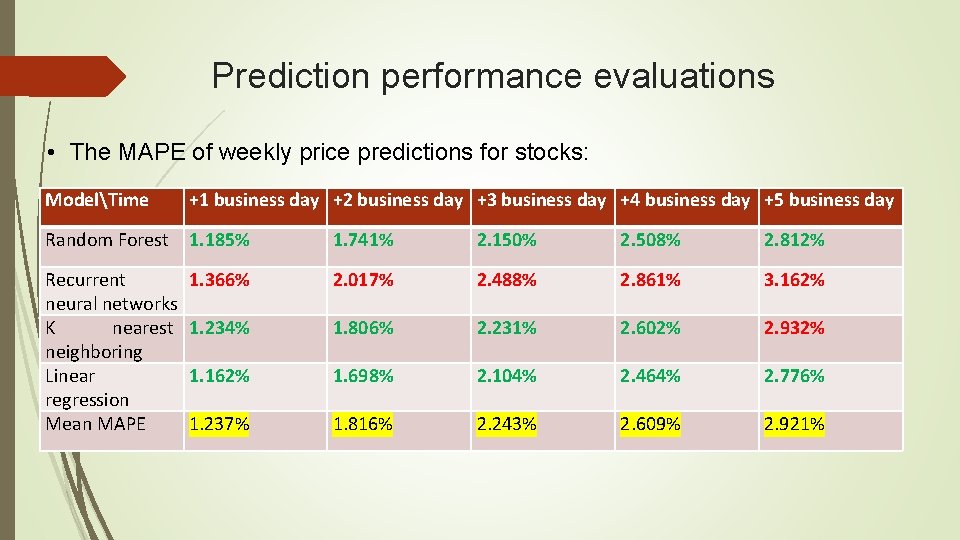
Prediction performance evaluations • The MAPE of weekly price predictions for stocks: ModelTime +1 business day +2 business day +3 business day +4 business day +5 business day Random Forest 1. 185% 1. 741% 2. 150% 2. 508% 2. 812% Recurrent neural networks K nearest neighboring Linear regression Mean MAPE 1. 366% 2. 017% 2. 488% 2. 861% 3. 162% 1. 234% 1. 806% 2. 231% 2. 602% 2. 932% 1. 162% 1. 698% 2. 104% 2. 464% 2. 776% 1. 237% 1. 816% 2. 243% 2. 609% 2. 921%
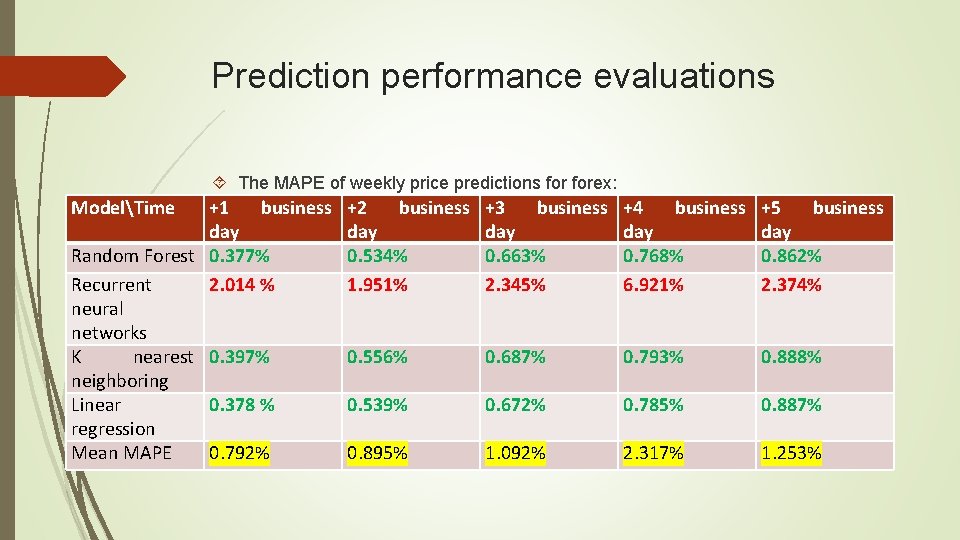
Prediction performance evaluations The MAPE of weekly price predictions forex: ModelTime +1 business day Random Forest 0. 377% Recurrent 2. 014 % neural networks K nearest 0. 397% neighboring Linear 0. 378 % regression Mean MAPE 0. 792% +2 business day 0. 534% 1. 951% +3 business day 0. 663% 2. 345% +4 business day 0. 768% 6. 921% +5 business day 0. 862% 2. 374% 0. 556% 0. 687% 0. 793% 0. 888% 0. 539% 0. 672% 0. 785% 0. 887% 0. 895% 1. 092% 2. 317% 1. 253%
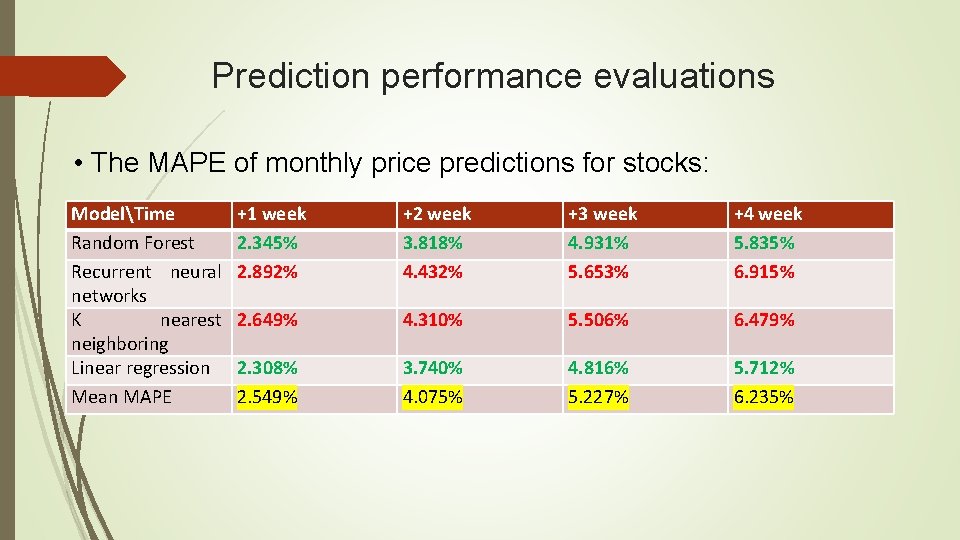
Prediction performance evaluations • The MAPE of monthly price predictions for stocks: ModelTime Random Forest Recurrent neural networks K nearest neighboring Linear regression Mean MAPE +1 week 2. 345% 2. 892% +2 week 3. 818% 4. 432% +3 week 4. 931% 5. 653% +4 week 5. 835% 6. 915% 2. 649% 4. 310% 5. 506% 6. 479% 2. 308% 2. 549% 3. 740% 4. 075% 4. 816% 5. 227% 5. 712% 6. 235%
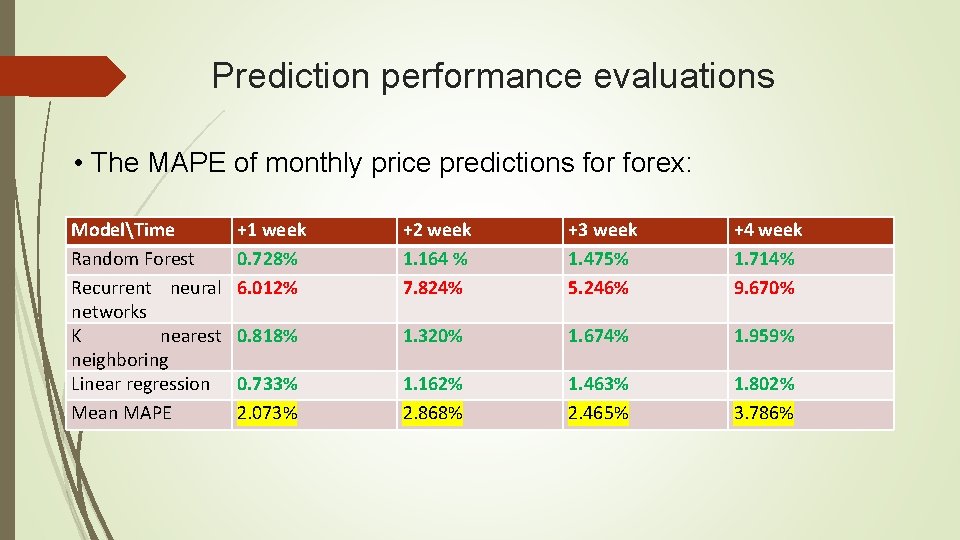
Prediction performance evaluations • The MAPE of monthly price predictions forex: ModelTime Random Forest Recurrent neural networks K nearest neighboring Linear regression Mean MAPE +1 week 0. 728% 6. 012% +2 week 1. 164 % 7. 824% +3 week 1. 475% 5. 246% +4 week 1. 714% 9. 670% 0. 818% 1. 320% 1. 674% 1. 959% 0. 733% 2. 073% 1. 162% 2. 868% 1. 463% 2. 465% 1. 802% 3. 786%
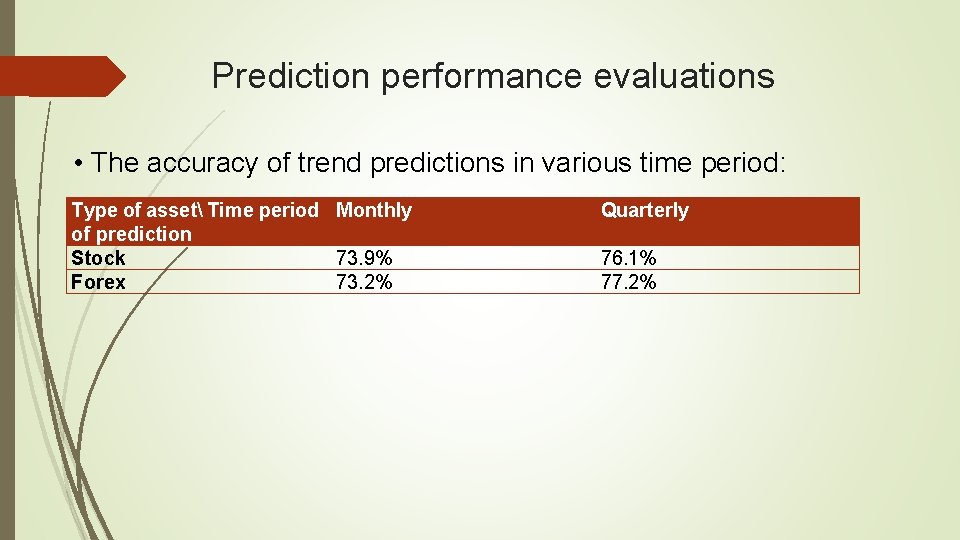
Prediction performance evaluations • The accuracy of trend predictions in various time period: Type of asset Time period Monthly of prediction Stock 73. 9% Forex 73. 2% Quarterly 76. 1% 77. 2%
Result implications 1. Forex in general have much lower prediction errors than stocks 2. Random forest and Linear regression perform much better than recurrent neural network and k nearest neighboring in price predictions 3. For trend predictions, the accuracy of the random forest model is much higher than random guessing (~75% vs 50%)
Conclusion We have developed a web application be able to achieve the following objectives: 1. Build an online system to predict the long-term rise/fall trend and short-term prices of various most traded forex and stock, based on statistical indicators. 2. Build a user-friendly web application that allows users to view prediction results and visualize the trends via charts. 3. Provide the 70% confidence interval of short term price predictions and the probability of prediction confidence for long term price trend prediction.
Conclusion However, we believed that continuous improvements are necessary for any software, including our web application. There are several points we would like to suggest for further improvement of this web application and the development of other related applications. 1. Deployment of the web application towards real production environment 2. Extension towards other types of financial assets, including encrypted currencies (for example, Bitcoin), Gold, Oil and etc. 3. Integration of prediction models with sentiment/textual analysis of social media (for example, twitter, Facebook) and financial news articles.

The end! Thank you!
- Slides: 41