Realtime data analysis and rendering with HTML 5

, John Aguinaldo")


\",")

- Slides: 19
Real-time data analysis and rendering with HTML 5 Canvas Tom Kunicki, USGS
Introduction • Work initiated with 2012 CDI Project Tim Schaub (Open. Geo), John Aguinaldo (USGS) o Presented HTML 5 rendering pipeline o • Current work Optimization of rendering pipeline o Bundled as simple extension to Open. Layers o Developed method for vending quantitative data § Standards-based § Open source o
Existing Methods • Single Tile Rendering Map overlay image requested as single tile o Single image covers map extent o New tile for each pan, zoom or style change o Image caching not possible o
Existing Methods • Multiple Tile Rendering o o Map overlay image requested as multiple tiles Can reuse tiles on pan operation (load new only) New tileset for each zoom level or style change Image caching possible § Requires fixed tiepoint, zoom levels and size and styles
Existing Methods • • • Server-side rendering can be expensive for complex data sets Styling and symbolization is a user preference Changes in styling require client/server round-trip NHDPlus Flowlines for HUC 2 (04) Approximately 114 k features rendered using mean monthly flow for 07/1993 as percentile of historical distribution obtained from results of AFINCH model run. Rendering time 30 seconds.
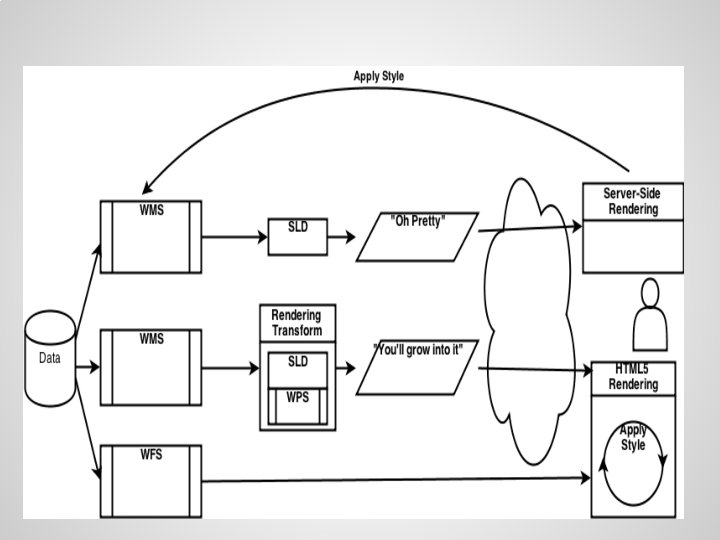
Presented Method • Tile "pre-rendering" with styling in browser o o Render quantitative information to tiles via WMS § Identifier or primary key § Attribute value Obtain supplemental information via WFS § Restrict to subset of attributes Apply styling in browser § Color maps § Feature culling Benefits § Rendering cost incurred once § Tiles are cacheable • § For a given spatiotemporal tile data doesn't change Responsive rendering
Presented Method • Facilitated by recent advancements o Geo. Server 2. 2. x § Rendering Transforms • • Implemented in Geo. Server 2. 2. x (Sept, 2012) WMS/SLD/WPS integration o Allows for highly customized rendering via WMS § Raster-to-Vector § Vector-to-Raster § Vector-to-Vector § Integrated Tile Caching • • o Seamless integration with WMS Allows for simple use of cache with Open. Layers § HTML 5 rendering pipeline § Sponsored by USGS CDI
Rendering Transform • • Vector-to-Raster rendering transform Implemented as WPS process o o • Available for direct execution Linked to WMS with SLD § Geo. Server specific vendor extension Inputs § WMS request parameters • § Feature collection to render • § bounding box, tile size. . . already clipped to bounding box Attribute to render Attribute for precedence Outputs a Raster
Rendering Transform • For each feature Render feature attribute value to raster pixels o If multiple features intersect pixel use precedence o • Attribute values limited to 24 bits Use RGB channels for data o Alpha value must be 1. 0/0 xff (more on this later) o • Custom Alpha Compositor Disable anti-aliasing o Implement precedence o • Slow, but optimization can be neglected
WFS for supplemental information • • Output in many formats; xml, json Subset request to required attributes Identifier o Provide attributes for browser side rendering o • Typically same datastore but not required o Must share rendered identifier
Tile Caching • • Geo. Web. Cache integrated into Geo. Server Now supports WMS integration Must use tiepoint of (0, 0) o Tile size of 256 x 256 o Standard zoom levels o append "tiled=true" as vendor argument o • Other protocols supported WMS-C, TMS, WMTS o WMS is typically the easiest on client side o • Seed cache for lower zoom levels o Separate cache for each time, style and CRS
HTML 5 Rendering Pipeline • • Create a pipeline to transform pre-rendered data to displayed image data Three components to pipeline WMS composite Layer o Pipeline operations (can be chained) o Rendered Raster Layer o • Based on Open. Layers 2. 12 Not released o Available as extension package bundled by CIDA o
WMS Composite Layer • Open. Layers. Layer. WMS instance o o o specify style utilizing Rendering Transform SLD enable tiling disable visibility specify PNG as image format (lossless) Same-origin or CORS § cross-origin canvas issues on read add to Open. Layers map instance
WMS Composite Layer • Open. Layers. Raster. Composite instance o Create using from. Layer(. . . ) function o Writes the layer tiles to an HTML 5 canvas § required to read image data o Source for pipeline operations o Reminder: Image alpha must be 1. 0/0 x. FF § Canvas will premultiply alpha on write § On read alpha is divided out, this is lossy
Pipeline Operation • Open. Layers. Raster. Operation instance wrap custom function using create(. . . ) method o function can accept up to 3 arguments § function(pixel, x, y) o • o pixel is 4 byte integer optimization is important! § called for every pixel on every rendering pass
Raster Layer • Open. Layers. Layer. Raster instance create o call set. Data(. . . ) using created Operation instance o add to map o • Target of pipeline operations
Sample Code var flowlines. WMSData = new Open. Layers. Layer. WMS( "Flowline WMS (Data)", geoserver. Base. URL + "wms", { layers: flowline. Layer, styles: flowline. Style, format: "image/png", tiled: "true" }, { is. Base. Layer: false, opacity: 0, display. In. Layer. Switcher: false, tile. Options: { cross. Origin. Keyword: 'anonymous' } } ); var flowline. Raster = new Open. Layers. Layer. Raster( { name: "NHD Flowlines”, is. Base. Layer: false }); // NOTE: in code below ‘pixel’ and ‘clip. Value’ are calculated elsewhere // define per-pixel operation var flowline. Clip. Operation = Open. Layers. Raster. Operation. create(function(pixel) { if (pixel >> 24 === 0) { return 0; } var value = pixel & 0 x 00 ffffff; if (value >= clip. Value && value < 0 x 00 ffffff) { return pixel; } else { return 0; } }); // source canvas (writes WMS tiles to canvas for reading) var flowline. Composite = Open. Layers. Raster. Composite. from. Layer(flowlines. WMSData, {int 32: true}); // filter source data through per-pixel operation var flowline. Clip. Operation. Data = flowline. Clip. Operation(flowline. Composite); // define layer that writes data to a new canvas flowline. Raster. set. Data(flowline. Clip. Operation. Data);
Demo http: //localhost: 8080/demo 1/ http: //localhost: 8080/demo 2/ tkunicki@usgs. gov https: //github. com/tkunicki-usgs/glri-geoserver