
Good q PCR The Necessary and the Reasonable

Good q. PCR The Necessary and the Reasonable
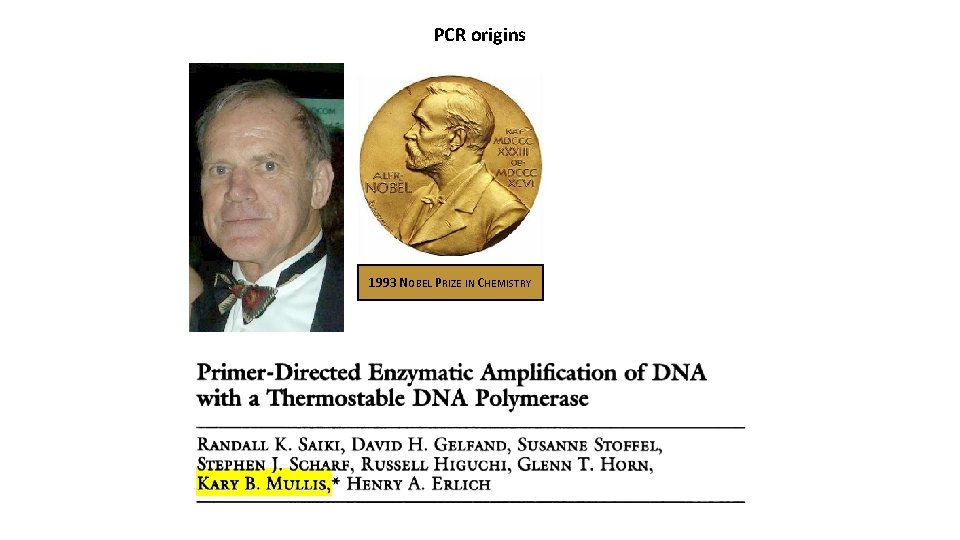
PCR origins 1993 NOBEL PRIZE IN CHEMISTRY
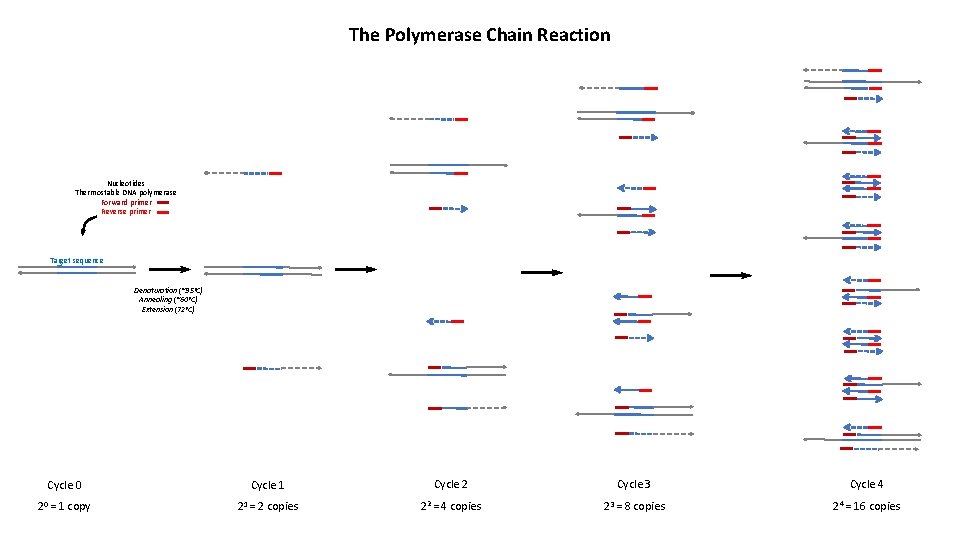
The Polymerase Chain Reaction Nucleotides Thermostable DNA polymerase Forward primer Reverse primer Target sequence Denaturation (~95°C) Annealing (~60°C) Extension (72°C) Cycle 0 Cycle 1 Cycle 2 Cycle 3 Cycle 4 20 = 1 copy 21 = 2 copies 22 = 4 copies 23 = 8 copies 24 = 16 copies
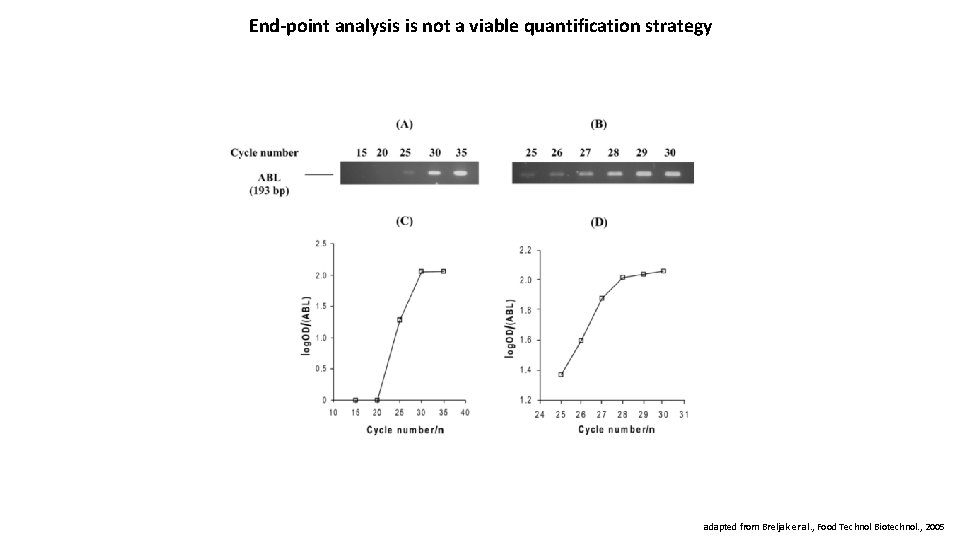
End-point analysis is not a viable quantification strategy adapted from Breljak er al. , Food Technol Biotechnol. , 2005
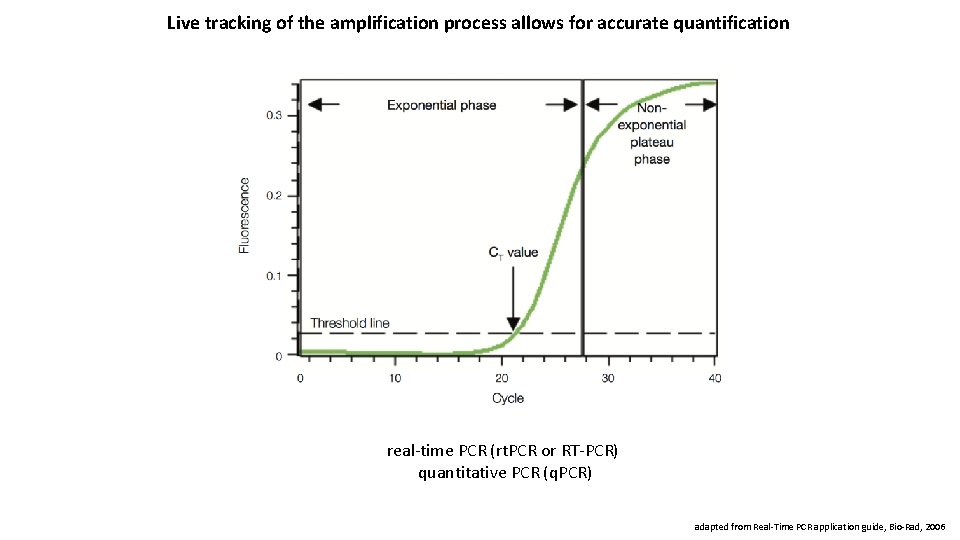
Live tracking of the amplification process allows for accurate quantification real-time PCR (rt. PCR or RT-PCR) quantitative PCR (q. PCR) adapted from Real-Time PCR application guide, Bio-Rad, 2006
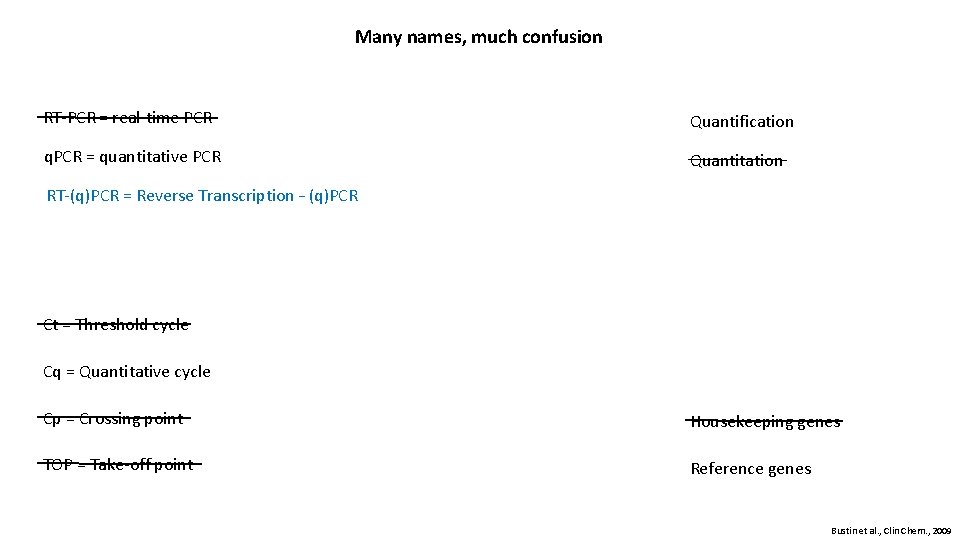
Many names, much confusion RT-PCR = real-time PCR Quantification q. PCR = quantitative PCR Quantitation RT-(q)PCR = Reverse Transcription – (q)PCR Ct = Threshold cycle Cq = Quantitative cycle Cp = Crossing point Housekeeping genes TOP = Take-off point Reference genes Bustin et al. , Clin Chem. , 2009
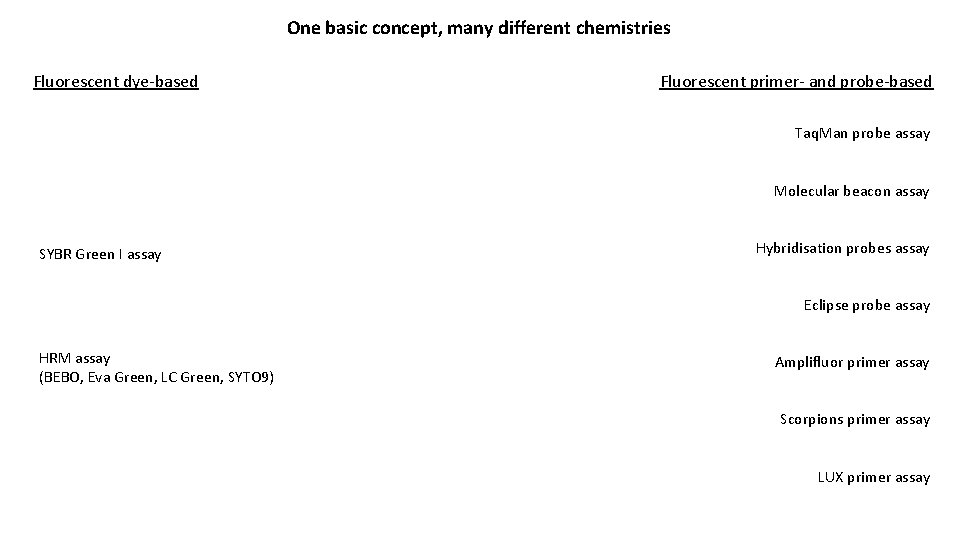
One basic concept, many different chemistries Fluorescent dye-based Fluorescent primer- and probe-based Taq. Man probe assay Molecular beacon assay SYBR Green I assay Hybridisation probes assay Eclipse probe assay HRM assay (BEBO, Eva Green, LC Green, SYTO 9) Amplifluor primer assay Scorpions primer assay LUX primer assay
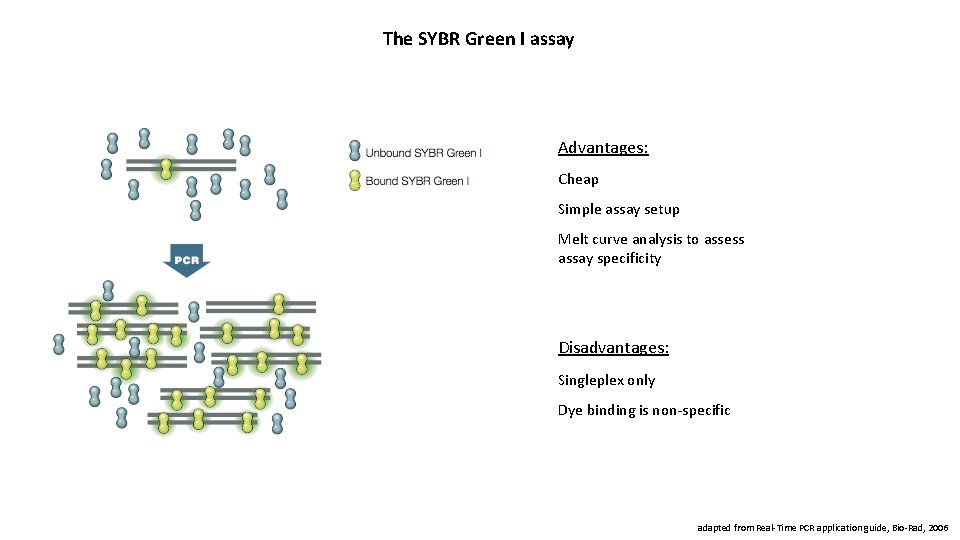
The SYBR Green I assay Advantages: Cheap Simple assay setup Melt curve analysis to assess assay specificity Disadvantages: Singleplex only Dye binding is non-specific adapted from Real-Time PCR application guide, Bio-Rad, 2006
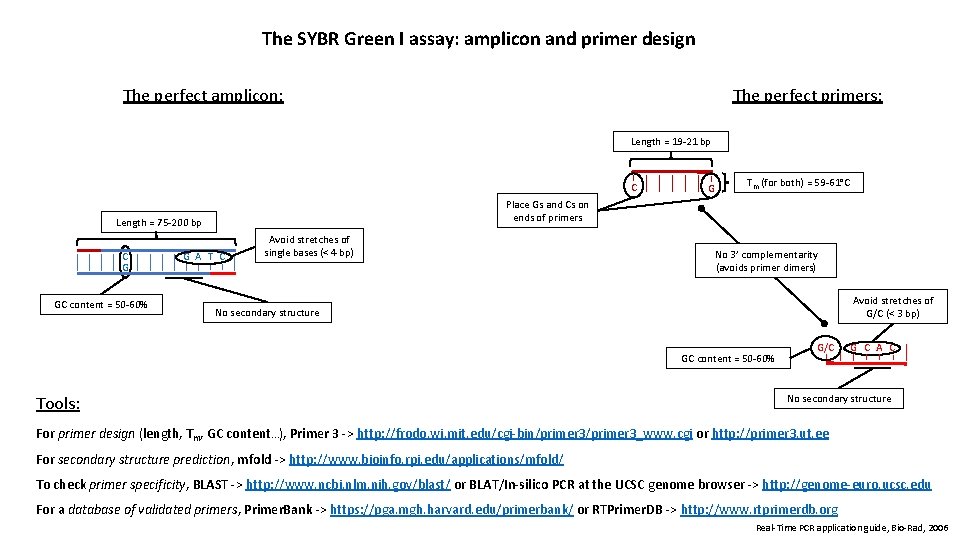
The SYBR Green I assay: amplicon and primer design The perfect amplicon: The perfect primers: Length = 19 -21 bp C GC content = 50 -60% Tm (for both) = 59 -61°C Place Gs and Cs on ends of primers Length = 75 -200 bp C G G G A T C Avoid stretches of single bases (< 4 bp) No 3’ complementarity (avoids primer dimers) Avoid stretches of G/C (< 3 bp) No secondary structure GC content = 50 -60% Tools: G/C G C A C No secondary structure For primer design (length, Tm, GC content…), Primer 3 -> http: //frodo. wi. mit. edu/cgi-bin/primer 3_www. cgi or http: //primer 3. ut. ee For secondary structure prediction, mfold -> http: //www. bioinfo. rpi. edu/applications/mfold/ To check primer specificity, BLAST -> http: //www. ncbi. nlm. nih. gov/blast/ or BLAT/In-silico PCR at the UCSC genome browser -> http: //genome-euro. ucsc. edu For a database of validated primers, Primer. Bank -> https: //pga. mgh. harvard. edu/primerbank/ or RTPrimer. DB -> http: //www. rtprimerdb. org Real-Time PCR application guide, Bio-Rad, 2006
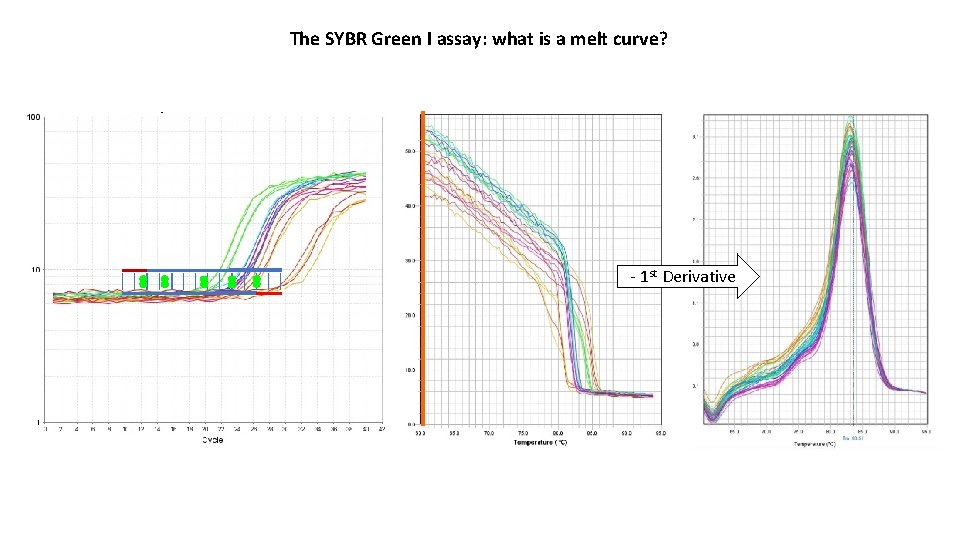
The SYBR Green I assay: what is a melt curve? - 1 st Derivative
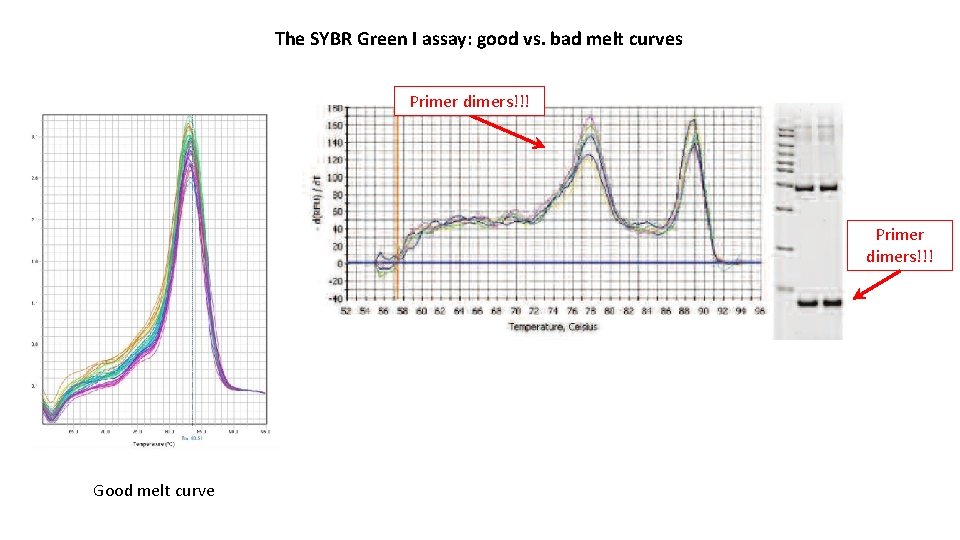
The SYBR Green I assay: good vs. bad melt curves Primer dimers!!! Good melt curve
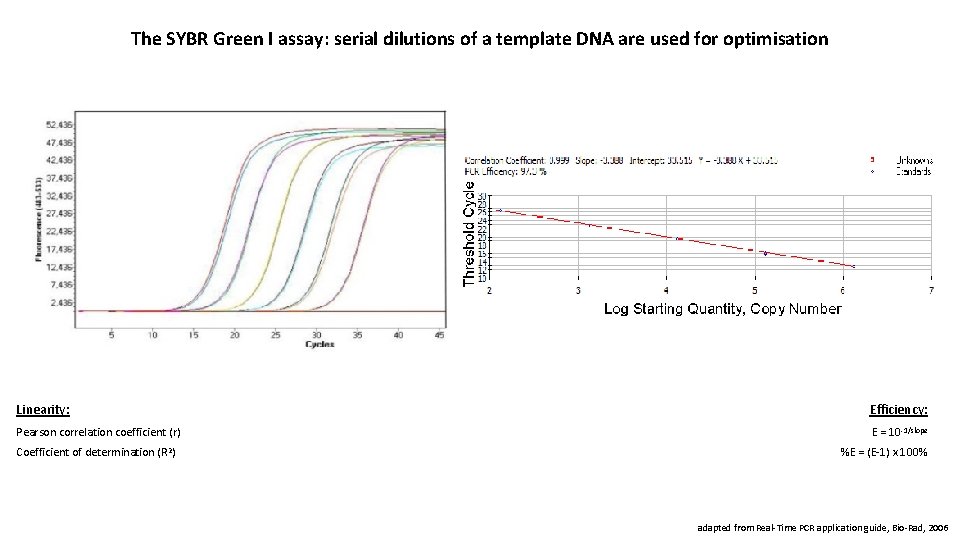
The SYBR Green I assay: serial dilutions of a template DNA are used for optimisation Linearity: Efficiency: Pearson correlation coefficient (r) E = 10 -1/slope Coefficient of determination (R 2) %E = (E-1) x 100% adapted from Real-Time PCR application guide, Bio-Rad, 2006

Quanti. Tect Reverse Transcription Kit contents: • g. DNA Wipe. Out buffer, 7 x • Quantiscript reverse transcriptase • Quantiscript RT buffer, 5 x • RT primer mix • RNase-free water
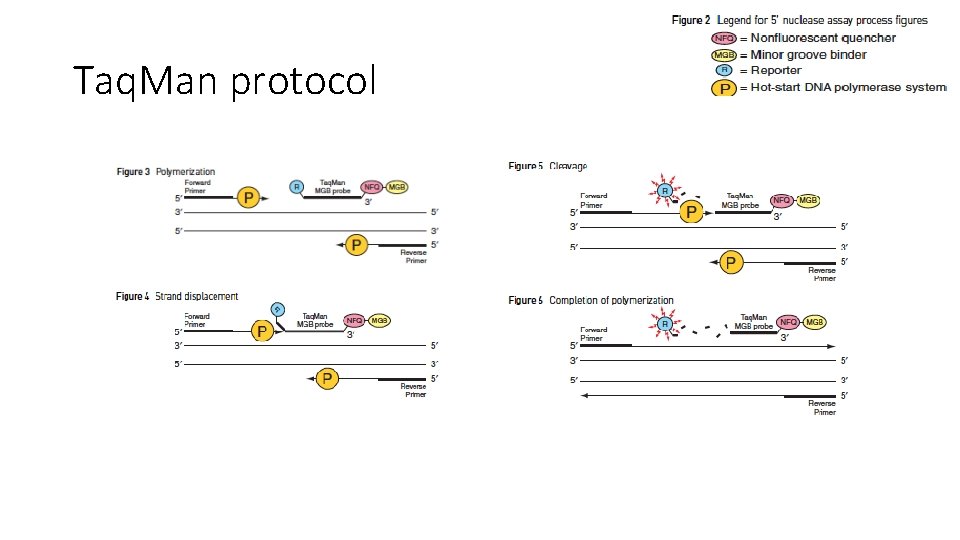
Taq. Man protocol
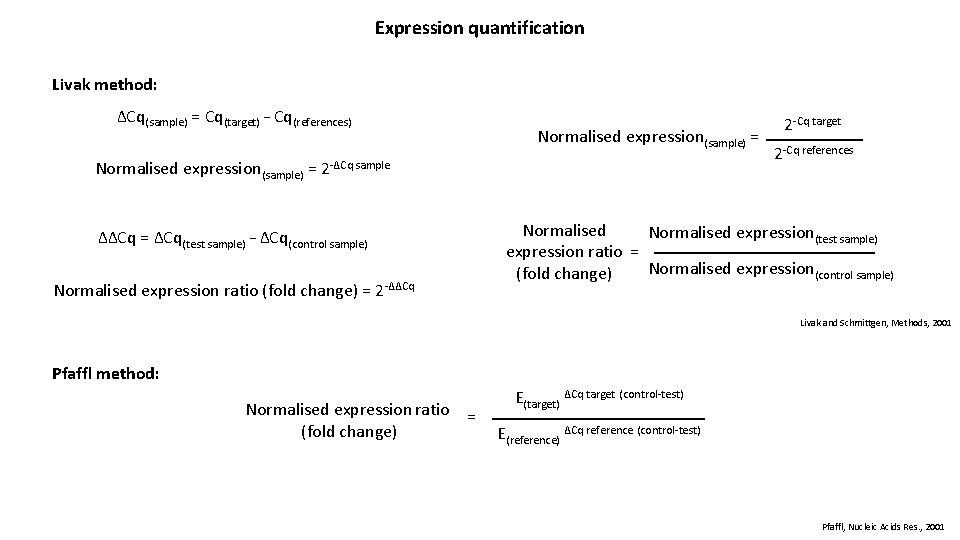
Expression quantification Livak method: ΔCq(sample) = Cq(target) – Cq(references) Normalised expression(sample) = 2 -ΔCq sample ΔΔCq = ΔCq(test sample) – ΔCq(control sample) Normalised expression ratio (fold change) = 2 -ΔΔCq 2 -Cq target 2 -Cq references Normalised expression(test sample) expression ratio = Normalised expression(control sample) (fold change) Livak and Schmittgen, Methods, 2001 Pfaffl method: Normalised expression ratio = (fold change) E(target) ΔCq target (control-test) E(reference) ΔCq reference (control-test) Pfaffl, Nucleic Acids Res. , 2001
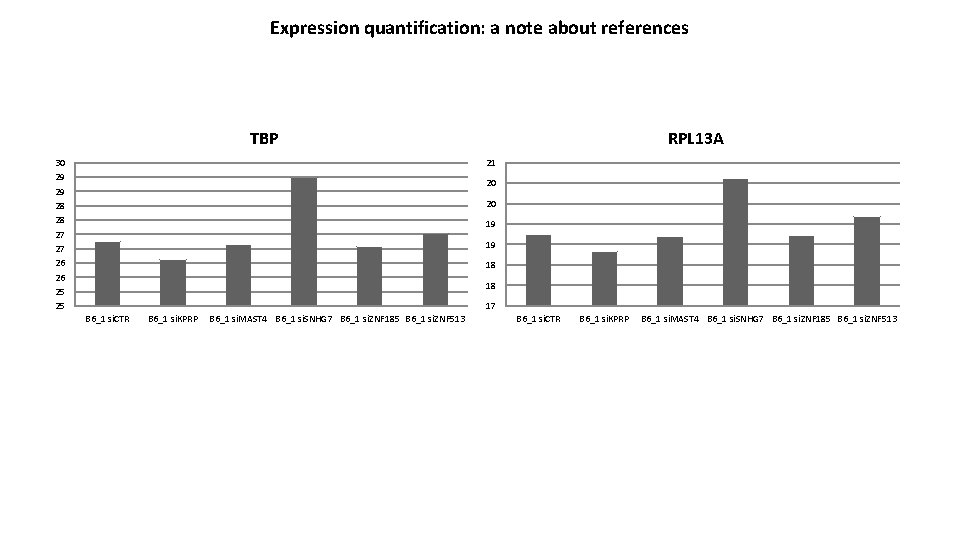
Expression quantification: a note about references TBP 30 29 29 28 28 27 27 26 26 25 25 RPL 13 A 21 20 20 19 19 18 18 17 B 6_1 si. CTR B 6_1 si. KPRP B 6_1 si. MAST 4 B 6_1 si. SNHG 7 B 6_1 si. ZNF 185 B 6_1 si. ZNF 513
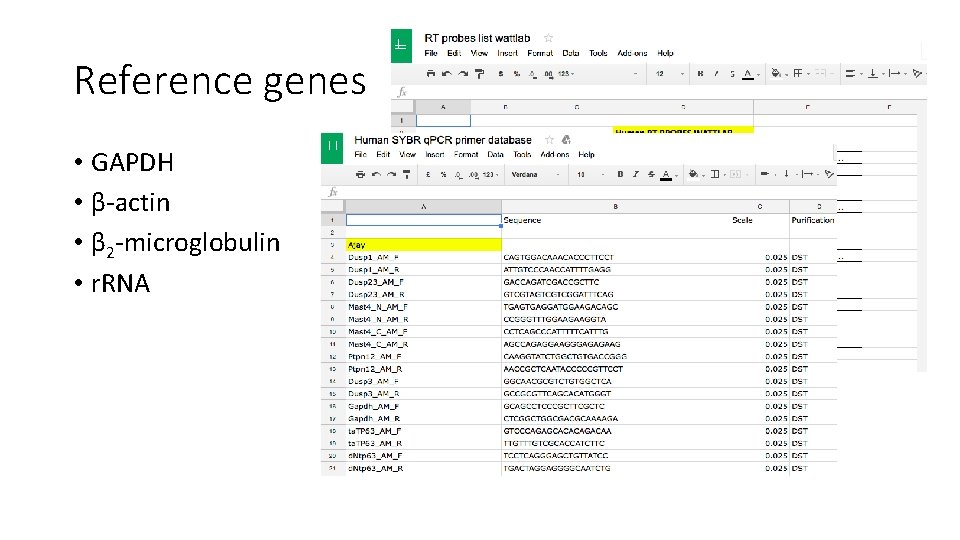
Reference genes • GAPDH • β-actin • β 2 -microglobulin • r. RNA
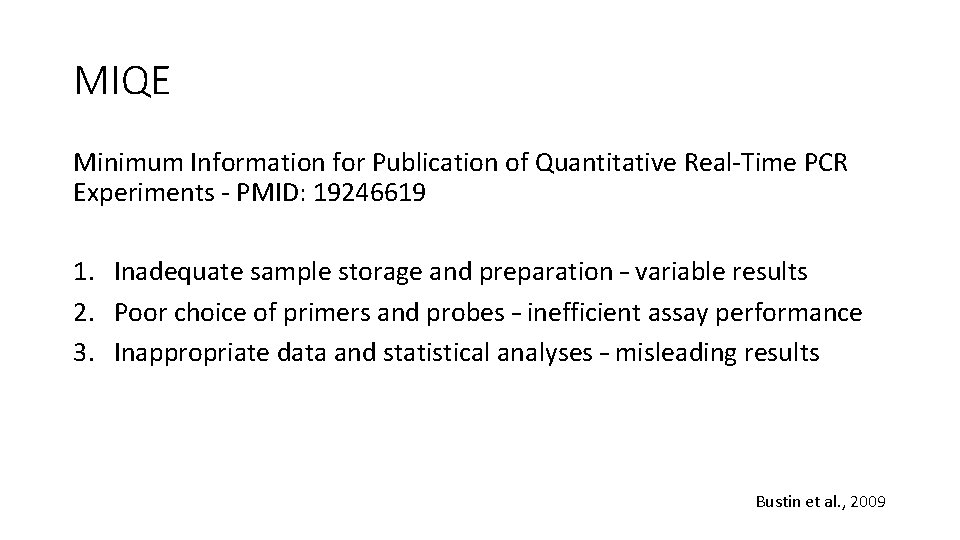
MIQE Minimum Information for Publication of Quantitative Real-Time PCR Experiments - PMID: 19246619 1. Inadequate sample storage and preparation – variable results 2. Poor choice of primers and probes – inefficient assay performance 3. Inappropriate data and statistical analyses – misleading results Bustin et al. , 2009
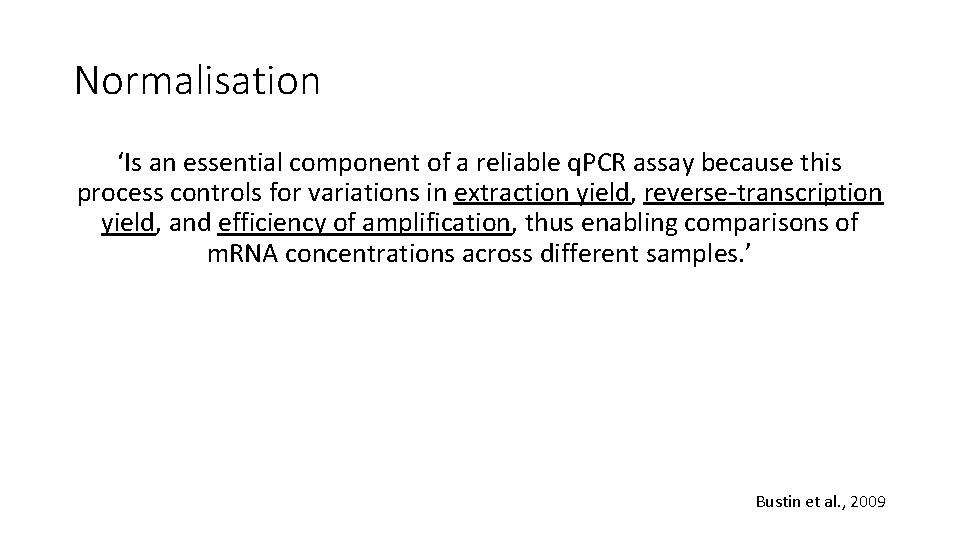
Normalisation ‘Is an essential component of a reliable q. PCR assay because this process controls for variations in extraction yield, reverse-transcription yield, and efficiency of amplification, thus enabling comparisons of m. RNA concentrations across different samples. ’ Bustin et al. , 2009
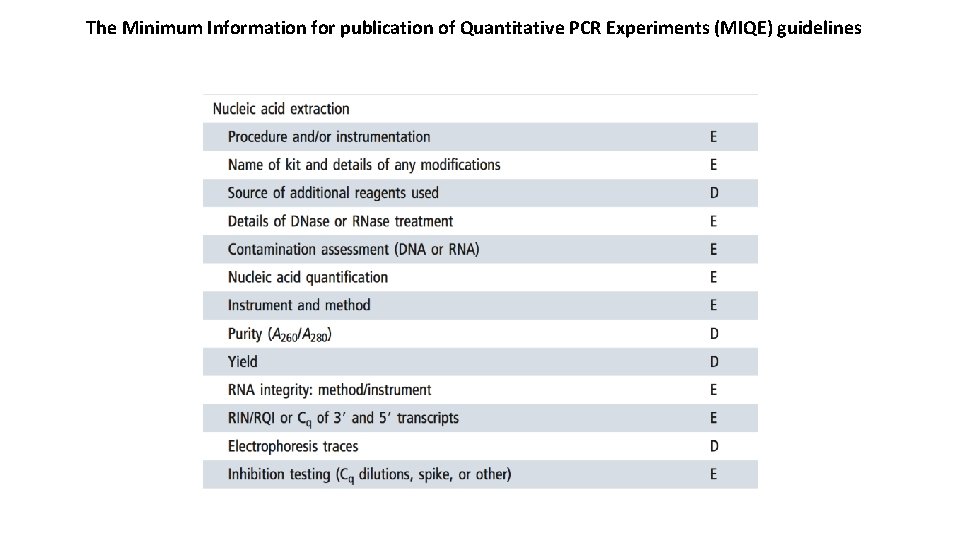
The Minimum Information for publication of Quantitative PCR Experiments (MIQE) guidelines
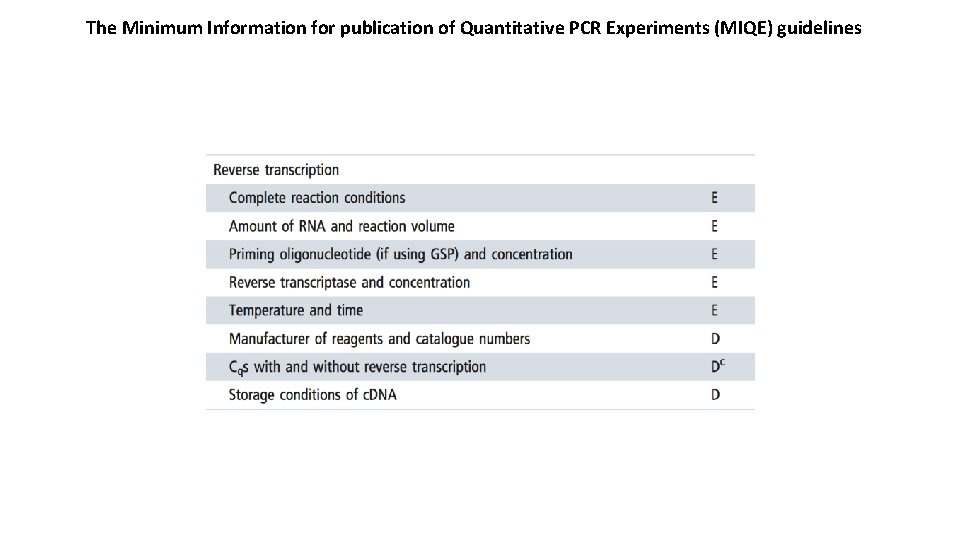
The Minimum Information for publication of Quantitative PCR Experiments (MIQE) guidelines
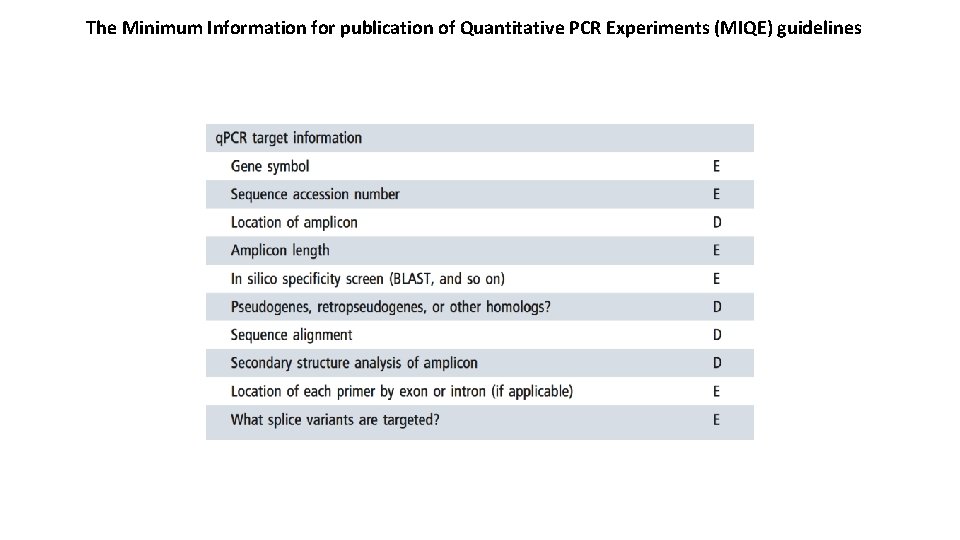
The Minimum Information for publication of Quantitative PCR Experiments (MIQE) guidelines
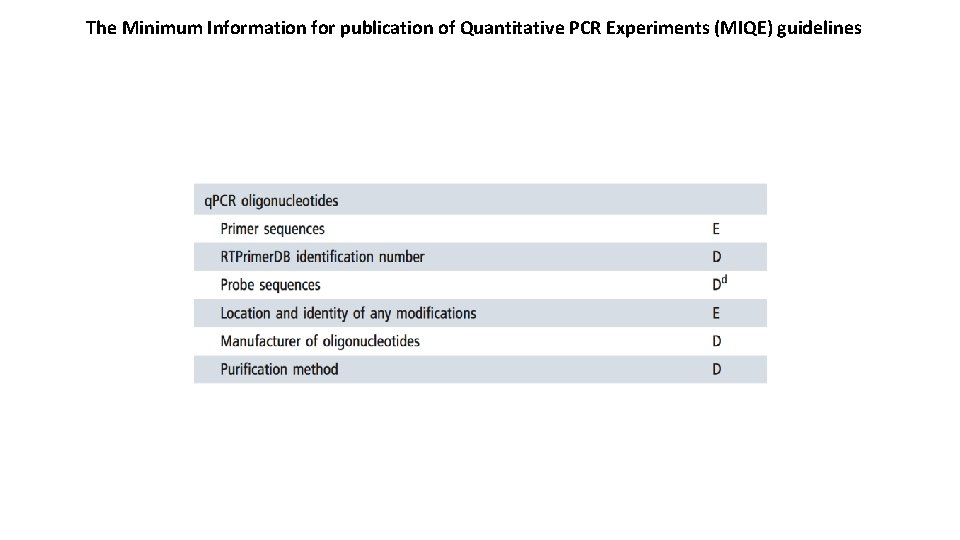
The Minimum Information for publication of Quantitative PCR Experiments (MIQE) guidelines
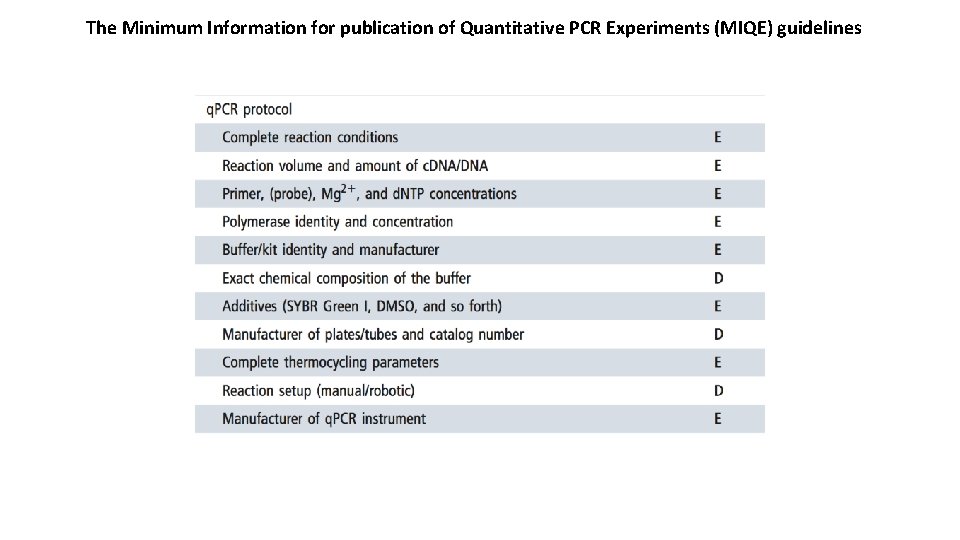
The Minimum Information for publication of Quantitative PCR Experiments (MIQE) guidelines
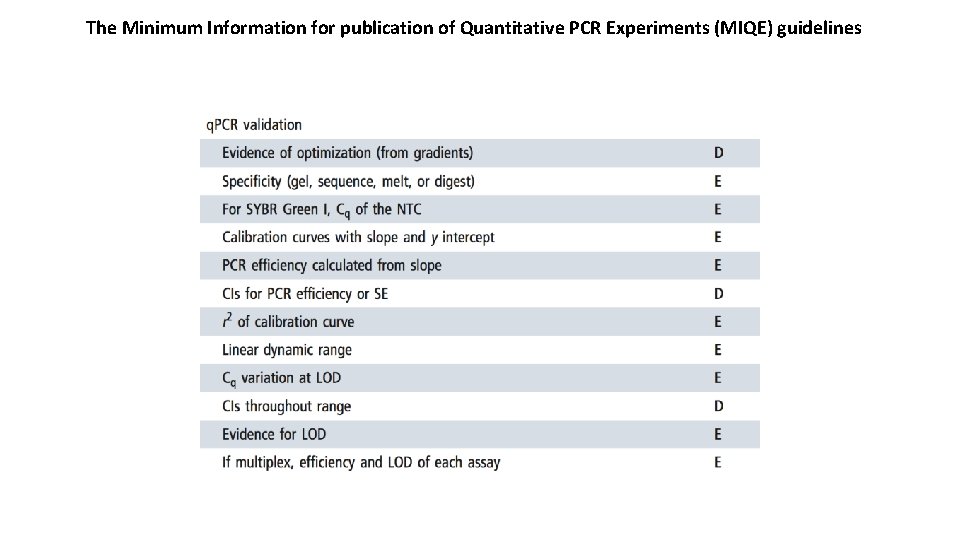
The Minimum Information for publication of Quantitative PCR Experiments (MIQE) guidelines
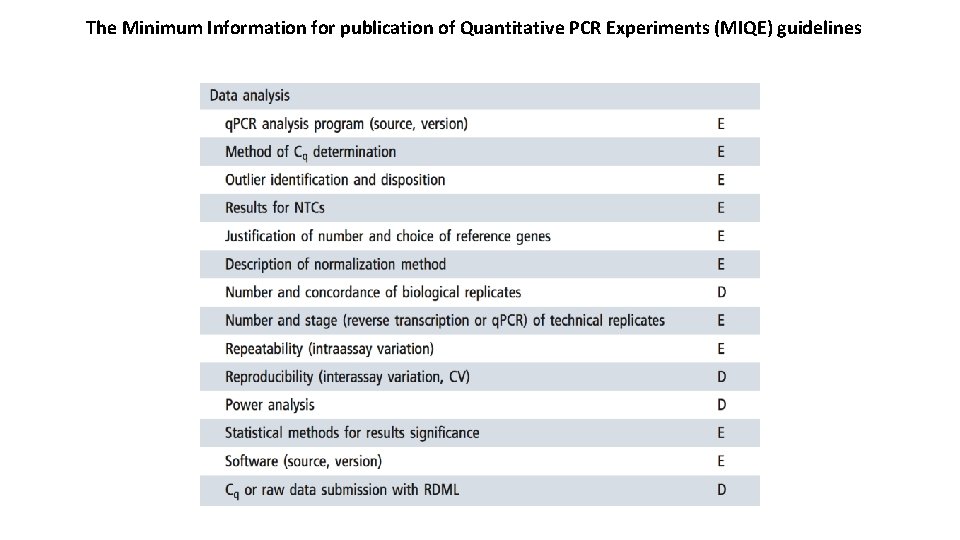
The Minimum Information for publication of Quantitative PCR Experiments (MIQE) guidelines
- Slides: 26