Pavement Thickness Evaluation Using Ground Penetrating Radar Dwayne


![Related Work Thickness Evaluation • [Berge et al, 1986] initial pavement thickness studies •](https://slidetodoc.com/presentation_image/3f590c9eaea76b071236612681218e50/image-9.jpg "Related Work Thickness Evaluation • [Berge et al, 1986] initial pavement thickness studies •")


 • Population Intersection • Split into 50 foot")


 within published range of 2. 36% to")


 within the published range of 2.")

- Slides: 74
Pavement Thickness Evaluation Using Ground Penetrating Radar Dwayne Harris P. E. L. P. G Presented for Final Exam
OUTLINE • • • Introduction Fundamentals of GPR Interpretation of GPR data Methodologies for Thickness Evaluation GPR Data Quality Validation of Methodologies
Introduction • Background on pavement thickness evaluation • Literature review
Why Use GPR? • Why is pavement thickness information useful? • What are the current methods for obtaining thickness information? • What are the advantages of using GPR for thickness evaluation?
Importance of Thickness Information • Pavement management • Pavement performance and remaining life estimates require knowledge of pavement thickness • Setting maintenance and rehabilitation priorities • Main input in overlay design
National Rehabilitation Year Urban Rural Interstates Roads Expenditures 1998 8. 69% Poor 3. 25% Poor 1. 42% Poor $36. 3 Billion 2003 7. 62% Poor 1. 64% Poor 0. 76% Poor $49. 3 Billion Change 1. 07% 1. 61% 0. 66% 36% [Hartegen, 2005]
INDOT • INDOT Major Moves $138, 483, 477 budgeted for 2006 resurfacing • Large percentage Mill and Fill rehabilitation where thickness of uppermost surface course important • Pavement thickness is needed for project level FWD structural analysis
Technologies Used for Pavement Thickness Evaluation • Core – Costly – Destructive – Provides a good ground truth record. • Falling Weight Deflectometer (FWD) – None Destructive • Ground Penetrating Radar – – Non Destructive Collected at Highway Speed Dense Coverage Heavy Post Processing
Related Work Thickness Evaluation • [Berge et al, 1986] initial pavement thickness studies • [Livneh and Siddiqui, 1992] mathematical model presented • [Fernando, 2000; Scullion and Saarenketo, 2002] automated interface identification • [Al-Quadi et al, 2005] model expanded to three or more layers
Literature Summary • There are multiple models available for pavement thickness evaluation – The model selected for this study is utilized for a large majority of the studies • Current literature suggests using semiautomatic data interpretation methodologies
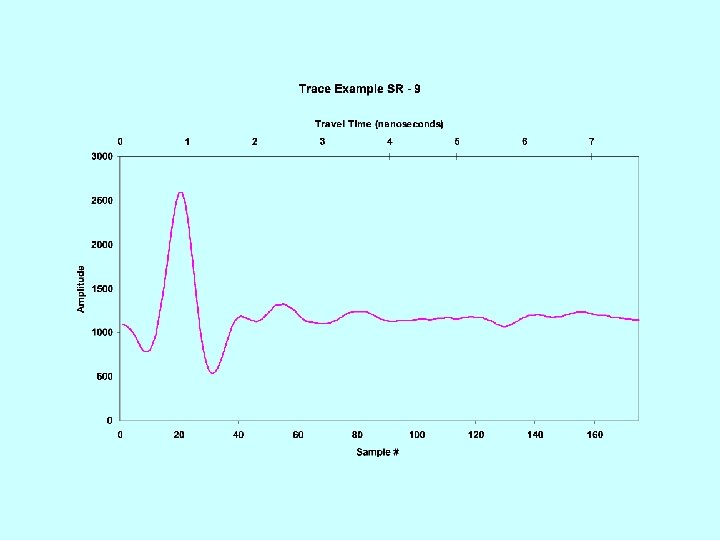
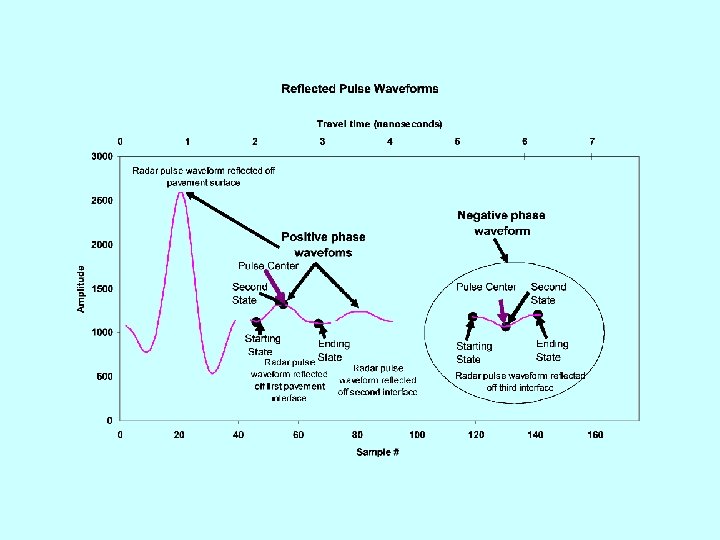
Fundamentals • GPR trace and waveforms and data presentations • Mathematical model
GPR Data B-scan
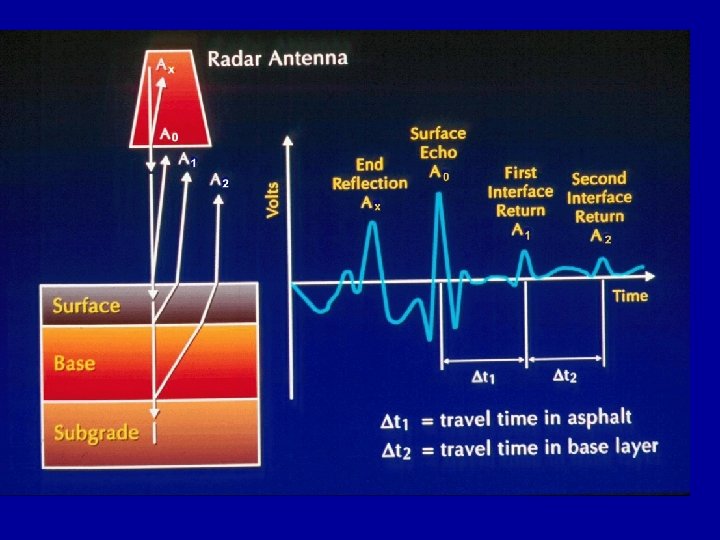
Simple GPR Thickness Model
EM Wave Propagation Velocity
Dielectric Calculation
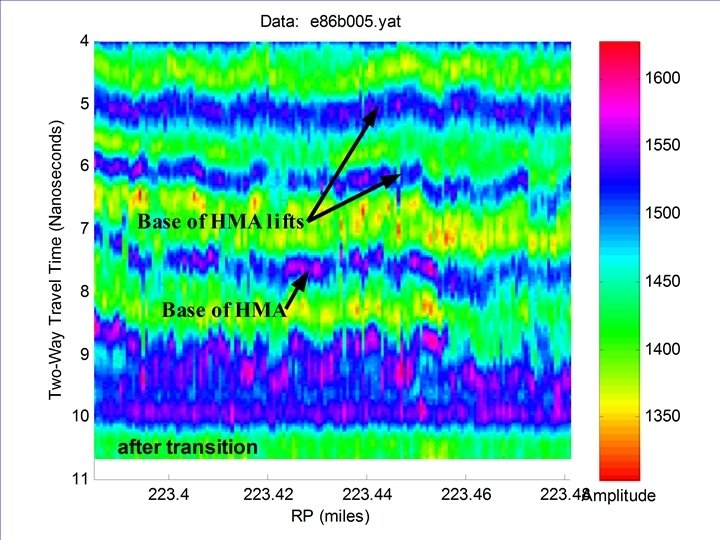
Principles of GPR Interface Interpretation An interface is defined as the anomaly in GPR data occurring when the reflected waveforms from a physical pavement boundary are contiguous for a group of sequential traces • • • The radar (EM) wave must propagate, to the interface and back. The radar wave must reflect off the interface with enough energy to be recorded. The interface must be identified in the GPR record.
Two Interface Case A
Two Interface Case B
Methodologies for Thickness Evaluation • Top layer methodology – Interfaces are identified in the data – Discontinuities are located in the data – Regional dielectric constants are determined – Thickness values are calculated for each mile – Enhanced to calculate thickness using dielectric constants from individual traces • Multiple Layer Methodology
Interface Selection
Regional Dielectric Constants
Thickness Calculation • Every thickness pick is assigned the respective regional dielectric value. • New Thickness Values Calculated. • Average value calculated for each mile.
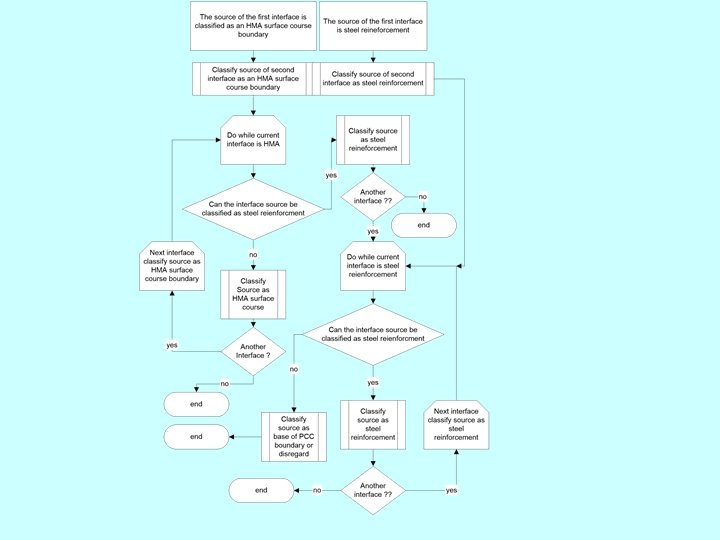
Multiple Layer Methodology • • • Determine the layers to be modeled Form data set of possible interfaces Select interfaces to be modeled Calculate thickness values Present the thicknesses in a visually acute format allowing for proper interpretation
Quality of GPR Data • Blunders – Improper waveform selection – Omitted pavement layers • Systematic errors – Travel time systematic error – Velocity systematic error • Random errors – Error propagation
I 65 Study Area
13 Inches HMA Over PCC
TERRA Interface Selection
Difference in Dielectric Constant and Thickness
Blunders • Improper waveform selection • Omitted pavement layers
Omitted Pavement Layers
Blunder Summary • Improperly selecting waveforms is a significant blunder source • Utilizing automated interface selection algorithm increased the likelihood of this blunder • Blunders are introduced when using the top layer methodology to evaluate thickness of pavement composed of multiple layers
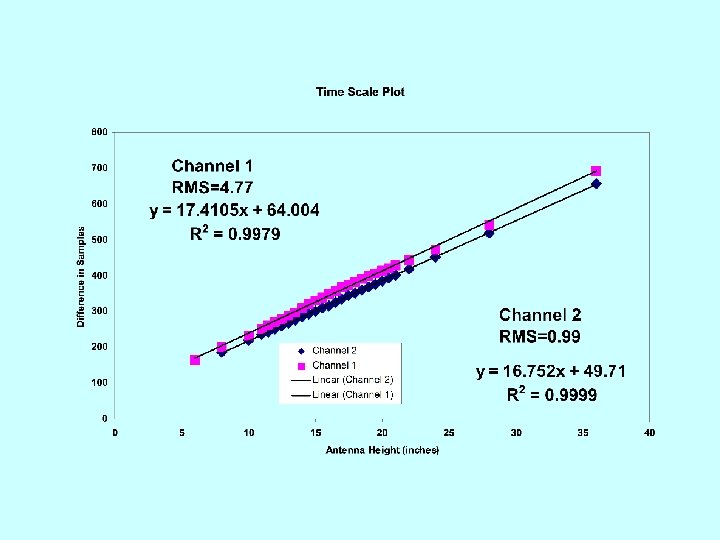
Systematic Error: Travel Time
Velocity Systematic Error
Random Error Propagation
Random Error Propagation
Systematic and Random Error Summary • Channel 1 data not used due to large systematic error is travel time • Velocity systematic errors propagate into thickness error • Amplitude random error propagates to about 1% relative thickness error
Validation of Methodologies • • • Comparison with 3 rd party Software Comparison of methodologies developed Thickness variation GPR thickness evaluation accuracy Network thickness study
Thickness Comparisons • Seven pavement sections of three interstates. • Pavement sections of three state roads • Five pavement sections of two interstates used for 3 rd party comparison
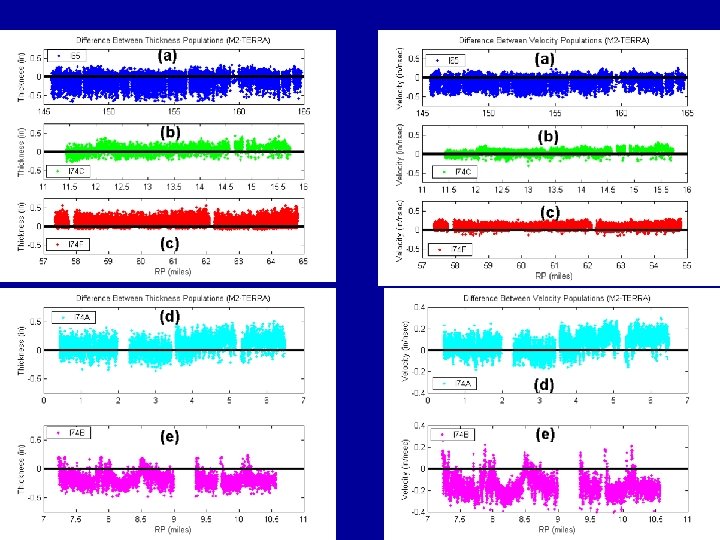
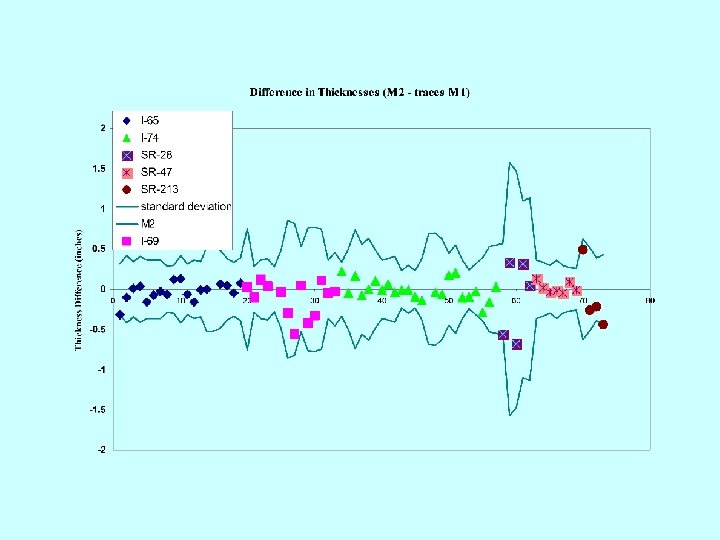
Statistical Analysis (TERRA & M 2) • Population Intersection • Split into 50 foot subsections some populations split into 25 foot subsections • Normality and T-test analysis all 50 foot subsections containing at least 10 samples • Explanation of T-test results
I-65 T-test 8% Rejected Worst Case Best Case
I-74 Fn T-test 72% Rejected Best Case Worst Case
T-test Explanation
Summary M 2 TERRA Comparison • 90% of the M 2 and TERRA populations have the same variance (alpha=95%) • 98% of the M 2 and TERRA populations for I-65 have the same mean (alpha=99%) • 28% of the M 2 and TERRA populations for I-74 F have the same mean
Methodology Comparisons • Difference in sample size • Difference in velocity calculation by use of regional dielectric constant
Thickness Variation Section Number Mean STD CV I-65 25, 672 4. 62 0. 44 9. 45% I-69 41, 108 6. 48 0. 57 8. 72% I-74 A 16, 587 6. 67 0. 54 8. 10% I-74 B 8, 810 3. 74 0. 40 10. 67% I-74 C 15, 704 4. 97 0. 34 6. 93% I-74 D 14, 250 7. 27 0. 58 7. 94% I-74 F 21, 427 6. 90 0. 54 7. 81% SR-47 32, 260 5. 70 0. 39 6. 78% SR-213 6, 233 6. 18 0. 47 7. 65% SR-28 20, 670 6. 66 1. 36 20. 49% Average 9. 45% Average* 8. 23%
Published CV values Study CV LTPP HMA 6. 83% to 12. 66% LTPP PCC 2. 36% to 5. 19% NCDOT HMA 25% to 38%
Reported Accuracies of GPR Thickness Estimates REPORT Accuracy Kansas DOT 7. 5% - 10% SHRP 8% Minnesota DOT 3% - 6. 5% Missouri DOT 4% - 11. 3% Kentucky DOT 5. 82% - 165. 04%
Case Study Results Study I-65 12 Inch Concrete 13 Inch HMA 7. 5 Inch HMA US 41 North HMA Concrete SR 32 E HMA Accuracy 4. 5% 2. 0% 13. 2% 8. 8%, 5. 2% 8. 8% 16. 6%
Accuracy/CV Results • Study CV (8. 23%) within published range of 2. 36% to 38% • Study absolute accuracy range (2% to 16. 6%) in within published range of 3% to 23. 4%
Network Thickness Evaluation • A majority of the INDOT interstate system is 25 inches thick with an uppermost surface course thickness of 5 to 7 inches of HMA. • GPR provided reasonable estimates of the uppermost surface course thickness • FWD provided reasonable estimates of the pavement structure thickness
Conclusions Top Layer Methodology • Provides efficient acceptable thicknesses for the uppermost pavement surface course • The decreased sample size utilized by the method does not negatively impact the average thickness estimate • The use of the regional dielectric constant is acceptable when properly applied
Conclusions Multilayer Methodology • The methodology provides accurate pavement thicknesses for multilayer pavements • The expanded visualization tools help prevent interface interpretation blunders • The thicknesses of the uppermost surface layer agree well with the TERRA check values
Conclusions Blunders • There are many sources of interface interpretation blunders. • Likelihood of interface interpretation blunders increases when automated interface selection and tracking algorithm • The process of evaluating pavement thickness with GPR has not progressed to the point of eliminating a trained GPR interpreter
Conclusions Systematic and Random Errors • The GPR systems amplitude instability propagates into thickness errors. • The travel time nonlinearity of channel 1 precludes interpretation of GPR data collected using the channel. • Random amplitude error introduces about 1% relative thickness error
Conclusions Accuracy/CV Results • Study CV (8. 23%) within the published range of 2. 36% to 38% • Study absolute accuracy range (2% to 16. 6%) within published range of 3% to 23. 4%
Recommendations • INDOT should continue implementing GPR for pavement thickness evaluation • Cores should be extracted when possible to aid with interpretation • Applications of GPR for further forensic analysis should be further explored.