GROUND PENETRATING RADAR Team members Tangee Beverly and

GROUND PENETRATING RADAR Team members: Tangee Beverly and Anissa Norman Mentor: Derek Morris and Austin Ivins
 uses pulses of radar and reflected singles to collect")
Abstract Ground Penetrating Radar (GPR) uses pulses of radar and reflected singles to collect images of the subsurfaces. These images return to the receiver and store data on digital media. The computer can measure the time it takes for the signal to reach object/target and return back again. These are reflected signals are interpreted by the system and then displayed on the GPRs LCD screen. The purpose of this research was to gain a better understanding of the uses and methods involving ground penetrating radar, and to experience the situations in which GPR can be a useful and effective tool. For the data analysis part of the GPR it is important to know that the waves travel through various materials including soil, concrete, and debris, etc. All of these things have different dielectric and conductive properties that affect the GPR waves and the way that the data is interpreted. For the data that is shown on the GPR LCD screen, it takes someone with good field experience to interpret them and determine what was found. One most important question ask about the GPR is how deep can the signals go? When it comes to GPR the depth range can be determined depending on the subsurface material and the frequency of the GPR antenna.

Objective The goal of this research was to become experienced in the methods and practices involved with ground penetrating radar, and to gain a better understanding of the situations in which GPR can be a useful and effective tool. Operating the system in front of the Dixon Hall building also presented a great opportunity to examine features that may lie beneath the ground between the building and the parking lot.

Area of Interest In front of Dixon Hall, Elizabeth City • Elizabeth City State University, in front of Dixon hall • Between the building and parking lot was used to collect data. • The purpose of the area was due to the likelihood of finding power lines and water mains between the road and building

In front of Dixon Hall

Equipment The SIR 3000 is a small, lightweight system designed for single-user operation. This product provides the essential features and flexibility that experienced GPR users require, as well as simplified, application-specific user interfaces for inexperienced GPR users. The SIR 3000 incorporates advanced signal processing and display capability for ‘inthe-field’ 3 D imaging. Unlike other data acquisition products on the market, the SIR 3000 is interchangeable with all GSSI antennas, making it an affordable and flexible option for multi-application users.

How deep can the signals go? GPR the depth range can be determined depending on the subsurface material and the frequency of the GPR antenna. For locating materials in the concrete higher frequency GPR is used because those objects require higher resolution. This higher frequency is at 1000 MHz. when the frequency is this high it will give a high-resolution detail for depth of approximately 24 inches. For applications that require deeper penetration into the ground a lower frequency will be needed which ranges from about 12. 5 to 500 MHz depending on the subsurface material. but for all subsurfaces depth range can be a few inches to thousands of feet.

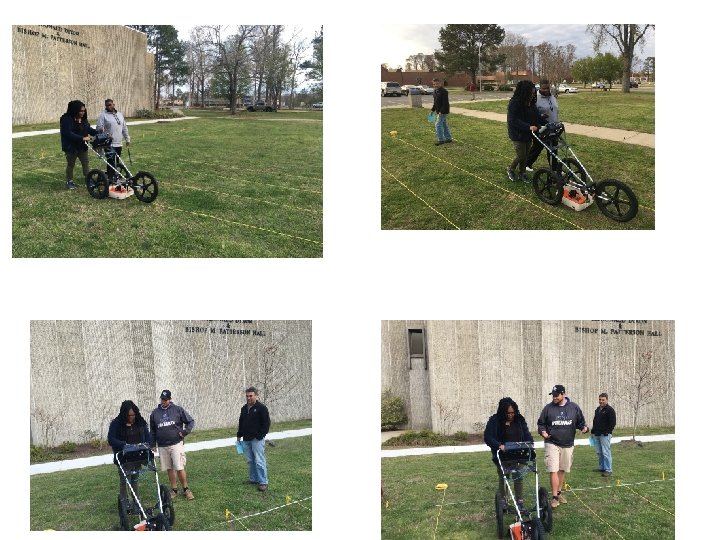
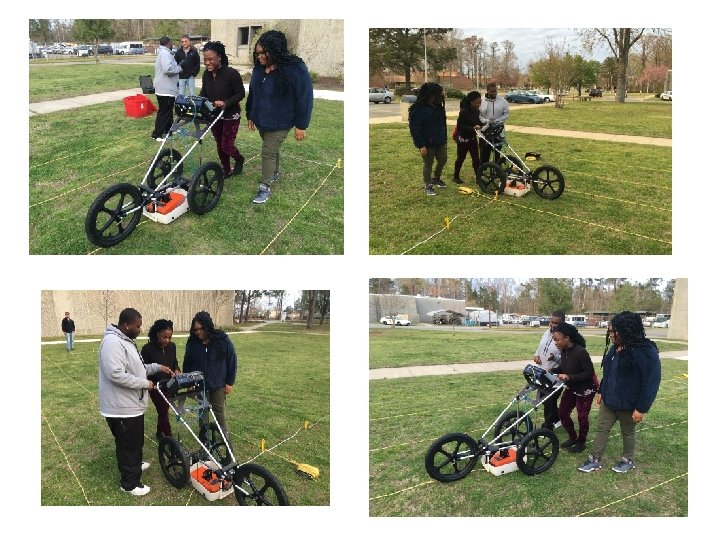
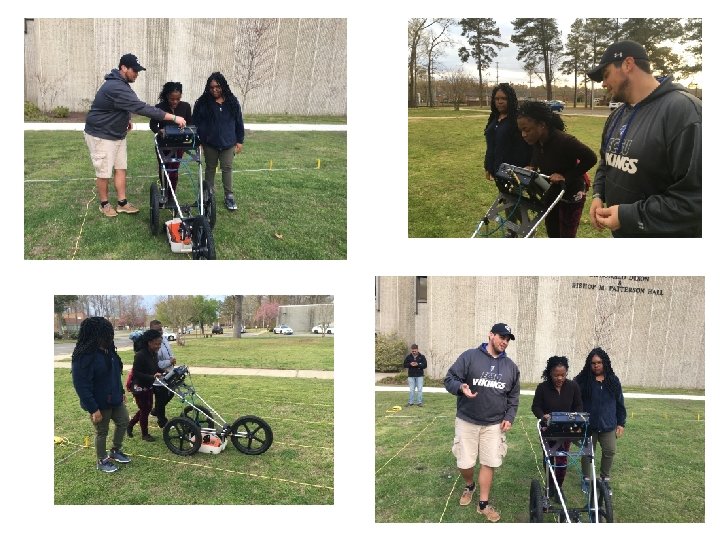
Testing the GPR
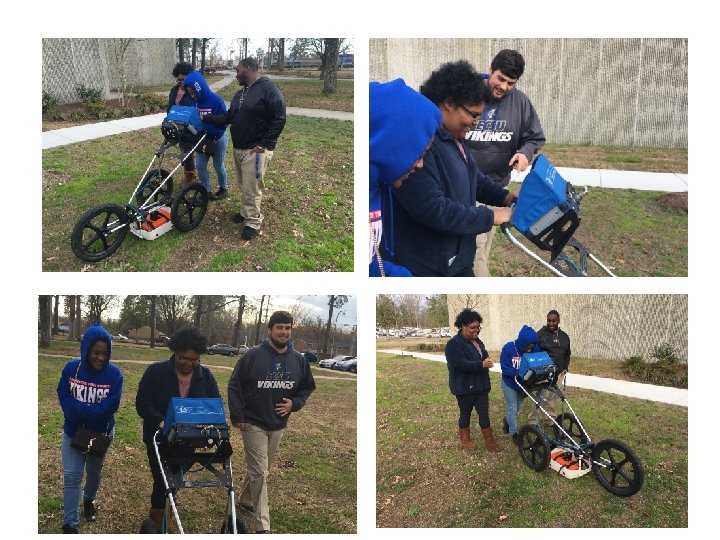

Methodology To ensure accurate data collection the grid needs to be square so we first laid out a triangle with the Pythagorean theorem. After establishing the grid the system requires a soil type input, at the time of data collection the soil was a mix of silt (moist) and Clay(dry) which was input into the system as type 2 soil. Once all inputs were selected for data collection the system was ready to begin collection.

Results After completing 20 scans along the collection area, the team documented and saved the transects. From there we pulled the data from GPR and saved it to jump drive. The images we collected were uploaded a laptop with windows 7 and the Radan program in order to create 3 D images. Unfortunately, there was a malfunction with the system prevented for the research team to create a 3 D image. Using various color tables, we were able to highlight abnormalities in the soil which we believed to be objects beneath the surface. However without exact blueprints of the location or excavation it difficult to say exactly what the system found.

Future Work In future studies the team agreed it would be more beneficial to scan an area the team had permission to excavate in order to confirm or deny the readings the system generated. Next time, created a 3 D image of what is underneath the ground.

Acknowledgments The team would like to recognize Dr. Linda Hayden for her continued efforts in the CERSER organization and Mr. Clay Swindell for his consult on various GPR methods and practices.

Questions?
- Slides: 17