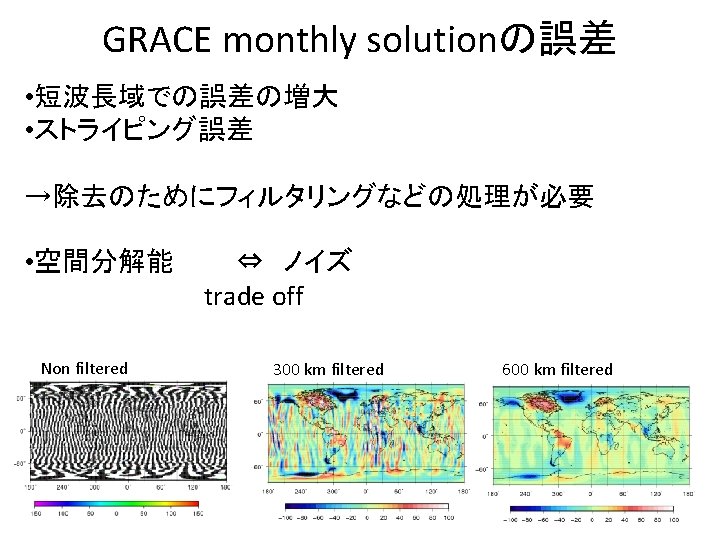
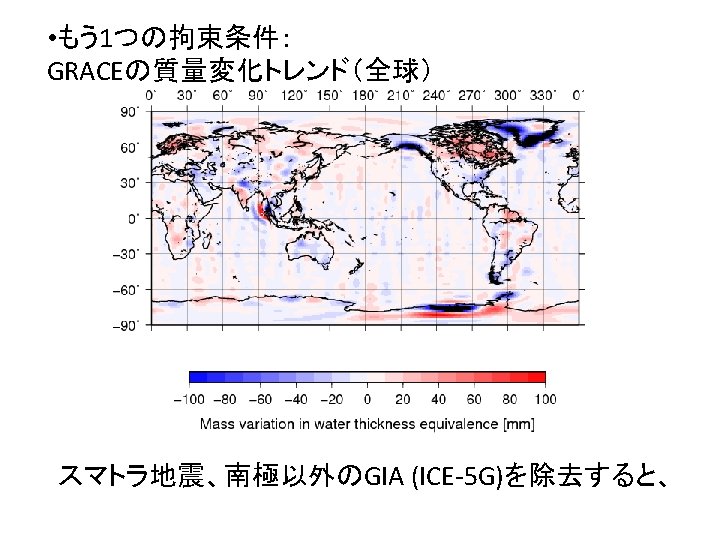
GRACE Jan to Dec 2006 Water Equivalent Thickness
![GRACEから見た質量変化 (Jan to Dec 2006) : Water Equivalent Thickness [mm]](https://slidetodoc.com/presentation_image_h/8cedcd6c86f83331028aa7c991e30a65/image-6.jpg "GRACEから見た質量変化 (Jan to Dec 2006) : Water Equivalent Thickness [mm]")

 井戸水位 120× 120 km(UTM-east_600 -720 km、UTM-north_1480")
との比較 JLG modelのインプット: JMA Climate Data Assimilation System (JCDAS) (大気客観解析データ ) Red: GRACE")

 http: //pangea. stanford. edu/courses/gp 025/webbook/08_tectonics. html")
 IJ 05")


- Slides: 28
GRACEから見た質量変化 (Jan to Dec 2006) : Water Equivalent Thickness [mm]
陸水の年周変化 -GRACEからもっともよく観察できるシグナルの1つ Comparison of GRACE data with global landwater model ( JRA-JCDAS LDA and GRive. T (JLG) model ) → phase difference ~ 1 month
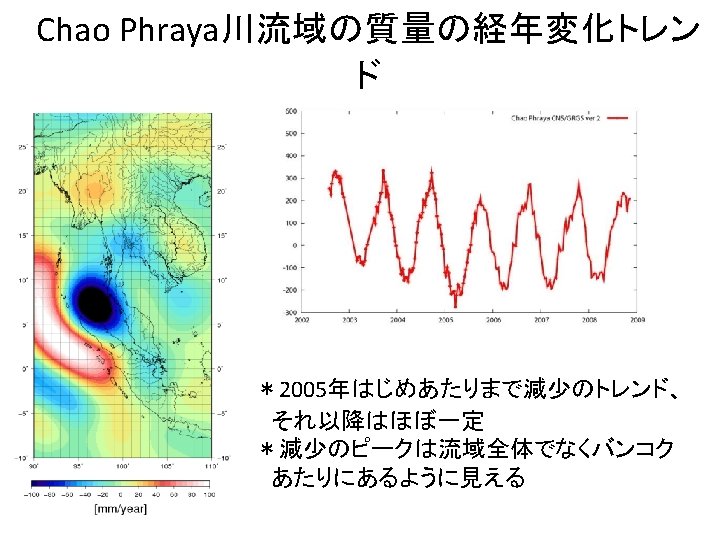
70 x 70 km(UTM-east_640 -710 km、UTM-north_1490 -1560 km) 井戸水位 120× 120 km(UTM-east_600 -720 km、UTM-north_1480 -1600 km) 地下水貯留量、井戸水位とも2002年以降に回復傾向 →GRACEトレンド(peak pointで約50 mm/yr)は被圧帯水層の地下水
グローバルな水文モデル (JLG)との比較 JLG modelのインプット: JMA Climate Data Assimilation System (JCDAS) (大気客観解析データ ) Red: GRACE Blue: Model (Total TWS) →The trend caused by large-scale meteorological or climatological factors.
GRACEから観測された グローバルスケールの質量移動 Red: 北半球 Green: 南半球 Variations of total mass of Northern and Southern Hemisphere
Glacial Isostatic Adjustment (GIA) http: //pangea. stanford. edu/courses/gp 025/webbook/08_tectonics. html
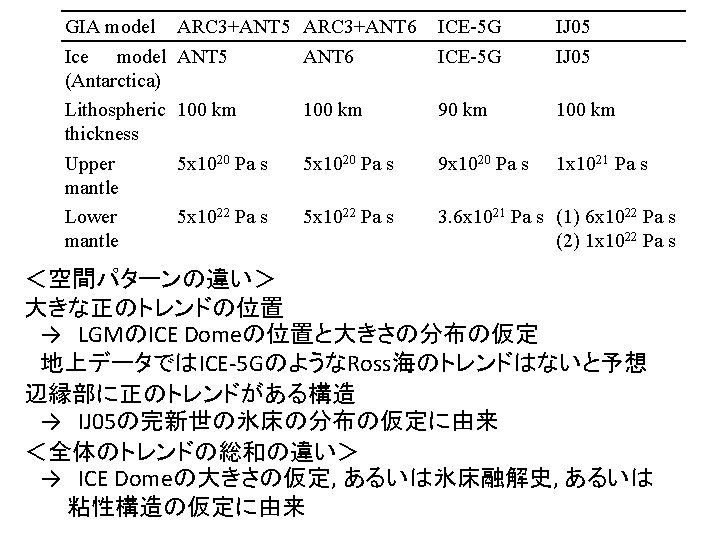
• 南極におけるGIAモデル 広域での地上観測の難しさなどの原因により、他の地域のモデル より、精度が低く、モデル間のばらつきも大きい。 ICE-5 G (Paulson et al. , 2007) IJ 05 (Ivins, 2009) ARC 3+ANT 5 (Nakada et al. , 2000) ARC 3+ANT 6 (Nakada et al, 2000) Mass change [mm/yr in Water Thickness Eq. ], up to degree/order 50
• GIAモデルとの比較 ICE-5 G 162 Gt IJ 05 4 Gt ARC 3+ANT 5 99 Gt ARC 3+ANT 6 40 Gt 151 Gt
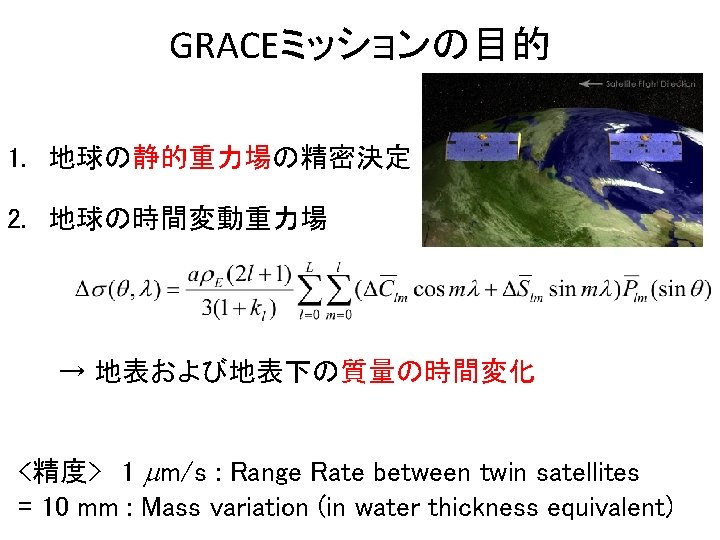
Summary • GRACE satellite gravity data → Mass variation on and beneath the Earth surface • Observed data by GRACE → Vertical integration of mass variation • Spatial resolution of monthly solution → About 200 – 300 km → useful for the study of global to regional scale landwater variation