Metocean parameters for portions of the Chukchi and

- Slides: 57
Met-ocean parameters for portions of the Chukchi and Beaufort Seas A Metzger
Background Ambitions for Offshore Development in the Arctic No precedent in Chukchi and Beaufort How to design an offshore structure in the region? Design standards – were nonexistent Engineering design criteria A great deal of data Not much information for engineers
Background Ambitions for Offshore Development in the Arctic Development of a normative document ISO 19906 Standard: Petroleum and Natural Gas Industries – Arctic Offshore Structures API: RPN 2 document
Background ISO 19906 Standard: Petroleum and Natural Gas Industries – Arctic Offshore Structures Reliability-based design standard High probability of non-exceedance Offshore environmental demands
Background Environmental demands – arctic; offshore ISO 19906 provides reference tables [see ISO]
Background Environmental demands – arctic; offshore ISO 19906 provides reference tables Not in a reliability format User of ISO 19906 must determine their own values for design
Background Environmental demands – arctic; offshore User of ISO 19906 must provide their own values for design Industry conducted extensive field campaigns Multiple seasons. Tremendous cost and effort Collected a large amount of data Technically proprietary However, a large amount was released Raw data
Background Environmental demands – arctic; offshore User of ISO 19906 must provide their own values for design Regulatory agencies Permit review Oversight Do not have the resources available to industry Needed a basis for diligent review and oversight
Background Environmental demands – arctic; offshore User of ISO 19906 must provide their own values for design a basis for diligent review and oversight A great deal of data and scientific information exists Not [necessarily] in a format consistent with the Normative Available data/ information is dispersed
Background Environmental demands – arctic; offshore Purpose of this effort Collate readily available met-ocean data Provide bulk statistics Quick-reference material for regulators
Approach A. Acquire readily available meteorological and oceanographic data for the region i. Physical measurements ii. Satellite-derived data not considered iii. Output from modeling not included
Approach B. Narrative for each source E. g. : Prudhoe Bay. csv Date uploaded 1/15/2015. Organized as follows: Year, Month, Day, Hour (UTC), Minute, Latitude (N), Longitude (E), Elevation (m), Temperature (deg C), Dew Point (deg C), Relative Humidity (%), Wind Speed (m/s), Wind Direction (deg), Station Pressure (h. Pa), Sea-Level Pressure (h. Pa), Altimeter (in Hg), Downward Shortwave Radiation (W/m^2), Downward Longwave Radiation (W/m^2), 1 Hour Accumulated Precipitation (mm), 6 -Hour Precipitation (mm), 24 -Hour Precipitation (mm), Snow Depth (cm) Note: Values of -999 are NULL
Approach Data vetted by regional subject matter experts C. D. i. Meterological – Oceana Francis (UH Manoa) ii. Oceanographic – Akk. A, LLC (Peter Winsor; Hank Statscewich) Individual records were coded i. Converted to common file type: . csv TYYYYMMSSS 0000 Description: T data type: M = meteorological; O = oceanographic; S = Sea-ice YYYY Year data collection was completed (a sample of data may cross into an adjacent year; sets of data should not cross multiple years) MM Month data collection was completed (or month at end of data set); 01, 02, 03, …. 10, 11, 12 SSS three-letter code for instrument used to collect data; e. g. , satellite (sat); Buoy (buo), RDCP (rdc), ADCP (adc) etc. 0000 letter/number to designate the origin, project, campaign, source, etc. ; make sure all four spaces have a letter or number; fill in unused spaces with 0 s. It will be helpful to elaborate on these letters/ numbers in the data narrative.
Approach E. F. Preliminary statistical survey i. Secondary vetting ii. Spurious data removed Bulk statistics E. Histograms F. Rose plots G. Pdf fits H. Extreme quantiles
Approach A. B. meteorological data sets i. Beaufort: 28 records ii. Chukchi: 20 records iii. Each record: A few months to several years iv. Years 1999 to 2014 v. Cut off at ~1999 oceanographic data sets i. 57 records of oceanographic parameters + ii. Wave records: 7 records for Chukchi; none for Beaufort
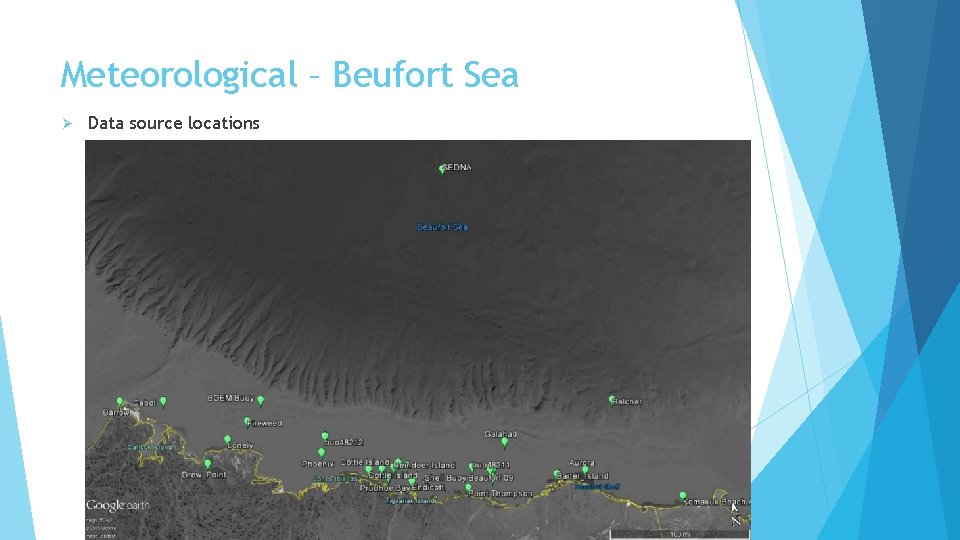
Meteorological – Beufort Sea Ø Data source locations
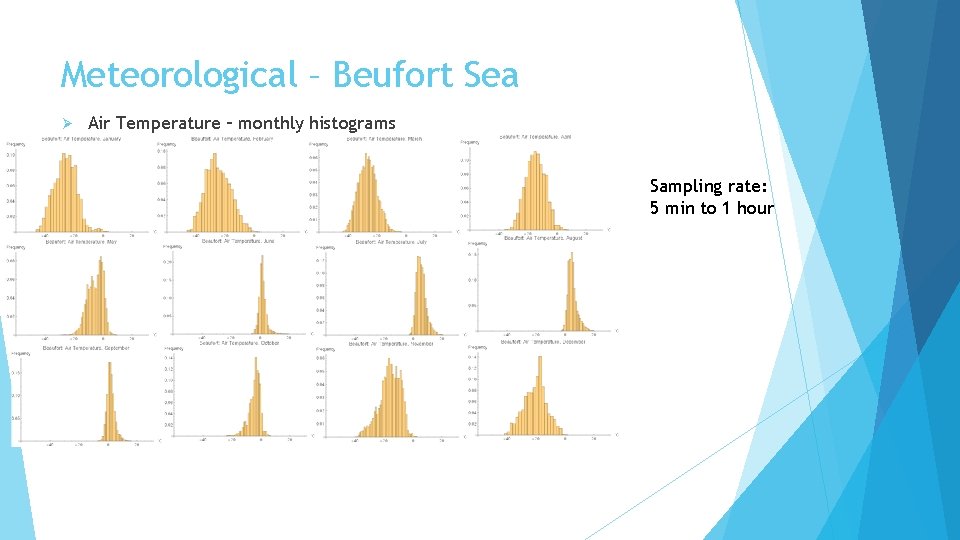
Meteorological – Beufort Sea Ø Air Temperature – monthly histograms Sampling rate: 5 min to 1 hour
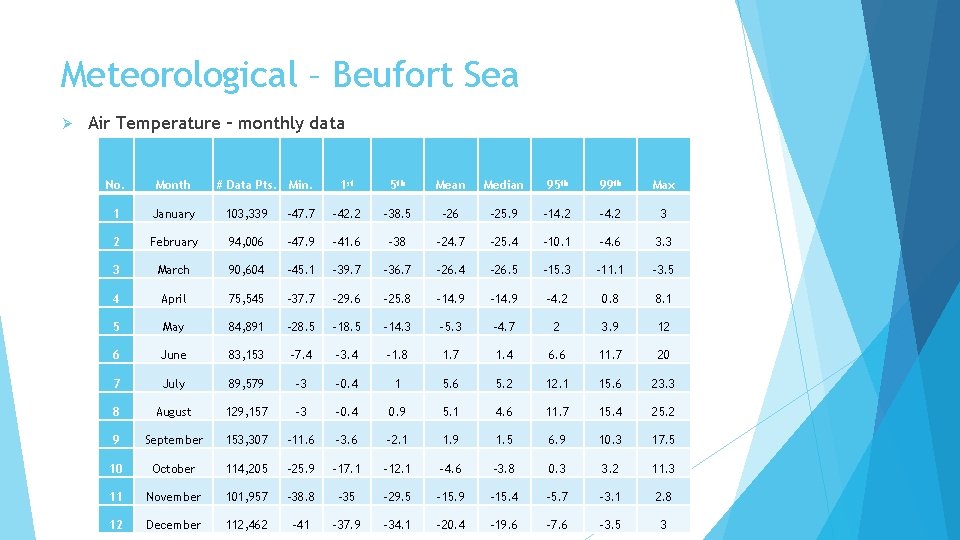
Meteorological – Beufort Sea Ø Air Temperature – monthly data No. Month # Data Pts. Min. 1 st 5 th Mean Median 95 th 99 th Max 1 January 103, 339 -47. 7 -42. 2 -38. 5 -26 -25. 9 -14. 2 -4. 2 3 2 February 94, 006 -47. 9 -41. 6 -38 -24. 7 -25. 4 -10. 1 -4. 6 3. 3 3 March 90, 604 -45. 1 -39. 7 -36. 7 -26. 4 -26. 5 -15. 3 -11. 1 -3. 5 4 April 75, 545 -37. 7 -29. 6 -25. 8 -14. 9 -4. 2 0. 8 8. 1 5 May 84, 891 -28. 5 -14. 3 -5. 3 -4. 7 2 3. 9 12 6 June 83, 153 -7. 4 -3. 4 -1. 8 1. 7 1. 4 6. 6 11. 7 20 7 July 89, 579 -3 -0. 4 1 5. 6 5. 2 12. 1 15. 6 23. 3 8 August 129, 157 -3 -0. 4 0. 9 5. 1 4. 6 11. 7 15. 4 25. 2 9 September 153, 307 -11. 6 -3. 6 -2. 1 1. 9 1. 5 6. 9 10. 3 17. 5 10 October 114, 205 -25. 9 -17. 1 -12. 1 -4. 6 -3. 8 0. 3 3. 2 11. 3 11 November 101, 957 -38. 8 -35 -29. 5 -15. 9 -15. 4 -5. 7 -3. 1 2. 8 12 December 112, 462 -41 -37. 9 -34. 1 -20. 4 -19. 6 -7. 6 -3. 5 3
Meteorological – Beufort Sea Ø Air Temperature – monthly quantiles
Meteorological – Beufort Sea Ø Average Freezing/ Thawing Degree Days - monthly
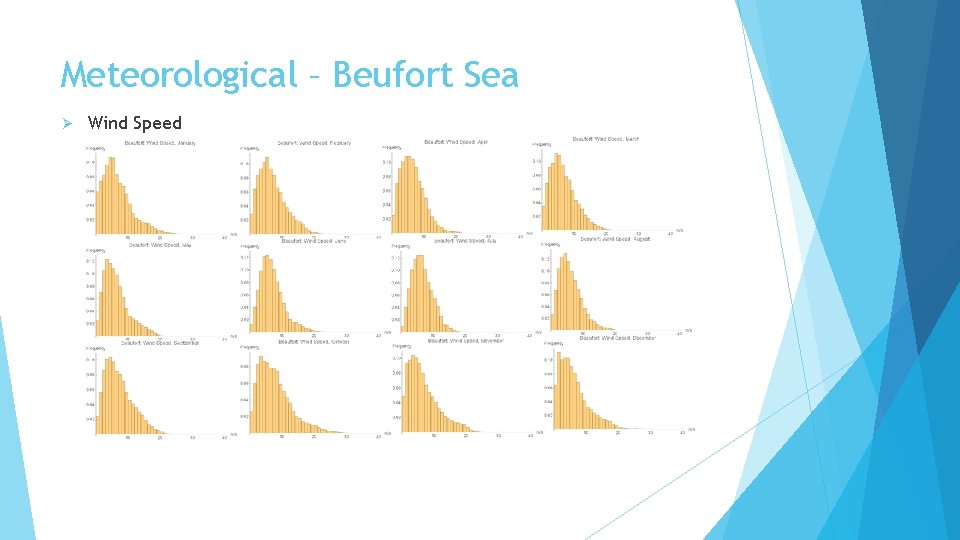
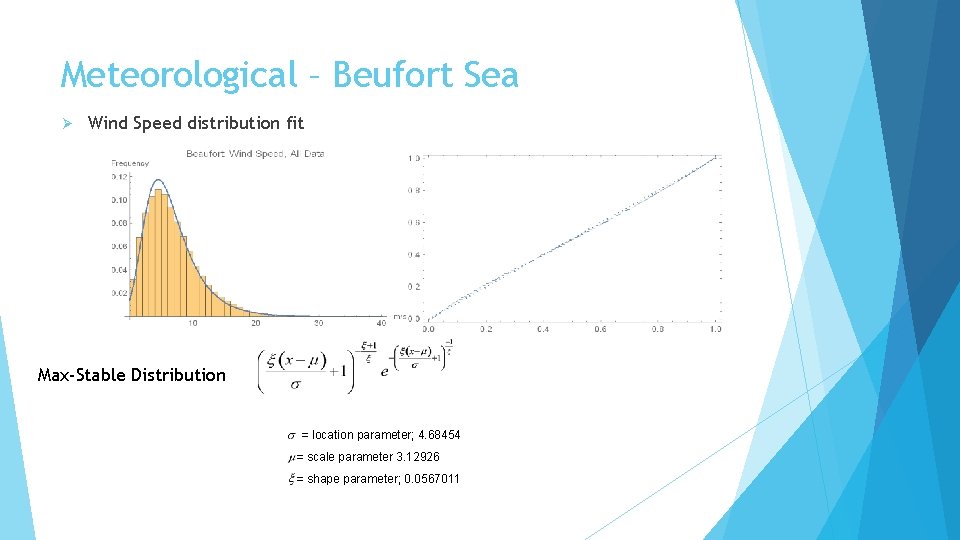
Meteorological – Beufort Sea Ø Wind Speed
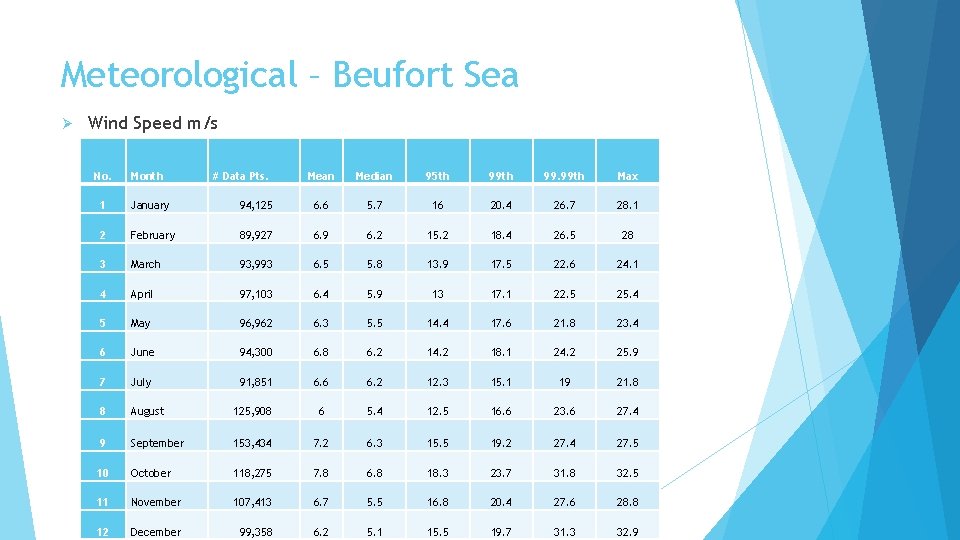
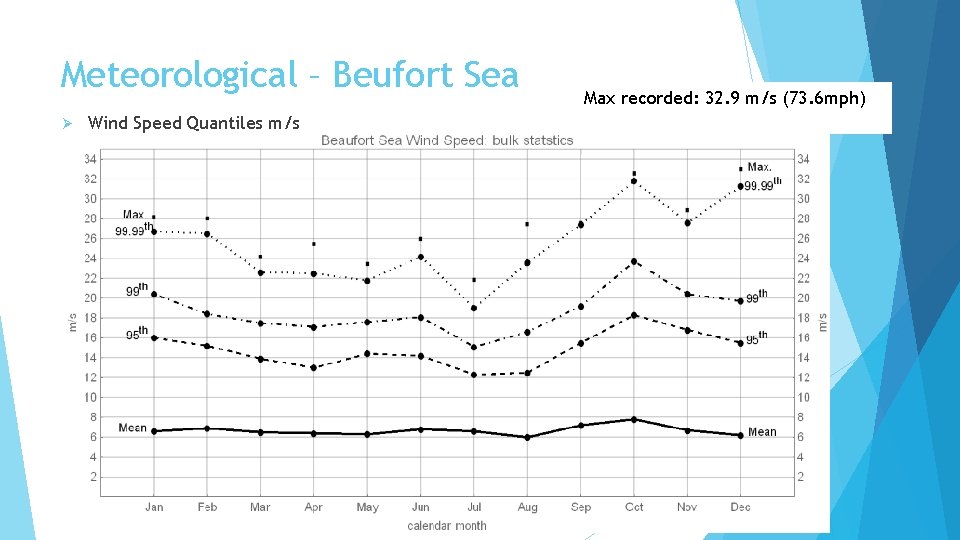
Meteorological – Beufort Sea Ø Wind Speed m/s No. Month # Data Pts. Mean Median 95 th 99. 99 th Max 1 January 94, 125 6. 6 5. 7 16 20. 4 26. 7 28. 1 2 February 89, 927 6. 9 6. 2 15. 2 18. 4 26. 5 28 3 March 93, 993 6. 5 5. 8 13. 9 17. 5 22. 6 24. 1 4 April 97, 103 6. 4 5. 9 13 17. 1 22. 5 25. 4 5 May 96, 962 6. 3 5. 5 14. 4 17. 6 21. 8 23. 4 6 June 94, 300 6. 8 6. 2 14. 2 18. 1 24. 2 25. 9 7 July 91, 851 6. 6 6. 2 12. 3 15. 1 19 21. 8 8 August 125, 908 6 5. 4 12. 5 16. 6 23. 6 27. 4 9 September 153, 434 7. 2 6. 3 15. 5 19. 2 27. 4 27. 5 10 October 118, 275 7. 8 6. 8 18. 3 23. 7 31. 8 32. 5 11 November 107, 413 6. 7 5. 5 16. 8 20. 4 27. 6 28. 8 12 December 99, 358 6. 2 5. 1 15. 5 19. 7 31. 3 32. 9
Meteorological – Beufort Sea Ø Wind Speed Quantiles m/s Max recorded: 32. 9 m/s (73. 6 mph)
Meteorological – Beufort Sea Ø Wind Speed distribution fit Max-Stable Distribution = location parameter; 4. 68454 = scale parameter 3. 12926 = shape parameter; 0. 0567011
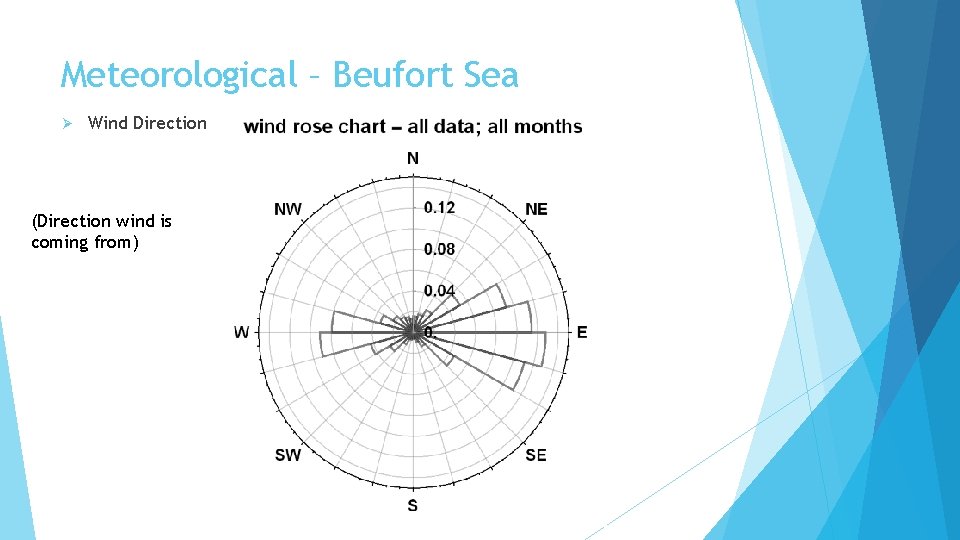
Meteorological – Beufort Sea Ø Wind Direction (Direction wind is coming from)
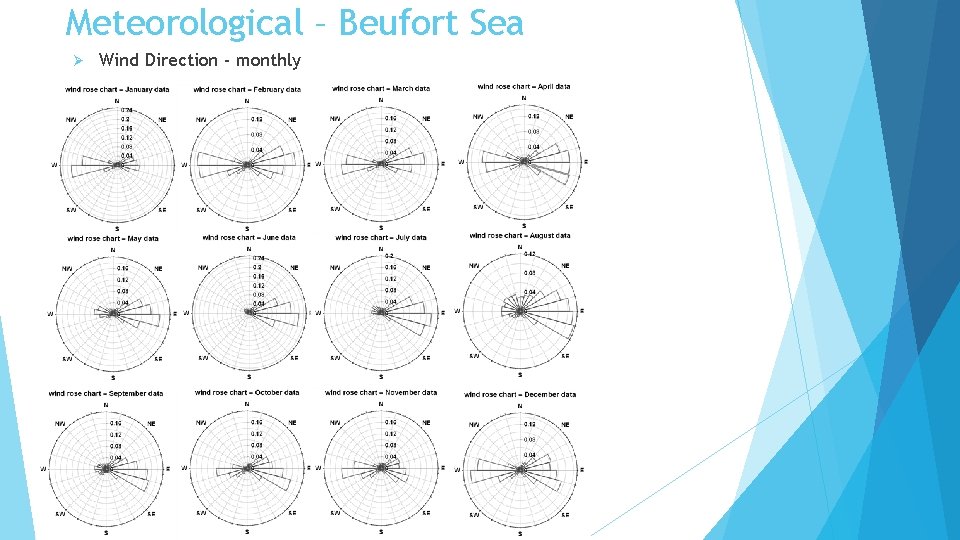
Meteorological – Beufort Sea Ø Wind Direction - monthly
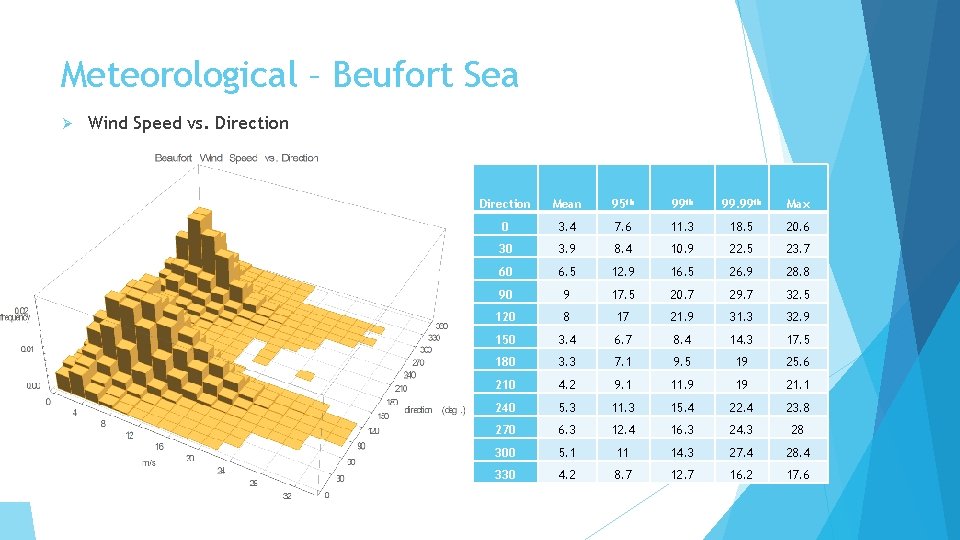
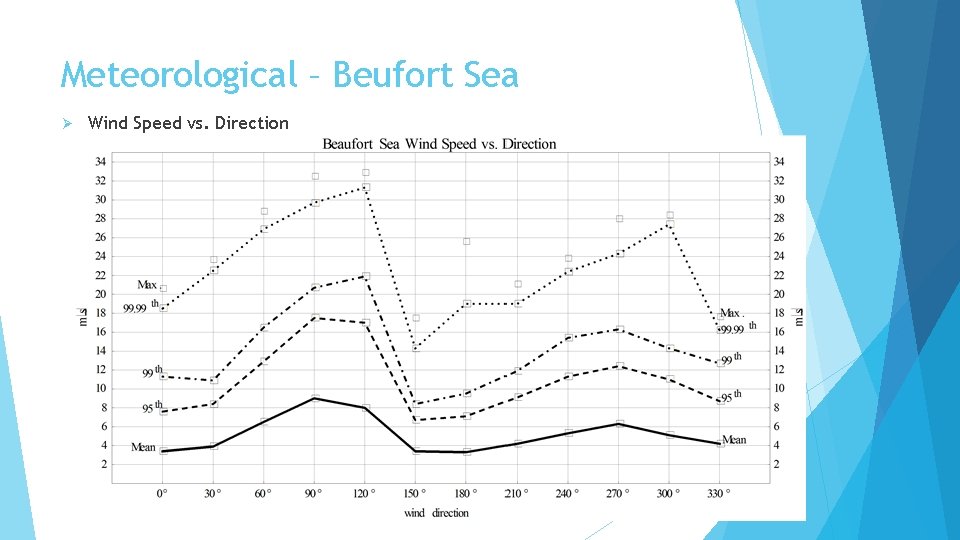
Meteorological – Beufort Sea Ø Wind Speed vs. Direction Mean 95 th 99. 99 th Max 0 3. 4 7. 6 11. 3 18. 5 20. 6 30 3. 9 8. 4 10. 9 22. 5 23. 7 60 6. 5 12. 9 16. 5 26. 9 28. 8 90 9 17. 5 20. 7 29. 7 32. 5 120 8 17 21. 9 31. 3 32. 9 150 3. 4 6. 7 8. 4 14. 3 17. 5 180 3. 3 7. 1 9. 5 19 25. 6 210 4. 2 9. 1 11. 9 19 21. 1 240 5. 3 11. 3 15. 4 22. 4 23. 8 270 6. 3 12. 4 16. 3 24. 3 28 300 5. 1 11 14. 3 27. 4 28. 4 330 4. 2 8. 7 12. 7 16. 2 17. 6
Meteorological – Beufort Sea Ø Wind Speed vs. Direction
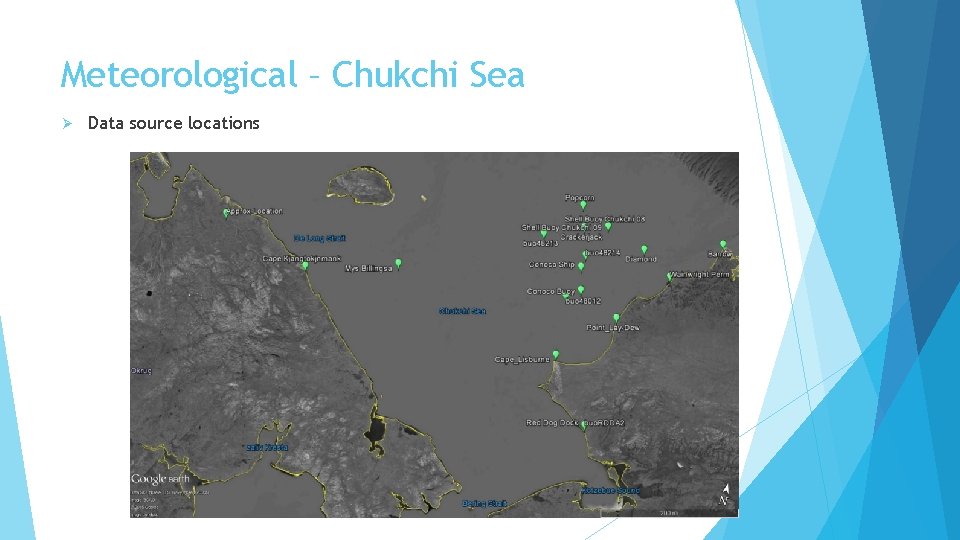
Meteorological – Chukchi Sea Ø Data source locations
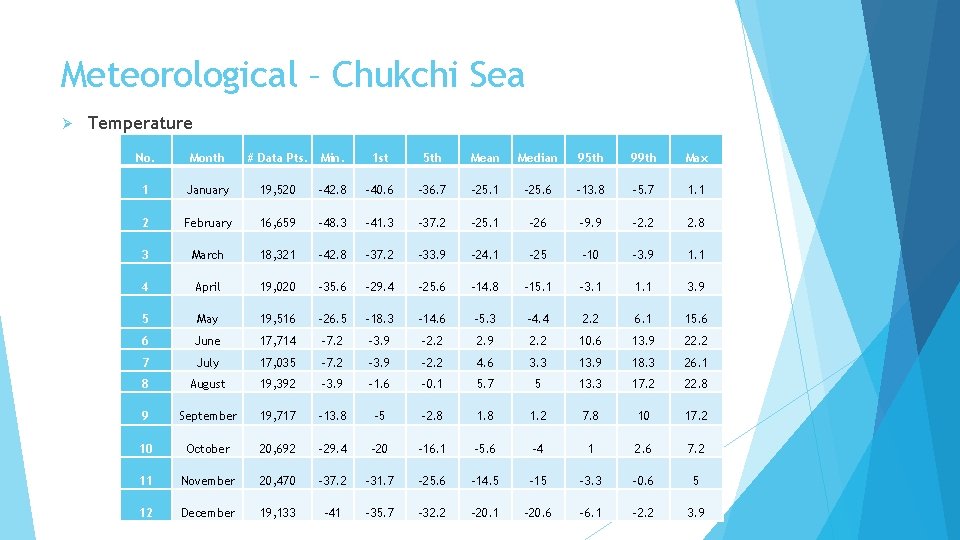
Meteorological – Chukchi Sea Ø Temperature No. Month # Data Pts. Min. 1 st 5 th Mean Median 95 th 99 th Max 1 January 19, 520 -42. 8 -40. 6 -36. 7 -25. 1 -25. 6 -13. 8 -5. 7 1. 1 2 February 16, 659 -48. 3 -41. 3 -37. 2 -25. 1 -26 -9. 9 -2. 2 2. 8 3 March 18, 321 -42. 8 -37. 2 -33. 9 -24. 1 -25 -10 -3. 9 1. 1 4 April 19, 020 -35. 6 -29. 4 -25. 6 -14. 8 -15. 1 -3. 1 1. 1 3. 9 5 May 19, 516 -26. 5 -18. 3 -14. 6 -5. 3 -4. 4 2. 2 6. 1 15. 6 6 June 17, 714 -7. 2 -3. 9 -2. 2 2. 9 2. 2 10. 6 13. 9 22. 2 7 July 17, 035 -7. 2 -3. 9 -2. 2 4. 6 3. 3 13. 9 18. 3 26. 1 8 August 19, 392 -3. 9 -1. 6 -0. 1 5. 7 5 13. 3 17. 2 22. 8 9 September 19, 717 -13. 8 -5 -2. 8 1. 2 7. 8 10 17. 2 10 October 20, 692 -29. 4 -20 -16. 1 -5. 6 -4 1 2. 6 7. 2 11 November 20, 470 -37. 2 -31. 7 -25. 6 -14. 5 -15 -3. 3 -0. 6 5 12 December 19, 133 -41 -35. 7 -32. 2 -20. 1 -20. 6 -6. 1 -2. 2 3. 9
Meteorological – Chukchi Sea Ø Temperature
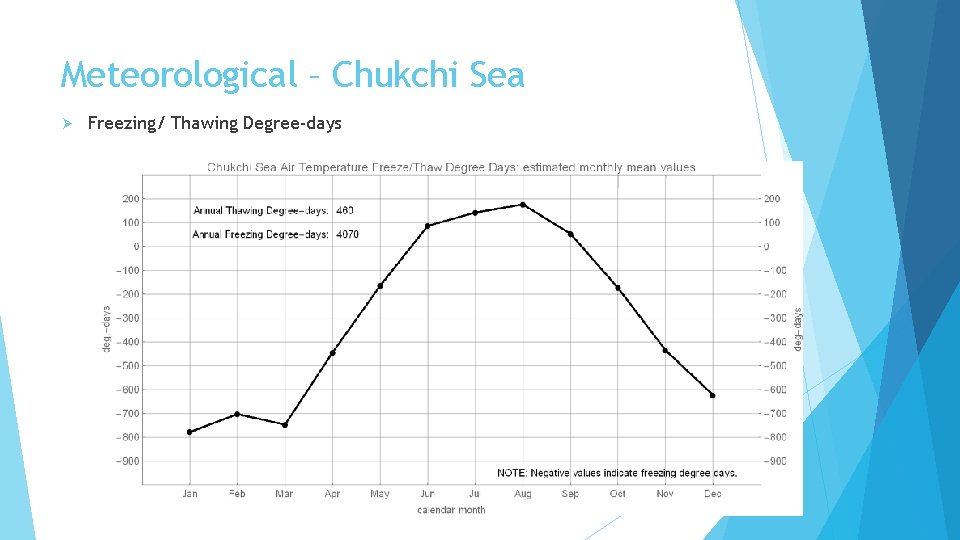
Meteorological – Chukchi Sea Ø Freezing/ Thawing Degree-days
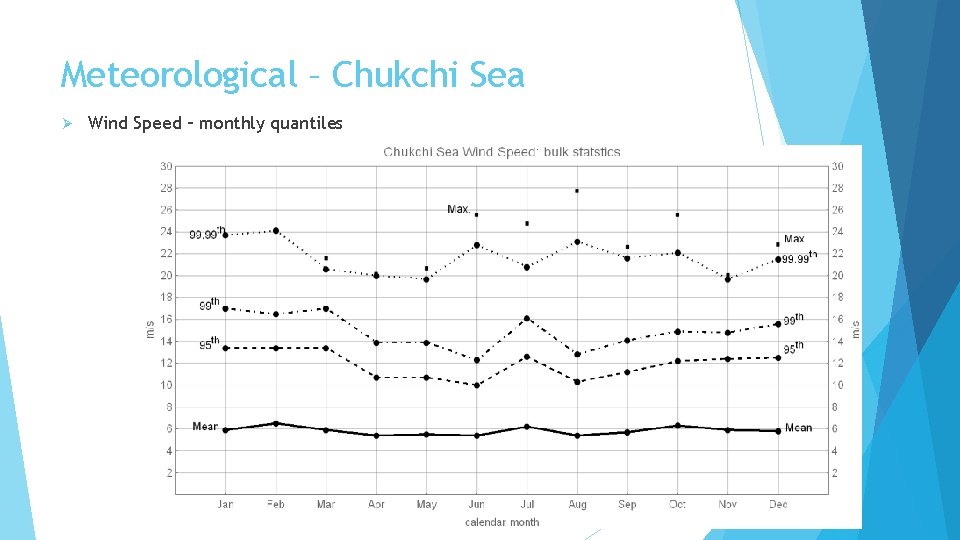
Meteorological – Chukchi Sea Ø Wind Speed – monthly quantiles
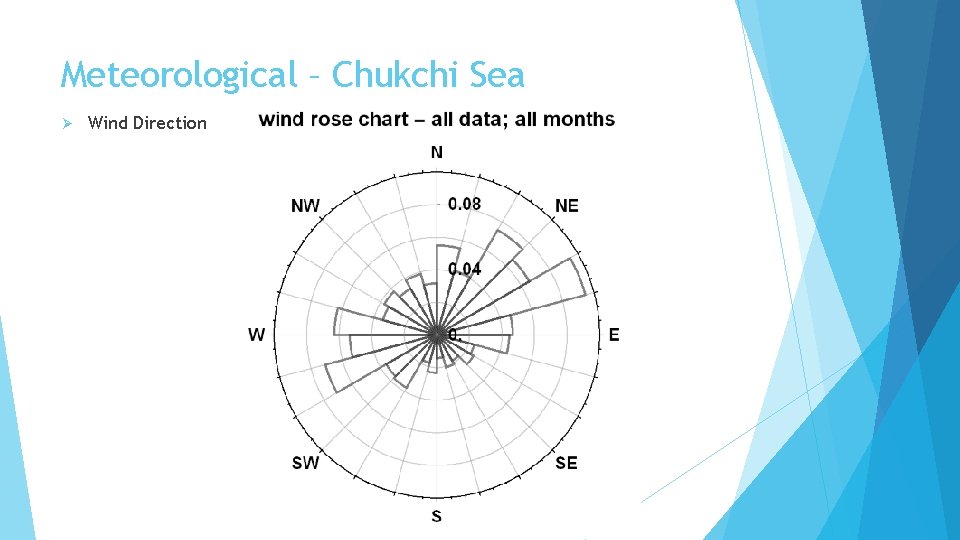
Meteorological – Chukchi Sea Ø Wind Direction
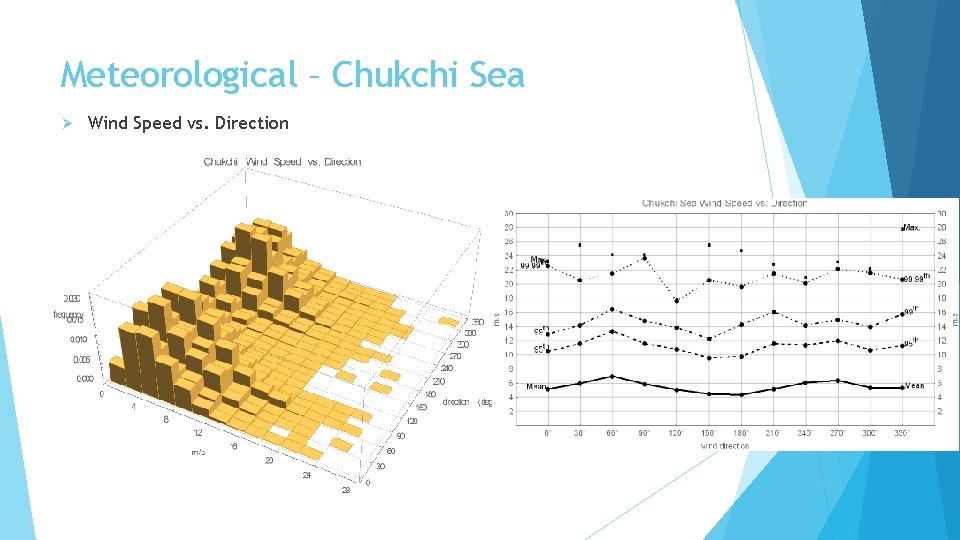
Meteorological – Chukchi Sea Ø Wind Speed vs. Direction
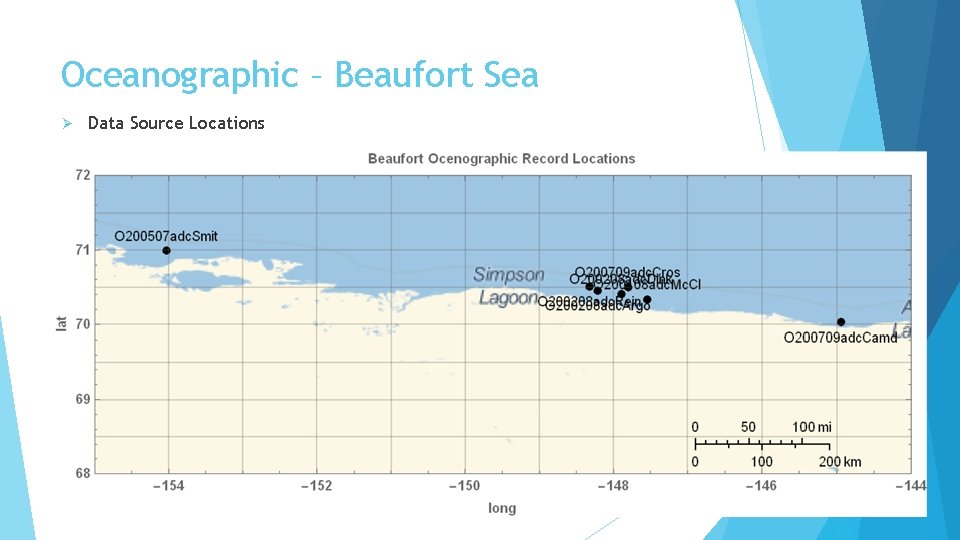
Oceanographic – Beaufort Sea Ø Data Source Locations
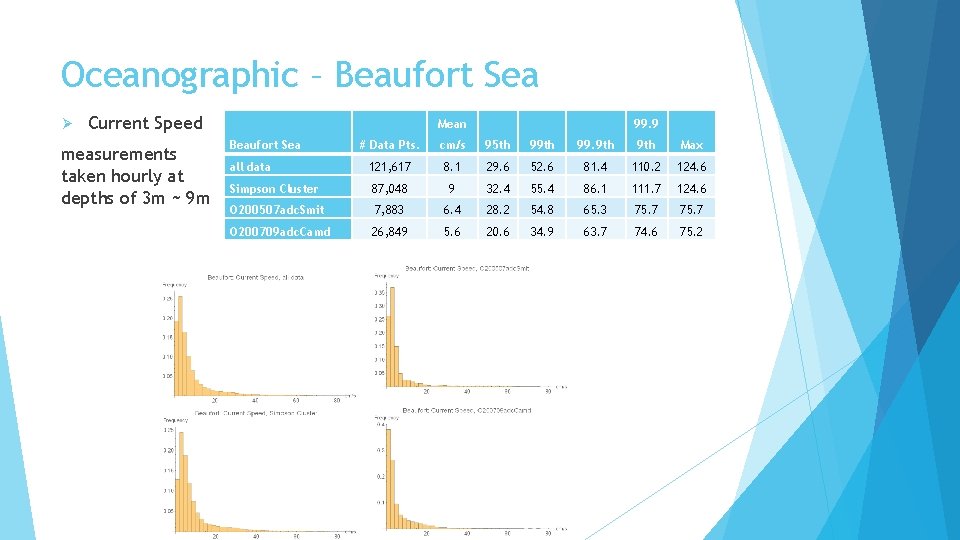
Oceanographic – Beaufort Sea Ø Current Speed measurements taken hourly at depths of 3 m ~ 9 m Mean Beaufort Sea 99. 9 # Data Pts. cm/s 95 th 99. 9 th Max all data 121, 617 8. 1 29. 6 52. 6 81. 4 110. 2 124. 6 Simpson Cluster 87, 048 9 32. 4 55. 4 86. 1 111. 7 124. 6 O 200507 adc. Smit 7, 883 6. 4 28. 2 54. 8 65. 3 75. 7 O 200709 adc. Camd 26, 849 5. 6 20. 6 34. 9 63. 7 74. 6 75. 2
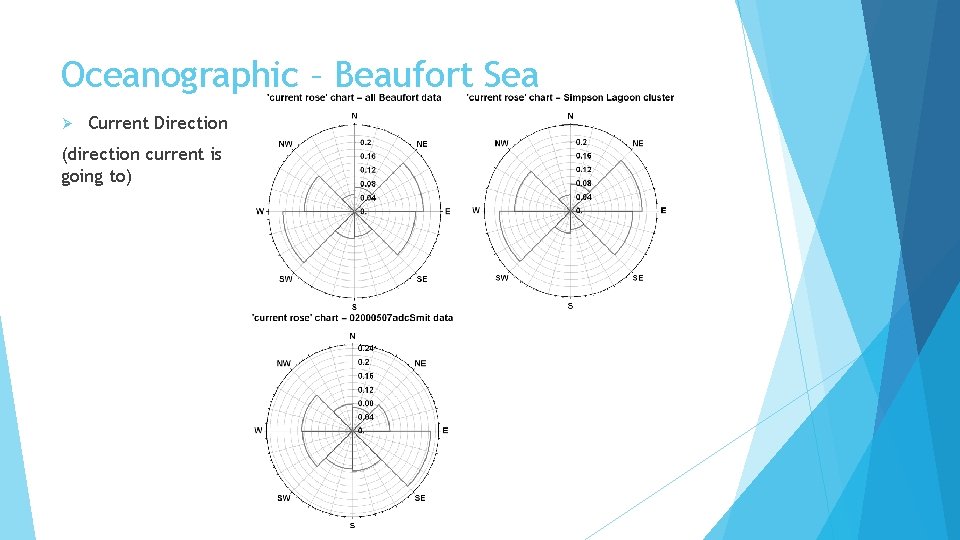
Oceanographic – Beaufort Sea Ø Current Direction (direction current is going to)
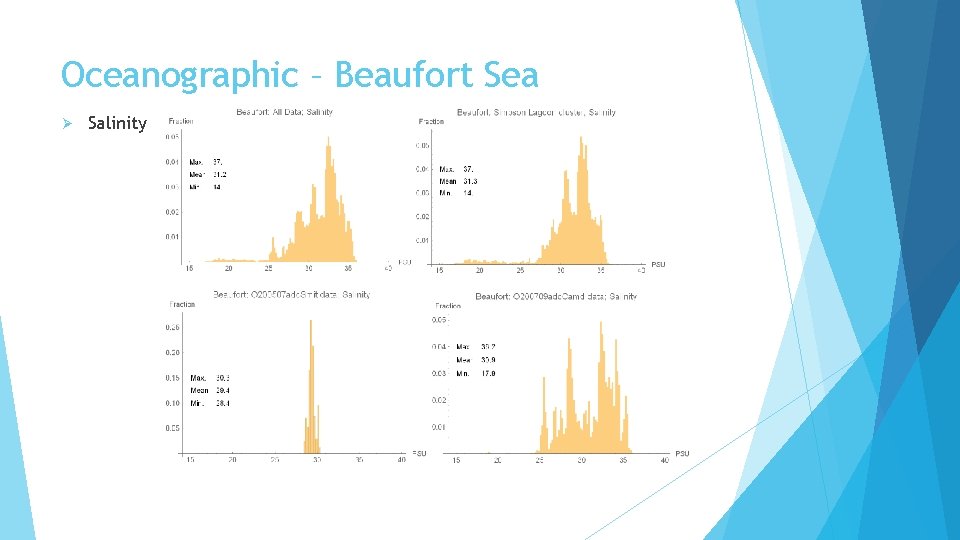
Oceanographic – Beaufort Sea Ø Salinity
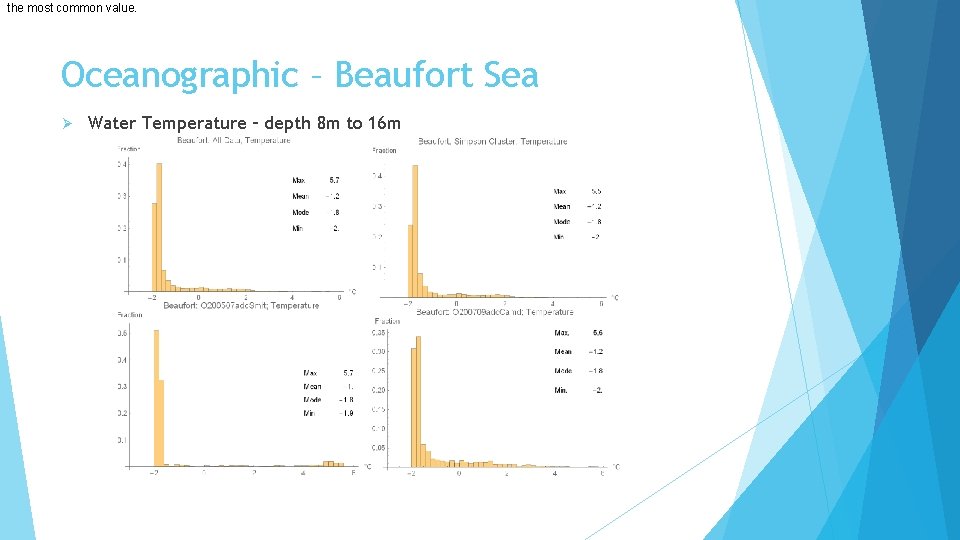
the most common value. Oceanographic – Beaufort Sea Ø Water Temperature – depth 8 m to 16 m
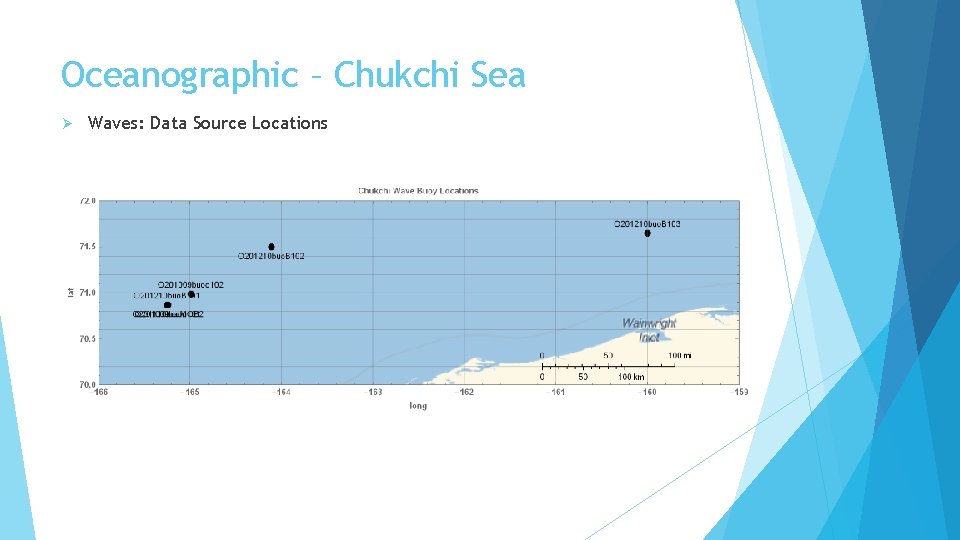
Oceanographic – Chukchi Sea Ø Waves: Data Source Locations
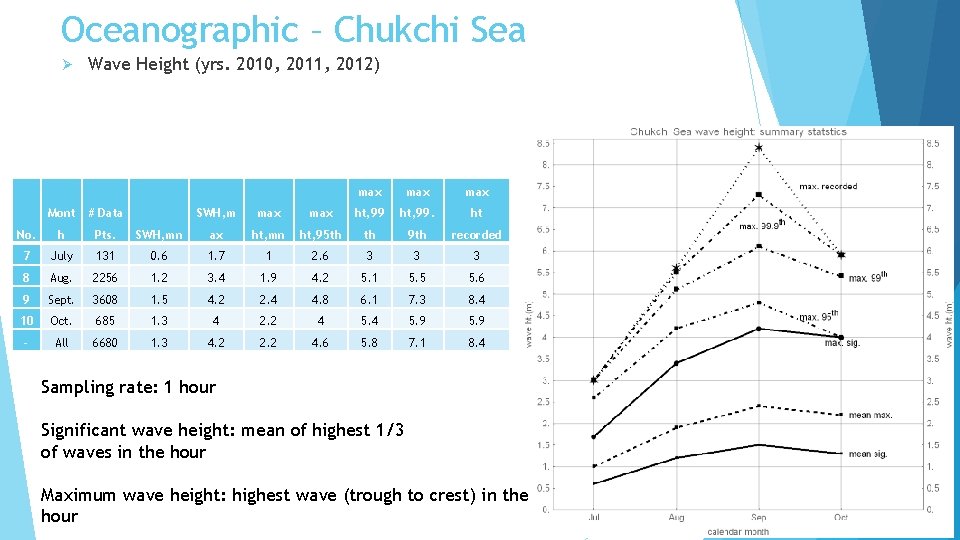
Oceanographic – Chukchi Sea Ø Wave Height (yrs. 2010, 2011, 2012) Mont # Data No. h Pts. 7 July 8 max max SWH, m max ht, 99. ht SWH, mn ax ht, mn ht, 95 th th 9 th recorded 131 0. 6 1. 7 1 2. 6 3 3 3 Aug. 2256 1. 2 3. 4 1. 9 4. 2 5. 1 5. 5 5. 6 9 Sept. 3608 1. 5 4. 2 2. 4 4. 8 6. 1 7. 3 8. 4 10 Oct. 685 1. 3 4 2. 2 4 5. 9 - All 6680 1. 3 4. 2 2. 2 4. 6 5. 8 7. 1 8. 4 Sampling rate: 1 hour Significant wave height: mean of highest 1/3 of waves in the hour Maximum wave height: highest wave (trough to crest) in the hour
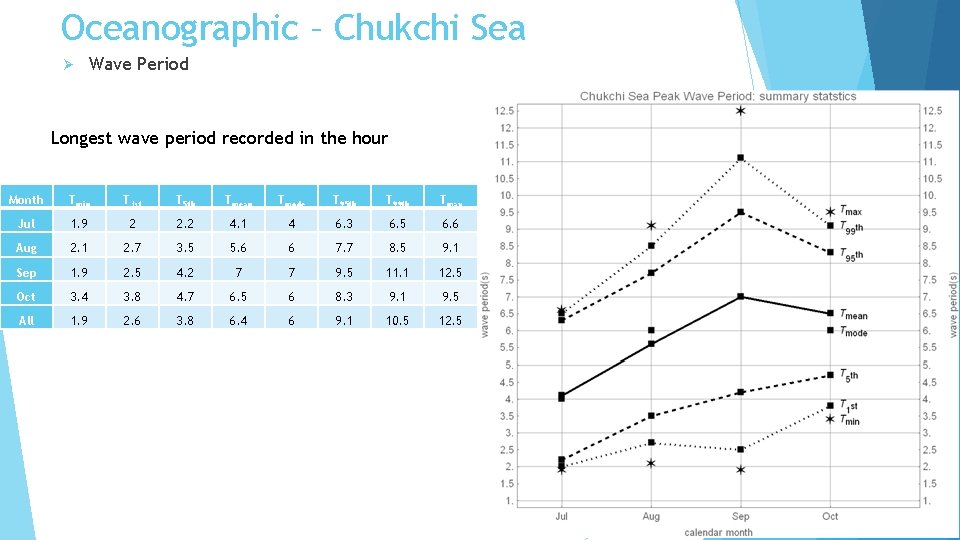
Oceanographic – Chukchi Sea Ø Wave Period Longest wave period recorded in the hour Month Tmin T 1 st T 5 th Tmean Tmode T 95 th T 99 th Tmax Jul 1. 9 2 2. 2 4. 1 4 6. 3 6. 5 6. 6 Aug 2. 1 2. 7 3. 5 5. 6 6 7. 7 8. 5 9. 1 Sep 1. 9 2. 5 4. 2 7 7 9. 5 11. 1 12. 5 Oct 3. 4 3. 8 4. 7 6. 5 6 8. 3 9. 1 9. 5 All 1. 9 2. 6 3. 8 6. 4 6 9. 1 10. 5 12. 5
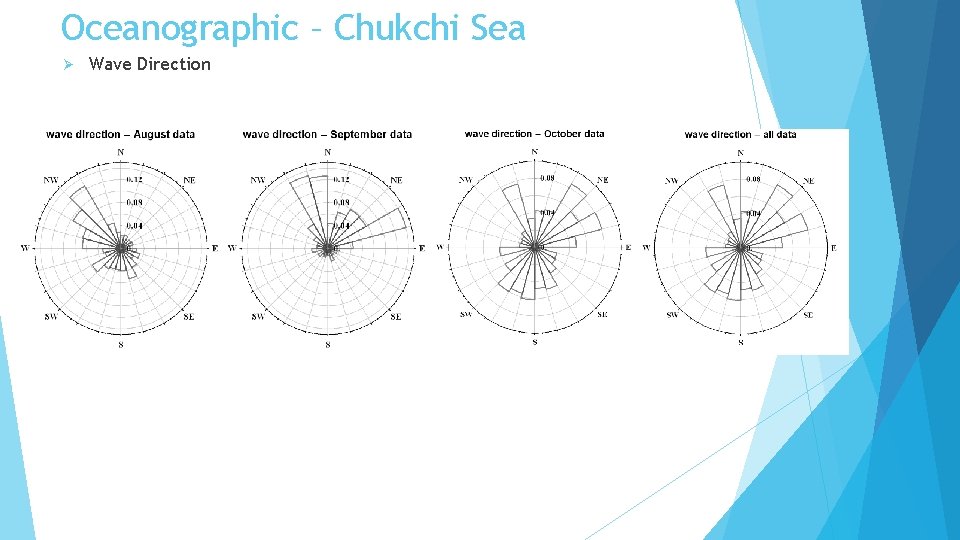
Oceanographic – Chukchi Sea Ø Wave Direction
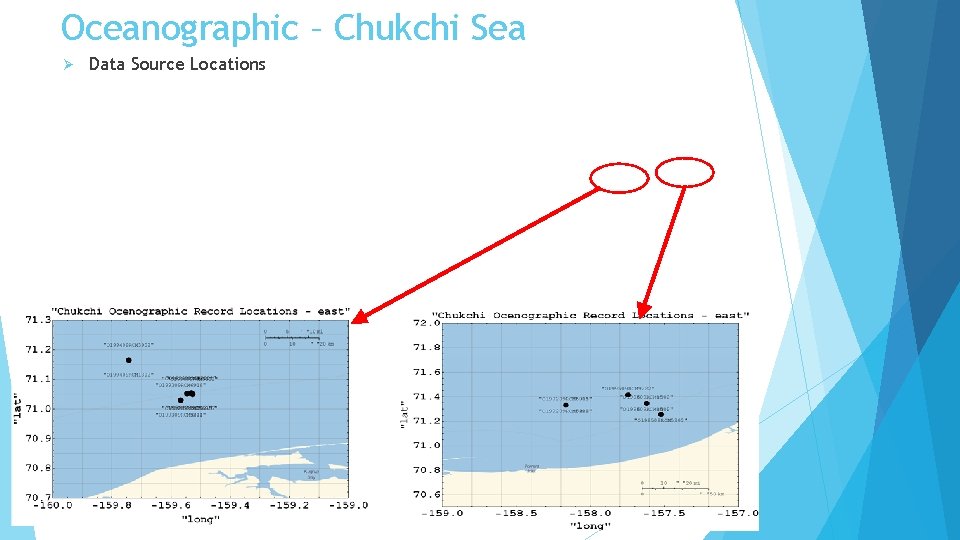
Oceanographic – Chukchi Sea Ø Data Source Locations
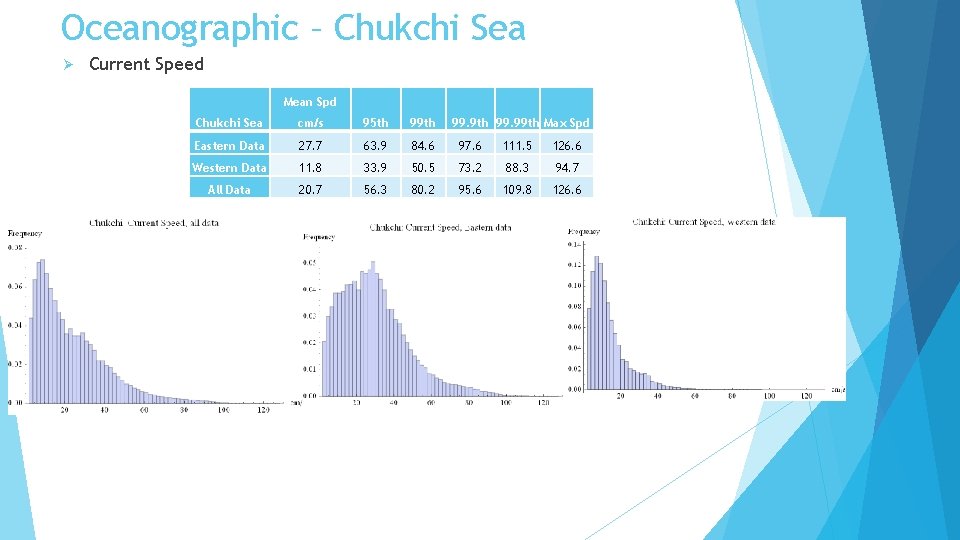
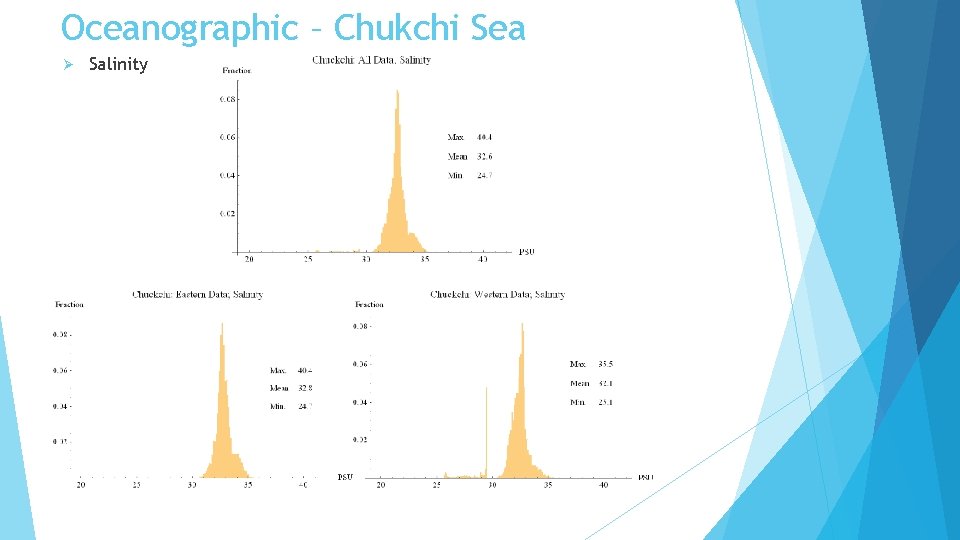
Oceanographic – Chukchi Sea Ø Current Speed Mean Spd Chukchi Sea cm/s 95 th 99. 9 th 99. 99 th Max Spd Eastern Data 27. 7 63. 9 84. 6 97. 6 111. 5 126. 6 Western Data 11. 8 33. 9 50. 5 73. 2 88. 3 94. 7 All Data 20. 7 56. 3 80. 2 95. 6 109. 8 126. 6
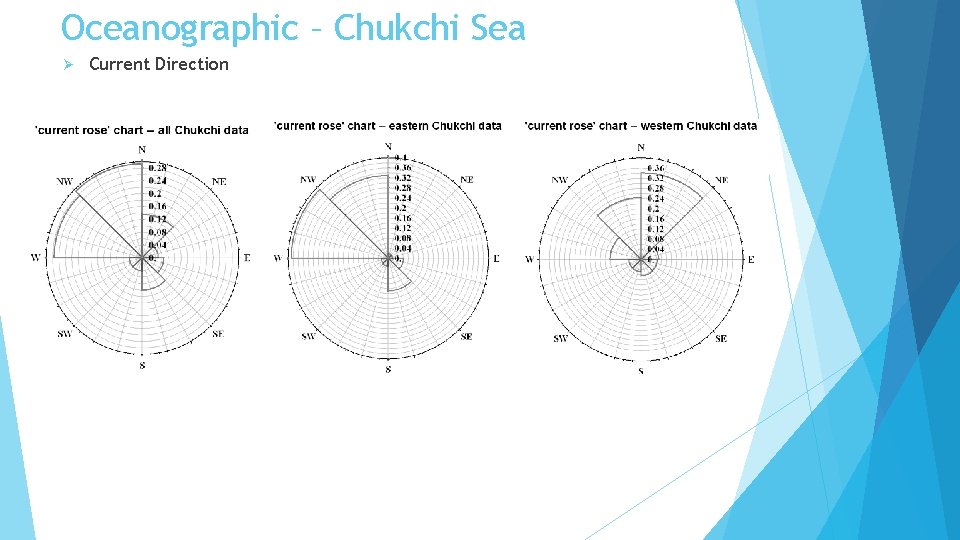
Oceanographic – Chukchi Sea Ø Current Direction
Oceanographic – Chukchi Sea Ø Salinity
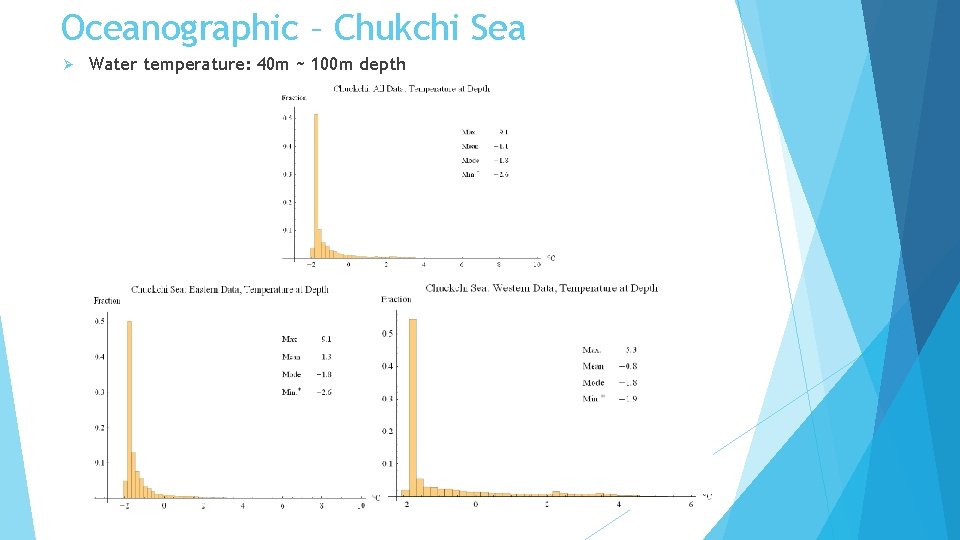
Oceanographic – Chukchi Sea Ø Water temperature: 40 m ~ 100 m depth
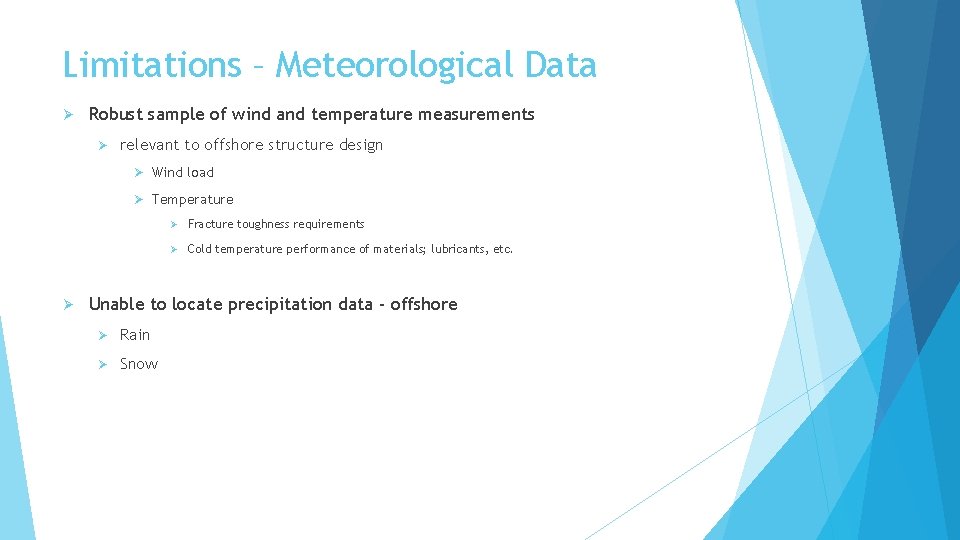
Limitations – Meteorological Data Ø Robust sample of wind and temperature measurements Ø relevant to offshore structure design Ø Wind load Ø Temperature Ø Fracture toughness requirements Ø Cold temperature performance of materials; lubricants, etc. Ø Unable to locate precipitation data - offshore Ø Rain Ø Snow
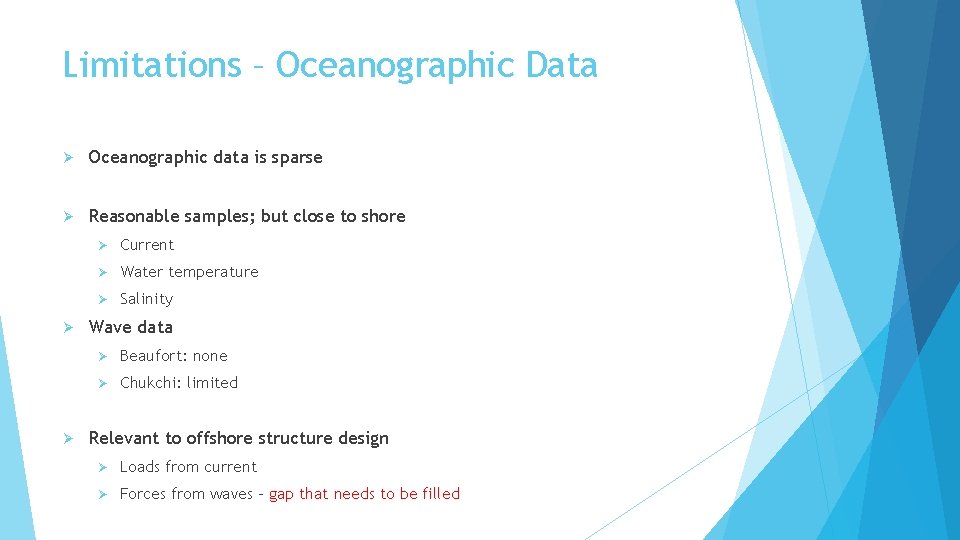
Limitations – Oceanographic Data Ø Oceanographic data is sparse Ø Reasonable samples; but close to shore Ø Ø Ø Current Ø Water temperature Ø Salinity Wave data Ø Beaufort: none Ø Chukchi: limited Relevant to offshore structure design Ø Loads from current Ø Forces from waves – gap that needs to be filled
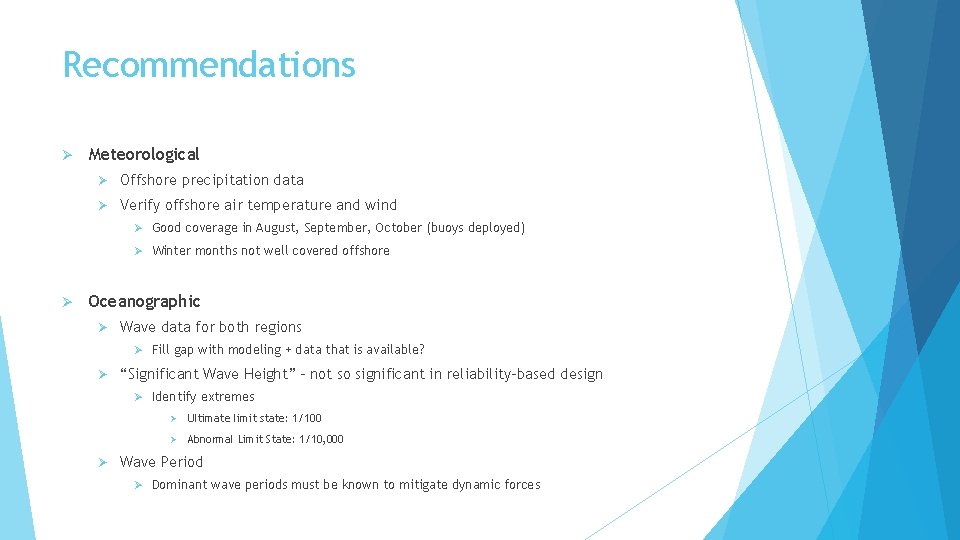
Recommendations Ø Meteorological Ø Offshore precipitation data Ø Verify offshore air temperature and wind Ø Good coverage in August, September, October (buoys deployed) Ø Winter months not well covered offshore Ø Oceanographic Ø Wave data for both regions Ø Fill gap with modeling + data that is available? Ø “Significant Wave Height” – not so significant in reliability-based design Ø Identify extremes Ø Ø Ultimate limit state: 1/100 Ø Abnormal Limit State: 1/10, 000 Wave Period Ø Dominant wave periods must be known to mitigate dynamic forces
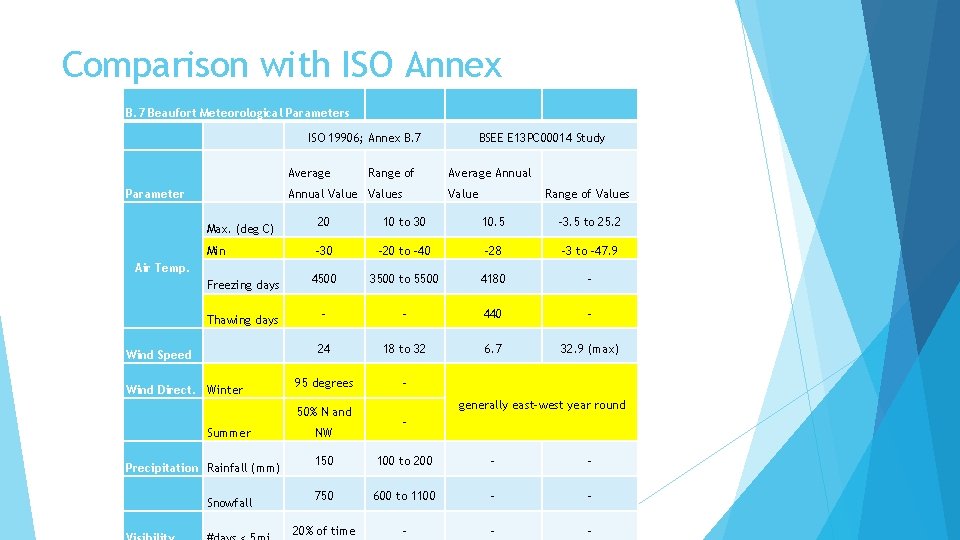
Comparison with ISO Annex B. 7 Beaufort Meteorological Parameters ISO 19906; Annex B. 7 Average Parameter Range of Annual Values Max. (deg C) Min Air Temp. Freezing days Thawing days Wind Speed Wind Direct. Winter Precipitation Rainfall (mm) Snowfall Average Annual Value Range of Values 20 10 to 30 10. 5 -3. 5 to 25. 2 -30 -20 to -40 -28 -3 to -47. 9 4500 3500 to 5500 4180 - - - 440 - 24 18 to 32 6. 7 32. 9 (max) 95 degrees - 50% N and Summer BSEE E 13 PC 00014 Study NW generally east-west year round - 150 100 to 200 - - 750 600 to 1100 - - 20% of time - - -
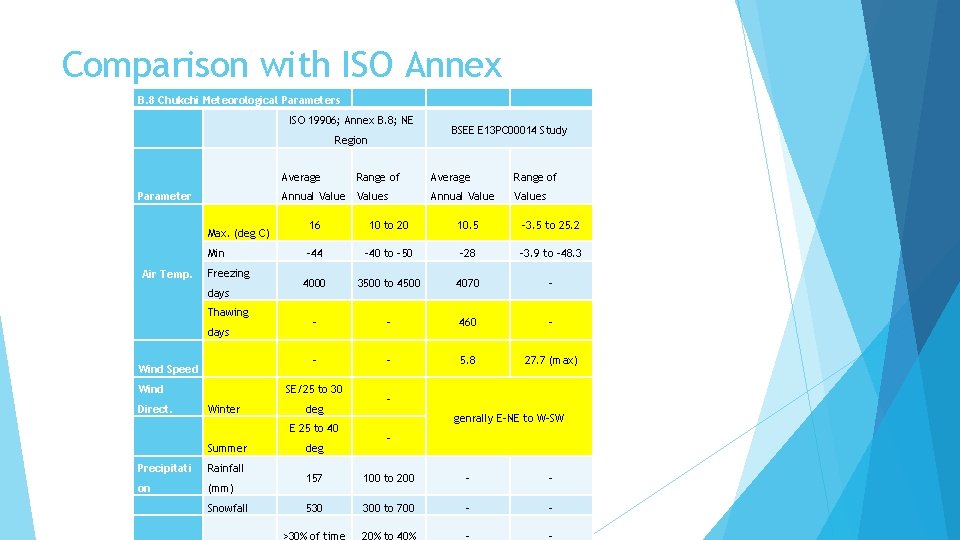
Comparison with ISO Annex B. 8 Chukchi Meteorological Parameters ISO 19906; Annex B. 8; NE Region Average Annual Values Parameter Max. (deg C) Min Air Temp. Freezing days Thawing days Wind Speed Wind Direct. Range of Precipitati Rainfall on (mm) Snowfall Range of Annual Values 10 to 20 10. 5 -3. 5 to 25. 2 -44 -40 to -50 -28 -3. 9 to -48. 3 4000 3500 to 4500 4070 - - - 460 - - - 5. 8 27. 7 (max) deg E 25 to 40 Summer Average 16 SE/25 to 30 Winter BSEE E 13 PC 00014 Study deg genrally E-NE to W-SW - 157 100 to 200 - - 530 300 to 700 - - >30% of time 20% to 40% - -
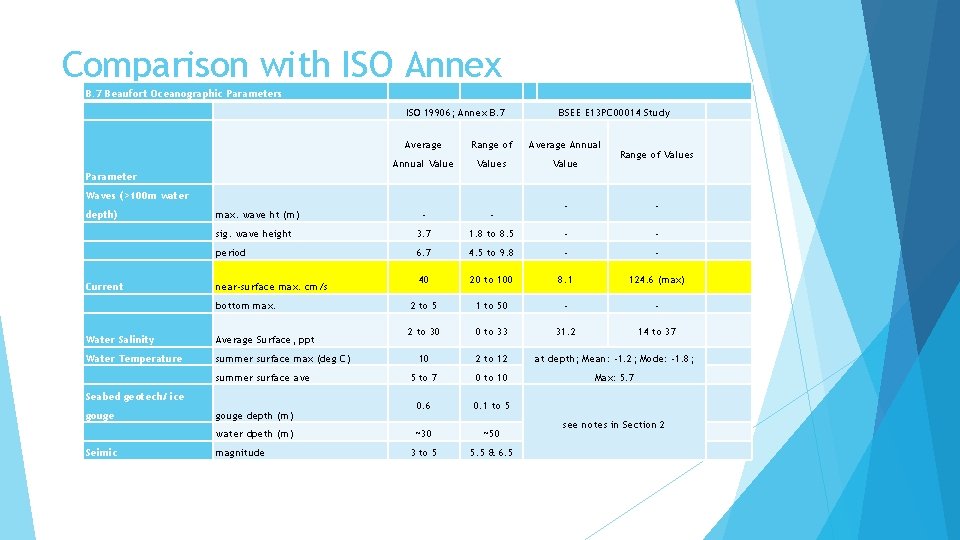
Comparison with ISO Annex B. 7 Beaufort Oceanographic Parameters ISO 19906; Annex B. 7 BSEE E 13 PC 00014 Study Average Range of Average Annual Values Value - - sig. wave height 3. 7 period Range of Values Parameter Waves (>100 m water depth) Current max. wave ht (m) near-surface max. cm/s bottom max. Water Salinity Average Surface, ppt Water Temperature summer surface max (deg C) summer surface ave Seabed geotech/ ice gouge depth (m) water dpeth (m) Seimic magnitude - - 1. 8 to 8. 5 - - 6. 7 4. 5 to 9. 8 - - 40 20 to 100 8. 1 124. 6 (max) 2 to 5 1 to 50 - - 2 to 30 0 to 33 31. 2 14 to 37 10 2 to 12 at depth; Mean: -1. 2; Mode: -1. 8; 5 to 7 0 to 10 Max: 5. 7 0. 6 0. 1 to 5 ~30 ~50 3 to 5 5. 5 & 6. 5 see notes in Section 2
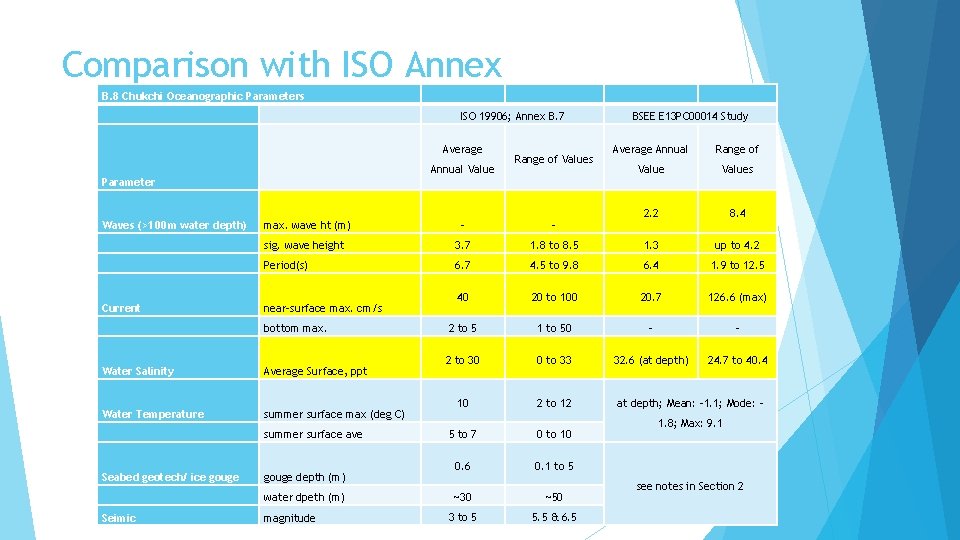
Comparison with ISO Annex B. 8 Chukchi Oceanographic Parameters ISO 19906; Annex B. 7 Average Annual Value Range of Values BSEE E 13 PC 00014 Study Average Annual Range of Values 2. 2 8. 4 Parameter Waves (>100 m water depth) Current max. wave ht (m) - - sig. wave height 3. 7 1. 8 to 8. 5 1. 3 up to 4. 2 Period(s) 6. 7 4. 5 to 9. 8 6. 4 1. 9 to 12. 5 40 20 to 100 20. 7 126. 6 (max) 2 to 5 1 to 50 - - 2 to 30 0 to 33 32. 6 (at depth) 24. 7 to 40. 4 10 2 to 12 5 to 7 0 to 10 0. 6 0. 1 to 5 ~30 ~50 3 to 5 5. 5 & 6. 5 near-surface max. cm/s bottom max. Water Salinity Average Surface, ppt Water Temperature summer surface max (deg C) summer surface ave Seabed geotech/ ice gouge depth (m) water dpeth (m) Seimic magnitude at depth; Mean: -1. 1; Mode: 1. 8; Max: 9. 1 see notes in Section 2
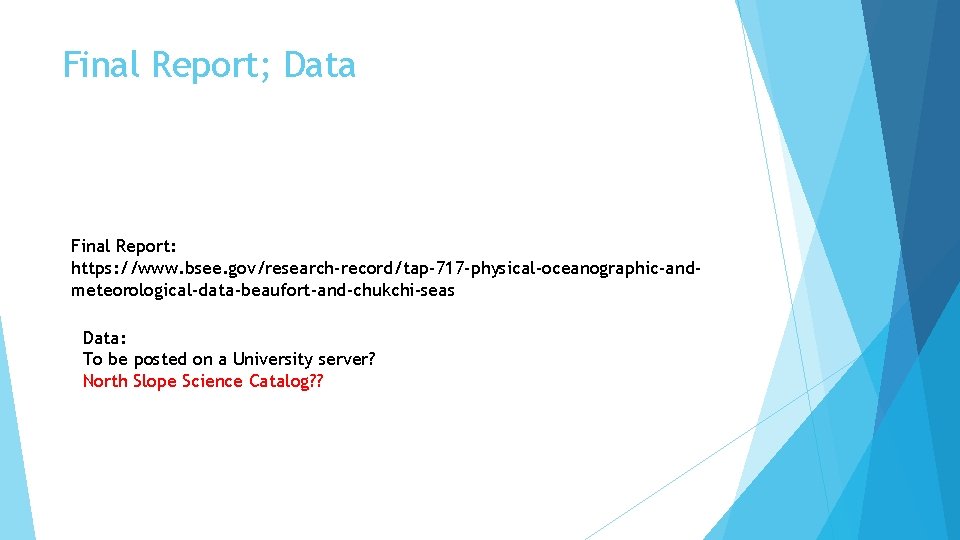
Final Report; Data Final Report: https: //www. bsee. gov/research-record/tap-717 -physical-oceanographic-andmeteorological-data-beaufort-and-chukchi-seas Data: To be posted on a University server? North Slope Science Catalog? ?