Taguchis Definition of Quality or lack thereof The

 Inner or deterioration noise (2) Outer or environmental")


, H = + (outer kiln position) response =")

 Positive Effect")


=2")


- Slides: 77
Taguchi’s Definition of Quality –or lack thereof “ The loss a product causes society after it is shipped ” Loss due to 1) Variability in function 2) Harmful side effects
Noise –Sources of Functional Variation (1) Inner or deterioration noise (2) Outer or environmental noise (3) Variational or piece to piece variation caused during manufacture
Examples Refrigerator temperature control inner noise – leakage & mechanical wear of compressor parts outer noise – use conditions, frequency of opening, what stored, ambient temp. , voltage variation etc. variational noise – tightness of door, amount of refrigerant, imperfection in compressor parts etc. Automobile Brakes inner noise – wear of drums and pads, leakage of fluid outer noise – road conditions, speed of car, weight etc. variational noise – fits, variation in friction coefficient etc.
Controllable input factors Input Process Uncontrollable input factors Output y
Activities Where Counter Measures to Noise are Possible Activity/Noise Source Inner Noise Outer Noise Variational Noise Manufacturing X X O Process Design X X O Product Design O O O X – No Countermeasure Possible O – Countermeasure Possible
Robust Parameter Design Experiments
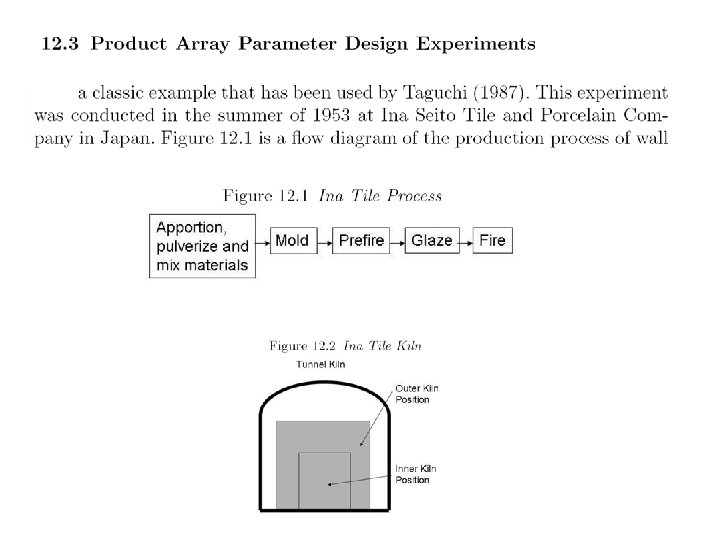
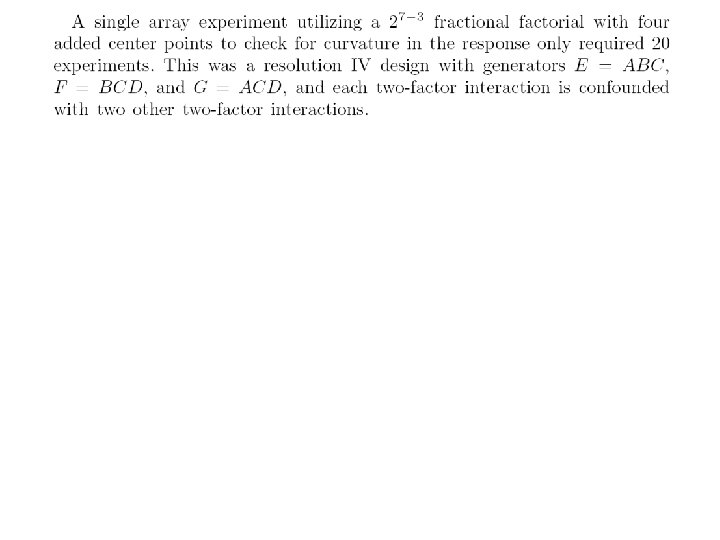
Simulated Noise factor H represents position in the kiln - = in the center, + = near kiln walls where temperature is higher Total of 27 -4 = 8× 21 = 16 measurements
Total of 9× 8=72 tests
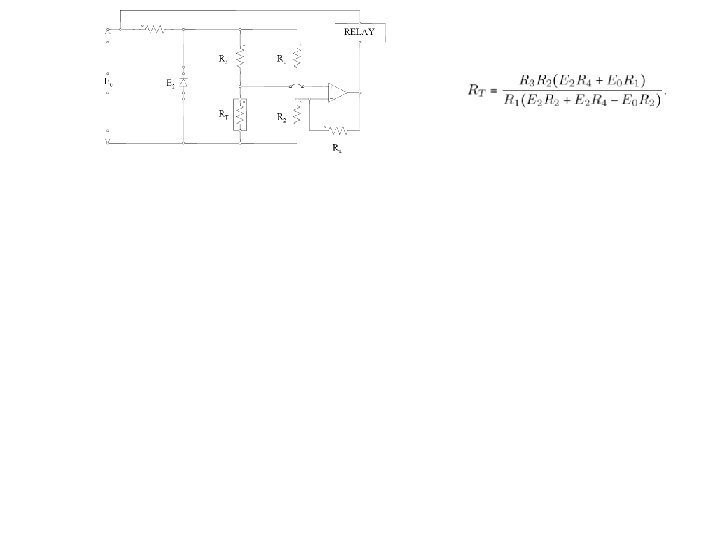
Output RT resistance at which the relay turns on
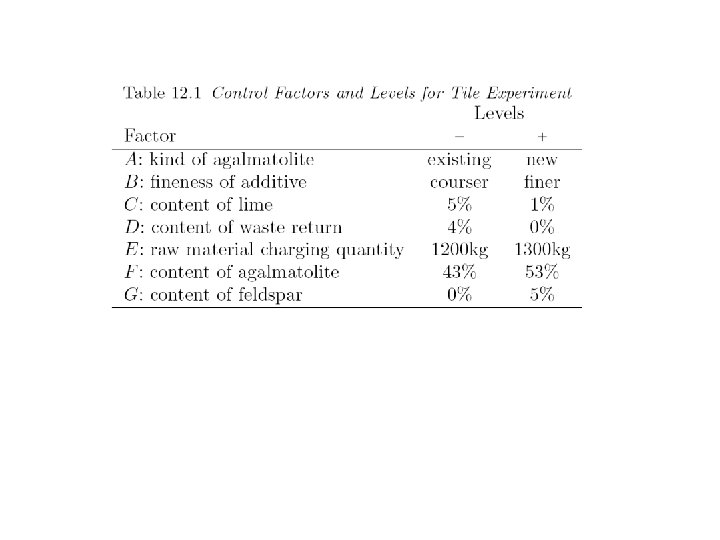
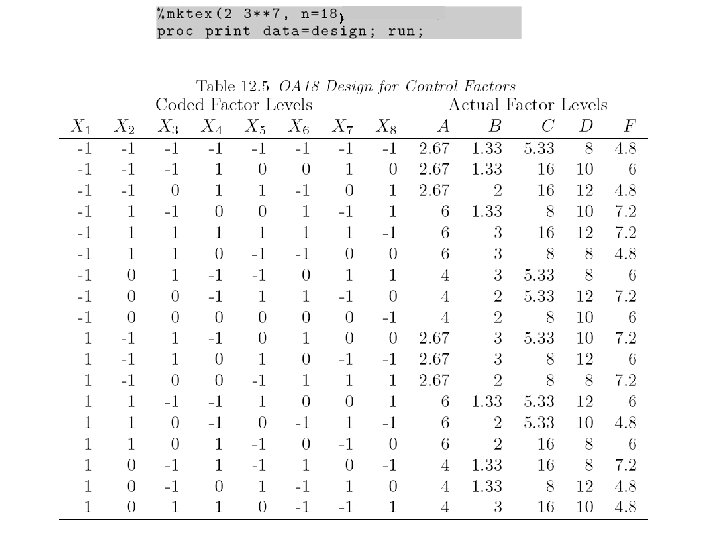
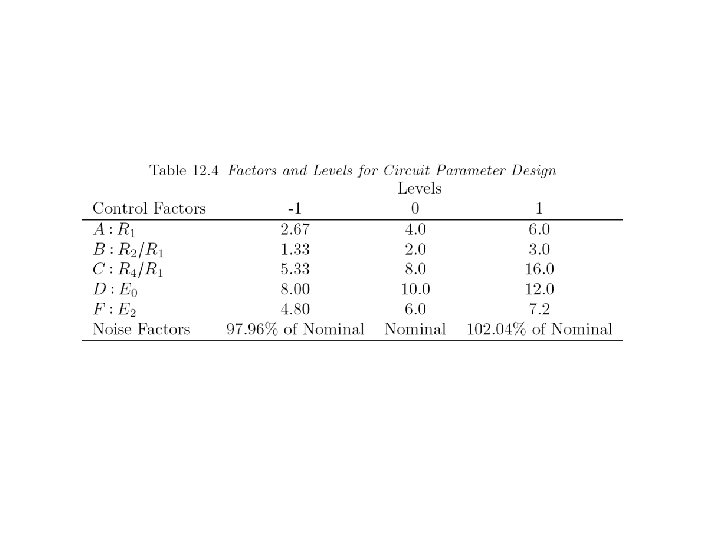
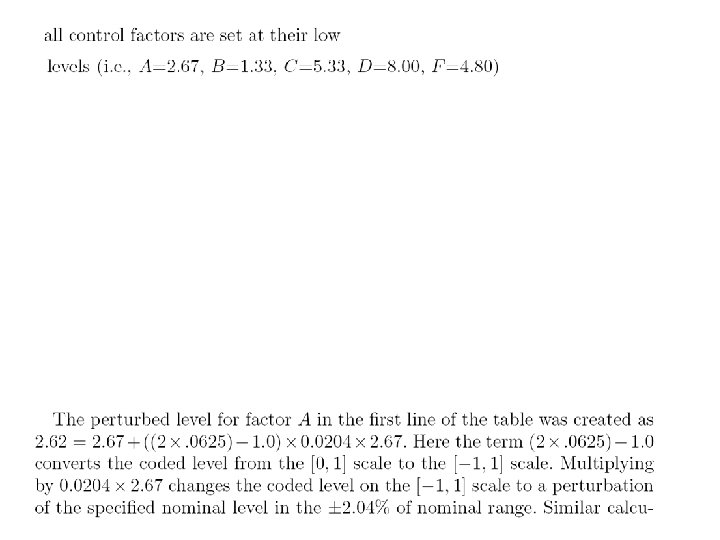
Levels for noise factors ± 2. 04% of nominal setting Example: when control factor A is 2. 67 low level of noise factor A is (1. 0 -0. 0204)× 2. 67=2. 62 high level of noise factor A is (1. 0+0. 0204) )× 2. 67=2. 72
Noise Factor Array when =
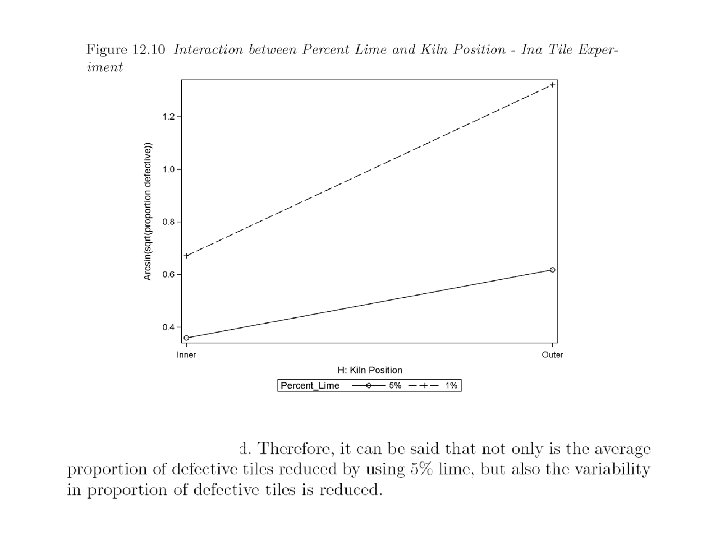
H = - (inner kiln position), H = + (outer kiln position) response = number of defective per 100 tiles
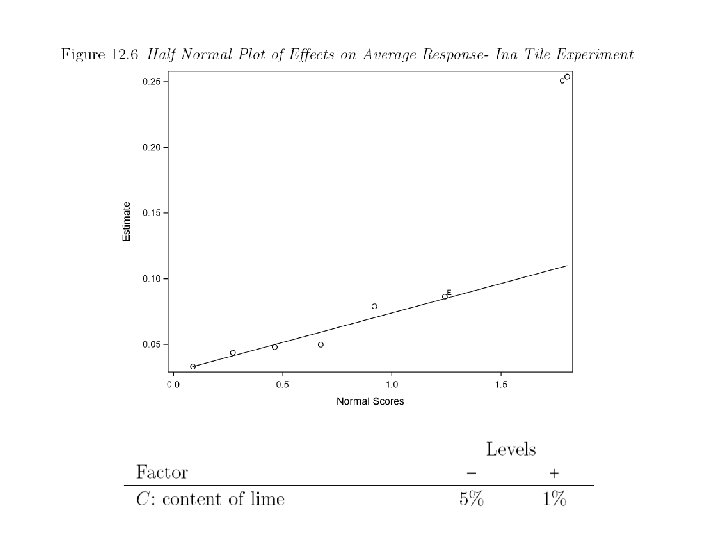
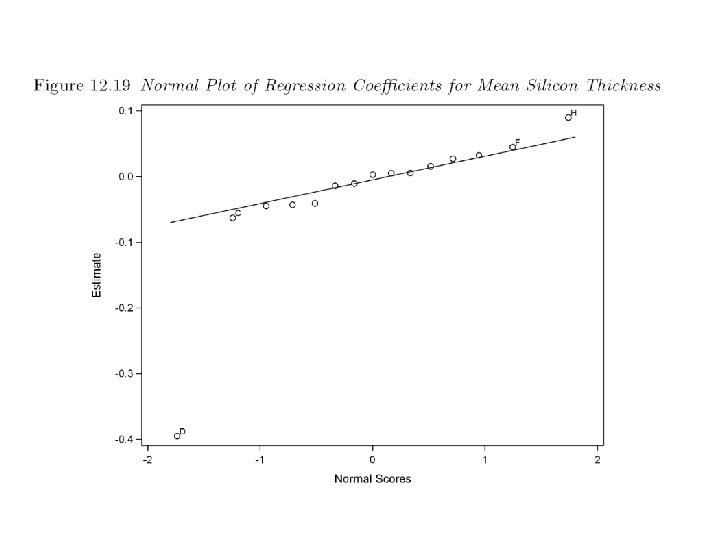
Effects on the mean Positive Effect
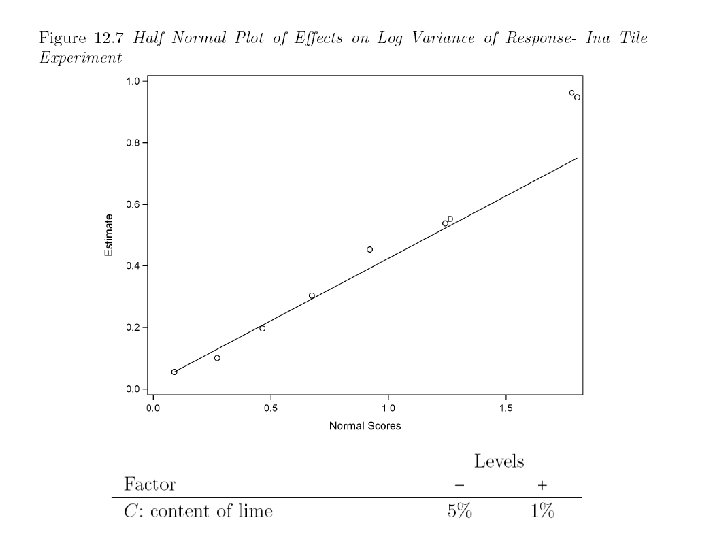
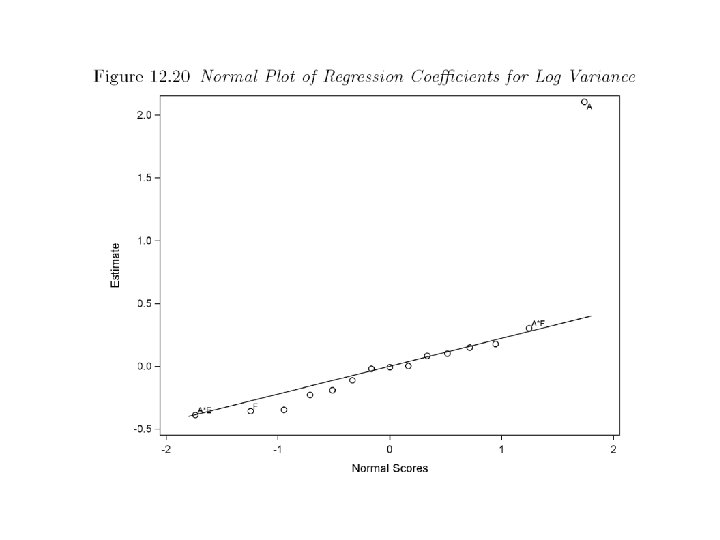
Effects on the loge(var) Positive Effect
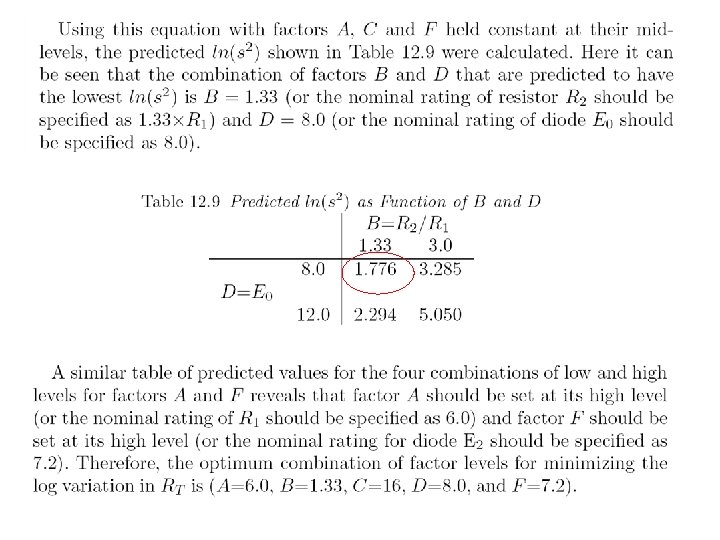
Conclusion: increasing the content of lime from 1% to 5% reduces the average percentage of defective tiles, and reduces the variability in percentage of defective tiles caused by the temperature gradient in the kiln.
Data written in a single array format Run A B C D E -1 -1 1 1 F G H y 1 -1 2 1 3 -1 4 1 5 -1 -1 1 6 1 -1 7 -1 1 1 -1 -1 0. 433 8 1 1 1 9 -1 -1 -1 1 0. 489 10 1 1 0. 422 11 -1 1 1 0. 201 12 1 1 -1 -1 -1 1 0. 284 13 -1 -1 1 1 0. 833 14 1 -1 -1 1 1. 571 15 -1 1 1 -1 -1 1 0. 927 16 1 1 1. 571 -1 -1 1 1 -1 0. 171 1 -1 0. 120 1 -1 -1 0. 060 1 -1 -1 1 1 -1 0. 212 1 -1 -1 -1 0. 748 -1 -1 -1 0. 161 1 1 -1 0. 263 1
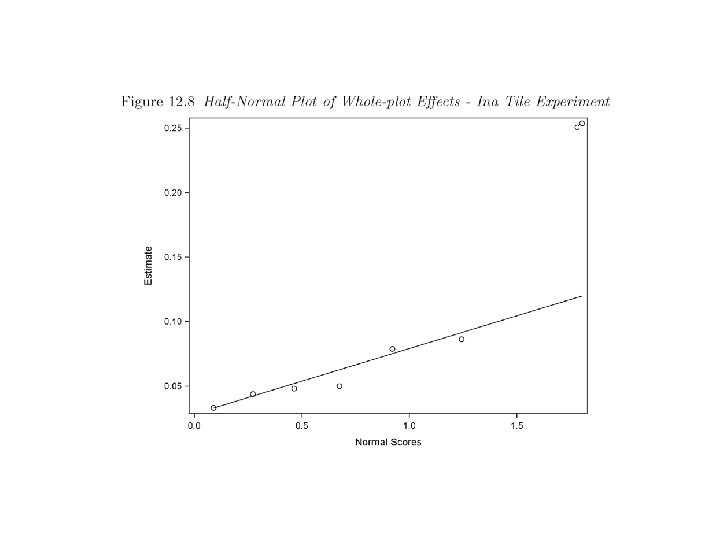
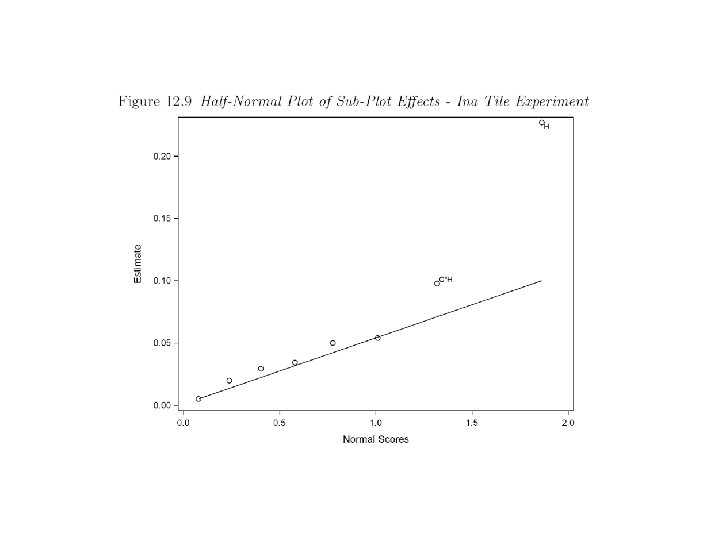
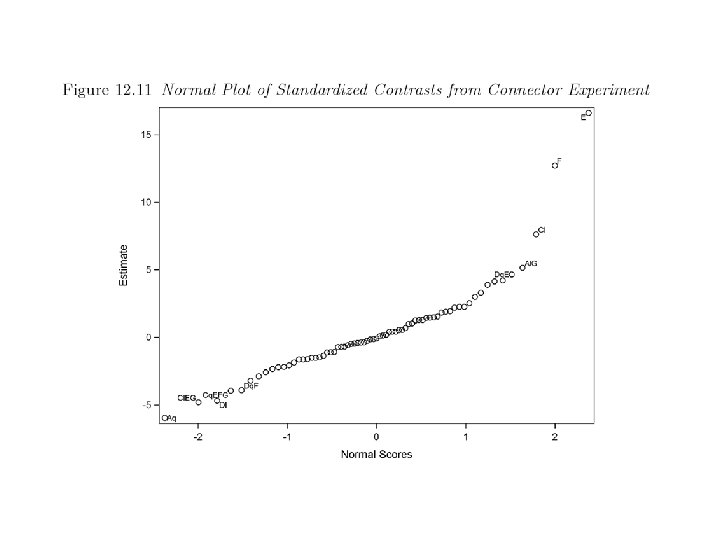
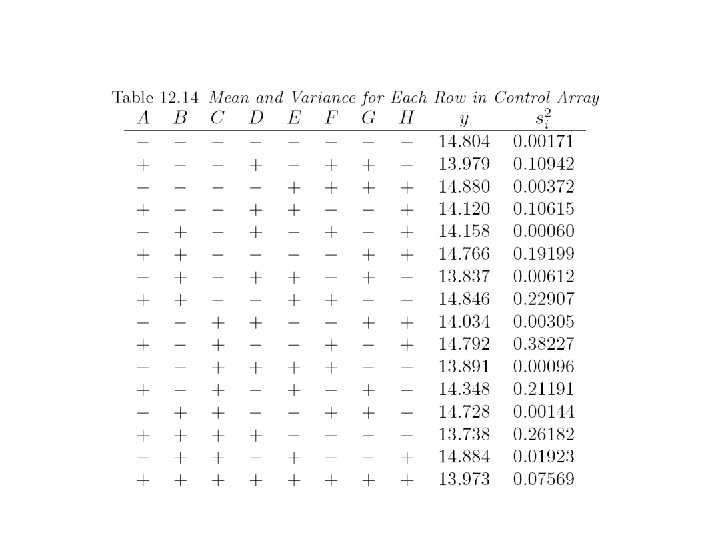
No replicates of whole plots, therefore analysis is conducted by making separate normal plots of whole-plot effects and sub-plot effects as described in Sections 8. 4 and 8. 5.
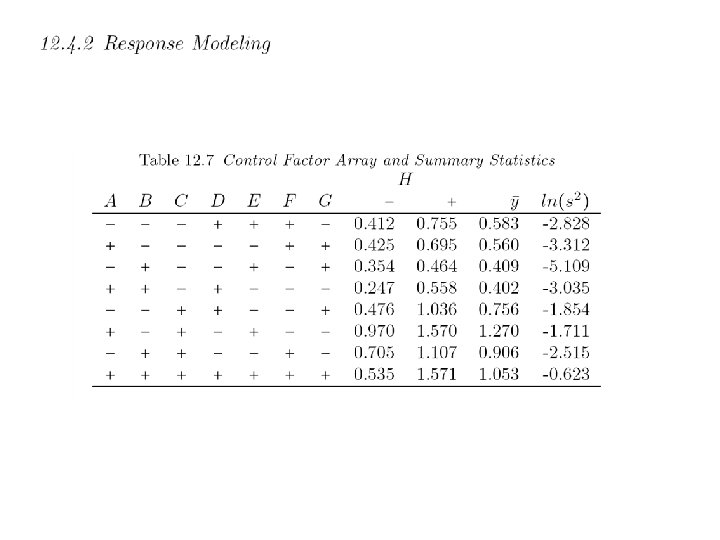
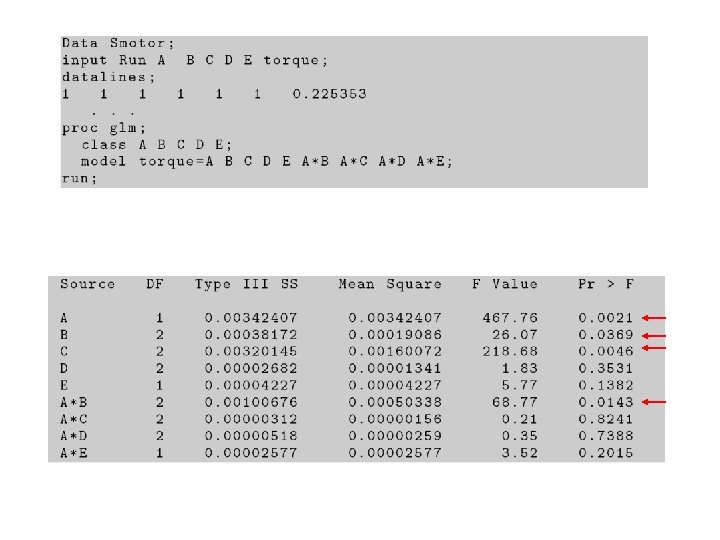
Response Modeling with Multiple Noise Factors
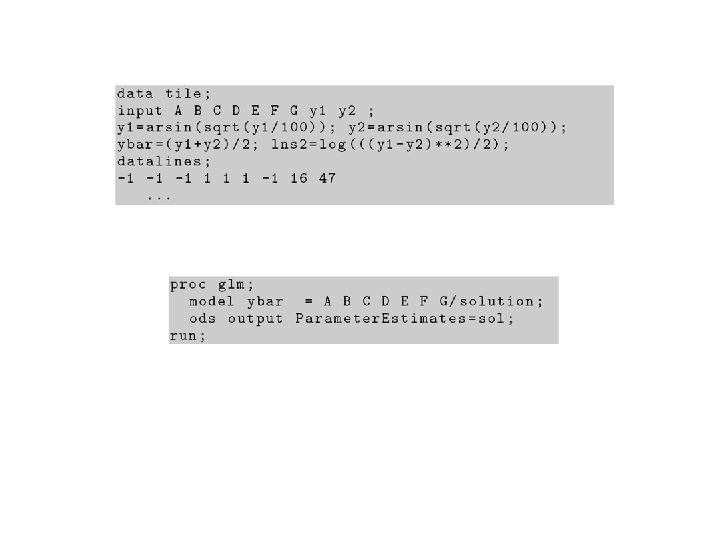
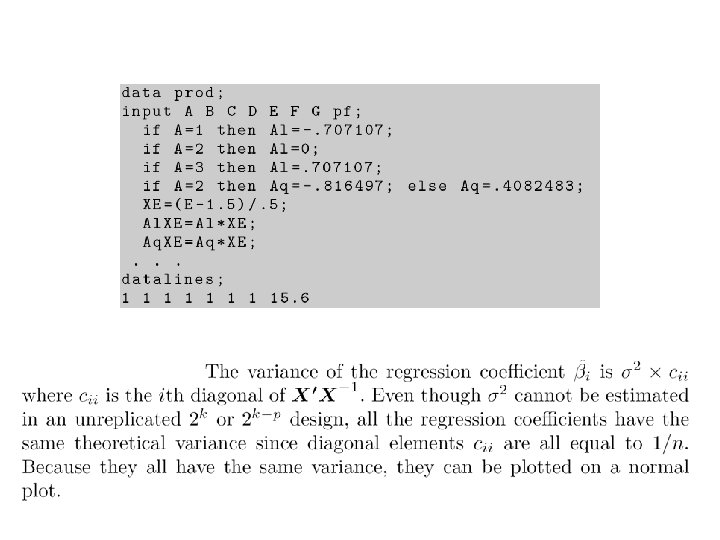
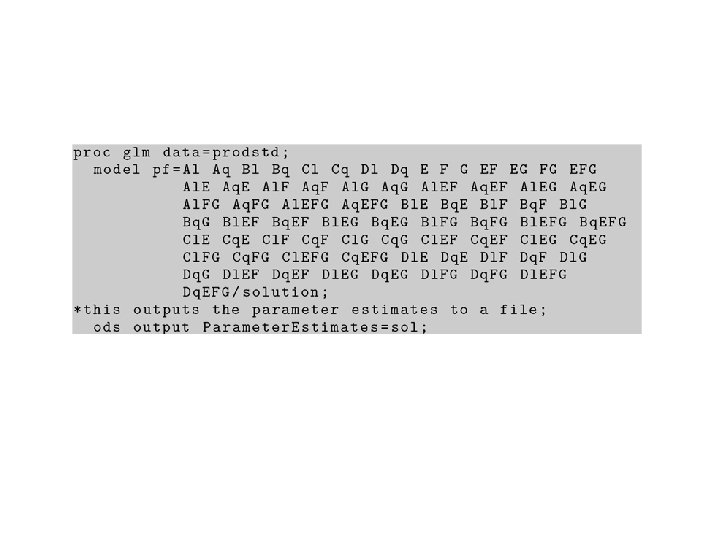
Standardize orthogonal contrasts by dividing by the square root of the Number of replicates of each level of the factor in the design. This makes the (X 'X) a 72× 72 Identity matrix
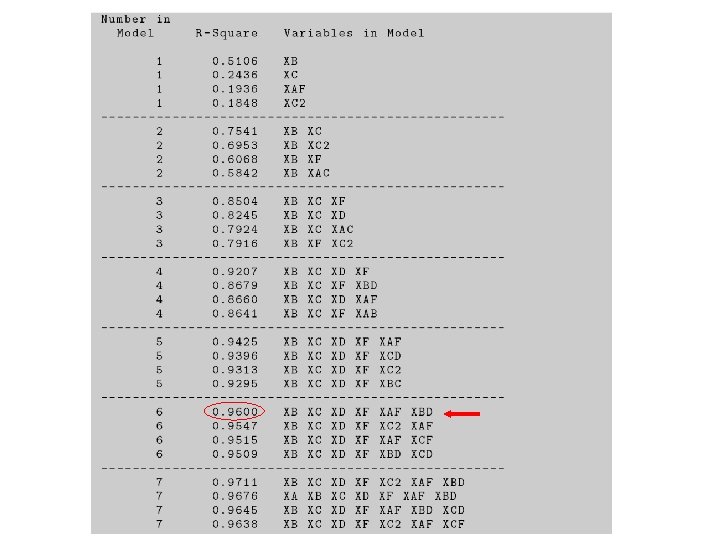
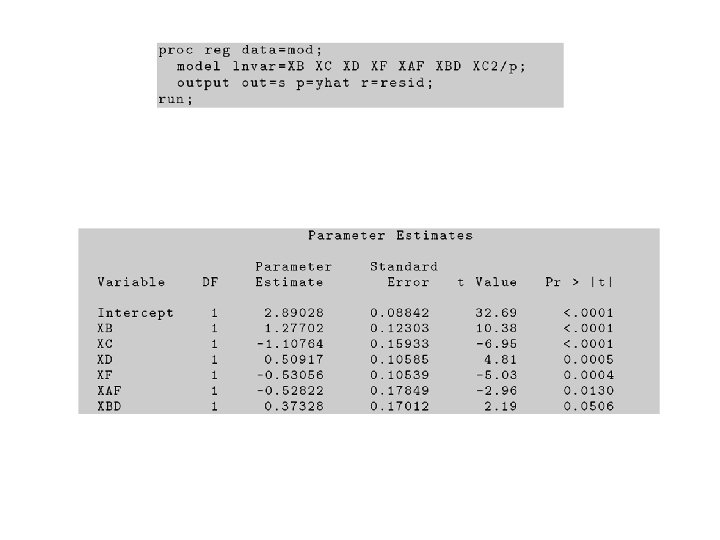
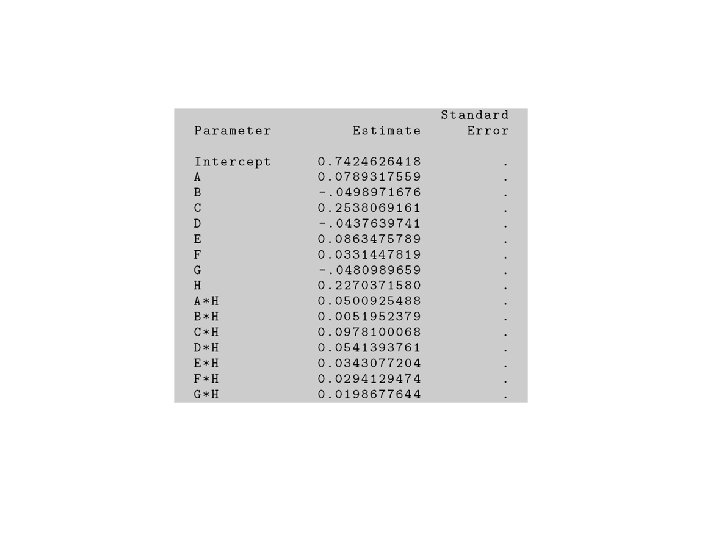
Fit a model to the largest effects identified on the normal plot
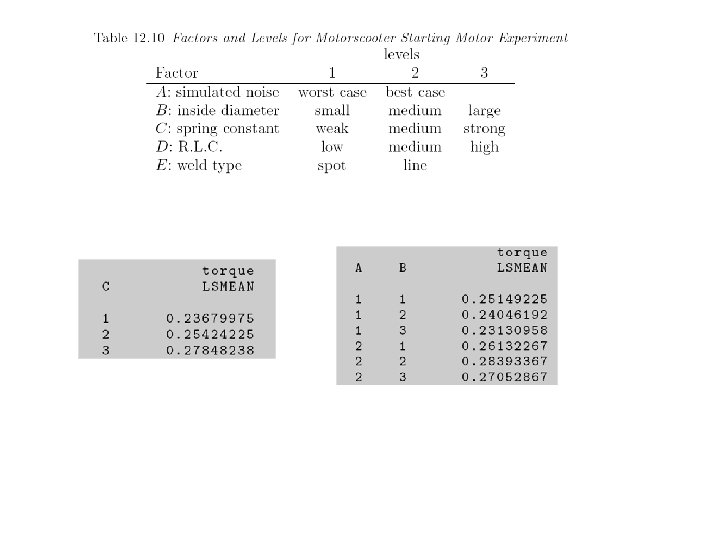
Interpretation of Results
(33× 2)=2
1/6 fraction
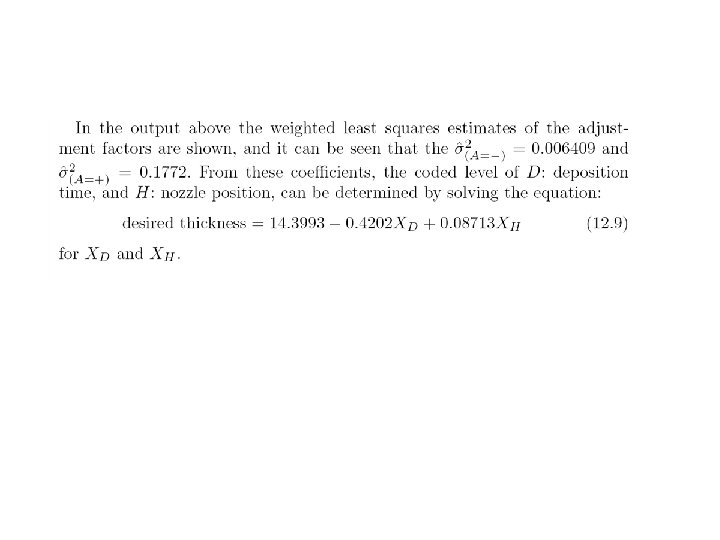
Adjustment Factor
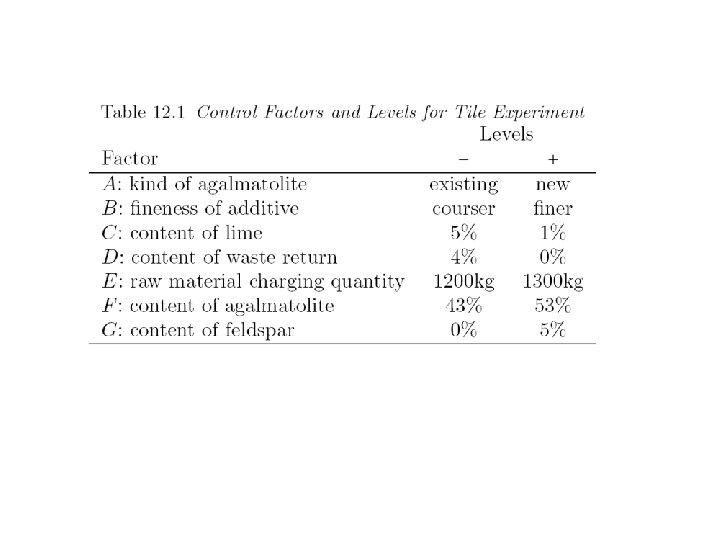
Single Array Experiment to Improve an Injection Molding Process Excessive part shrinkage was causing assembly problems Control Factors (could be easily varied): A: mold temperature B: screw speed C: holding time D: gate size Noise Factors (normally difficult to control): E: cycle time F: moisture content G: holding pressure
Shrinkage is minimized when mold temperature is at the low level, there are no significant control by noise interactions to exploit.
Too much variability in % Shrinkage at low screw speed. This will still cause problems in assembly.
Box plots show C: holding time is a dispersion effect. Choosing the low level of holding time reduces variability in % shrinkage.