Predictive Analysis of Clinical Trials Richard Simon D


can be evaluated by")


- Slides: 111
Predictive Analysis of Clinical Trials Richard Simon, D. Sc. Chief, Biometric Research Branch National Cancer Institute http: //brb. nci. nih. gov
Biomarker = Biological Measurement n n Early detection biomarker Endpoint biomarker Prognostic biomarkers Predictive biomarkers
Kinds of Biomarkers n Endpoint Measured before, during and after treatment to monitor pace of disease and treatment effect n Pharmacodynamic (phase 0 -1) n n n Intermediate response (phase 2) n n Does drug hit target Does drug have anti-tumor effect Surrogate for clinical outcome (phase 3)
n Prognostic biomarkers n n Measured before treatment to indicate long-term outcome for patients untreated or receiving standard treatment May reflect both disease aggressiveness and effect of standard treatment Used to determine who needs more intensive treatment Predictive biomarkers n Measured before treatment to identify who will benefit from a particular treatment
Validation = Fitness for Intended Use
n n Single gene or protein measurement Scalar index or classifier that summarizes contributions of multiple genes
Prognostic & Predictive Biomarkers in Genomic Oncology n n Many cancer treatments benefit only a minority of patients to whom they are administered Being able to predict which patients are likely to benefit can n Help patients get an effective treatment Help control medical costs Improve the success rate of clinical drug development
Biomarker Validity n Analytical validity Measures what it’s supposed to n Reproducible and robust n n Clinical validity (correlation) n n It correlates with something clinically Medical utility n Actionable resulting in patient benefit
Clinical Utility n Prognostic and predictive biomarkers have utility if they are actionable for informing treatment decisions in a manner that results in patient benefit
Clinical Utility n Biomarker benefits patient by improving treatment decisions Identify patients who have very good prognosis on standard treatment and do not require more intensive regimens n Identify patients who are likely or unlikely to benefit from a specific regimen n
Prognostic markers n n There is an enormous published literature on prognostic markers in cancer. Very few prognostic markers (factors) are recommended for measurement by ASCO, are approved by FDA or are reimbursed for by payers. Very few play a role in treatment decisions.
Pusztai et al. The Oncologist 8: 252 -8, 2003 n n n 939 articles on “prognostic markers” or “prognostic factors” in breast cancer in past 20 years ASCO guidelines only recommend routine testing for ER, PR and HER-2 in breast cancer “With the exception of ER or progesterone receptor expression and HER-2 gene amplification, there are no clinically useful molecular predictors of response to any form of anticancer therapy. ”
Prognostic Factors in Oncology n n Most prognostic factors are not used because they are not therapeutically relevant Most prognostic factor studies are not conducted with an intended use clearly in mind n They use a convenience sample of patients for whom tissue is available. n Generally the patients are too heterogeneous to support therapeutically relevant conclusions There is rarely a validation study separate from the developmental study that addresses medical utility An analytically validated test is rarely developed
n Prognostic factors for such a heterogeneous group of patients is not “actionable”; i. e. does not help with trteatment decision making.
Major problems with prognostic studies of gene expression signatures n Inadequate focus on intended use Cases selected based on availability of specimens rather than for relevance to intended use n Heterogeneous sample of patients with mixed stages and treatments. Attempt to disentangle effects using regression modeling n Too a great a focus on which marker is prognostic or independently prognostic, not n
If you don’t know where you are going, you might not get there Yogi Berra
Prognostic Biomarkers Can be Therapeutically Relevant n <10% of node negative ER+ breast cancer patients require or benefit from the cytotoxic chemotherapy that they receive
Oncotype. Dx Recurrence Score n n n Intended use: Patients with node negative estrogen receptor positive breast cancer who are going to receive an anti-estrogen drug following local surgery/radiotherapy Identify patients who have such good prognosis that they are unlikely to derive much benefit from adjuvant chemotherapy
n n Selected patients relevant for the intended use Analyzed the data to see if the recurrence score identified a subset with such good prognosis that the absolute benefit of chemotherapy would at best be very small in absolute terms
Biotechnology Has Forced Biostatistics to Focus on Prediction n This has led to many exciting methodological developments n n p>>n problems in which number of genes is much greater than the number of cases And many erroneous publications And growing pains in transitioning from an overdependence on inference Many of the methods and much of the conventional wisdom of statistics are based on inference problems and are not applicable to prediction problems
n n n Goodness of fit is not a proper measure of predictive accuracy Odds ratios and hazards ratios are not proper measures of prediction accuracy Statistical significance of regression coefficients are not proper measures of predictive accuracy
Prediction on Simulated Null Data Simon et al. J Nat Cancer Inst 95: 14, 2003 Generation of Gene Expression Profiles • 20 specimens (Pi is the expression profile for specimen i) • Log-ratio measurements on 6000 genes • Pi ~ MVN(0, I 6000) • Can we distinguish between the first 10 specimens (Class 1) and the last 10 (Class 2)? Prediction Method • Compound covariate predictor built from the log-ratios of
Cross Validation n n Cross-validation simulates the process of separately developing a model on one set of data and predicting for a test set of data not used in developing the model The cross-validated estimate of misclassification error is an estimate of the prediction error for model fit using specified algorithm to full dataset
Cross-validation Estimate of Prediction Error 28
n n Cross validation is only valid if the test set is not used in any way in the development of the model. Using the complete set of samples to select genes violates this assumption and invalidates crossvalidation. With proper cross-validation, the model must be developed from scratch for each leave-one-out training set. This means that feature selection must be repeated for each leave-one-out training set.
Predictive Biomarkers n Cancers of a primary site often represent a heterogeneous group of diverse molecular entities which vary fundamentally with regard to the oncogenic mutations that cause them n their responsiveness to specific drugs n
Most cancer treatments benefit only a minority of patients to whom they are administered n Being able to predict who requires intensive treatment and who is likely to benefit from which treatments could n n save patients from unnecessary debilitating adverse effects of treatments that they don’t need or benefit from enhance their chance of receiving a treatment that helps them Help control medical costs Improve the success rate of clinical drug development
n In most positive phase III clinical trials comparing a new treatment to control, most of the patients treated with the new treatment did not benefit. n Adjuvant breast cancer: 70% long-term disease-free survival on control. 80% diseasefree survival on new treatment. 70% of patients don’t need the new treatment. Of the remaining 30%, only 1/3 rd benefit.
Predictive Biomarkers n n n n Estrogen receptor over-expression in breast cancer n Anti-estrogens, aromatase inhibitors HER 2 amplification in breast cancer n Trastuzumab, Lapatinib Oncotype. Dx gene expression recurrence score in breast cancer n Low score for ER+ node - -> no chemotherapy KRAS in colorectal cancer n WT KRAS = cetuximab or panitumumab EGFR mutation in NSCLC n EGFR inhibitor V 600 E mutation in BRAF of melanoma n vemurafenib ALK translocation in NSCLC n crizotinib
Standard Paradigm of Broad Eligibility Phase III Clinical Trials Sometimes Leads to n Treating many patients with few benefiting Small average treatment effects n Problematic for health care economics n n n Inconsistency in results among studies False negative studies
n n The standard approach to designing phase III clinical trials is based on two assumptions Qualitative treatment by subset interactions are unlikely “Costs” of over-treatment are less than “costs” of under-treatment
n n Oncology therapeutics development is now focused on molecularly targeted drugs that are only expected to be effective in a subset of patients whose tumors are driven by the molecular targets Most new cancer drugs are very expensive n the aspirin paradigm on which some current clinical trial dogma is based is a roadblock to progress
Subset Analysis n In the past often studied as un-focused post-hoc analyses n n Numerous subsets examined Same data used to define subsets for analysis and for comparing treatments within subsets No control of type I error Led to conventional wisdom n n n Only hypothesis generation Only valid if overall treatment difference is significant Only valid if there is a significant treatment by subset interaction
n Neither current practices of subset analysis nor current practices of ignoring differences in treatment effect among patients are effective for evaluating treatments where qualitative interactions are likely or for informing labeling indications
n n Although the randomized clinical trial remains of fundamental importance for predictive genomic medicine, some of the conventional wisdom of how to design and analyze rct’s requires reexamination The concept of doing an rct of thousands of patients to answer a single question about average treatment effect for a target population presumed homogeneous with regard to the direction of treatment efficacy in many cases no longer has an adequate scientific basis
n How can we develop new drugs in a manner more consistent with modern tumor biology and obtain reliable information about what regimens work for what kinds of patients?
Development is Most Efficient When the Scientific Basis for the Clinical Trial is Strong n Having an important molecular target n Having a drug that can inhibit the target in an overwhelming proportion of tumor cells at an achievable concentration n Having a pre-treatment assay that can identify the patients for whom the molecular target is driving progression of disease
When the Biology is Clear n Develop a classifier that identifies the patients likely (or unlikely) to benefit from the new drug n n Develop an analytically validated test n n Classifier is based on either a single gene/protein or composite score Measures what it should accurately and reproducibly Design a focused clinical trial to evaluate effectiveness of the new treatment in test +
Using phase II data, develop predictor of response to new drug Develop Predictor of Response to New Drug Patient Predicted Responsive Patient Predicted Non-Responsive Off Study New Drug Control Targeted (Enrichment) Design
Evaluating the Efficiency of Targeted Design n Simon R and Maitnourim A. Evaluating the efficiency of targeted designs for randomized clinical trials. Clinical Cancer Research 10: 6759 -63, 2004; Correction and supplement 12: 3229, 2006 n Maitnourim A and Simon R. On the efficiency of targeted clinical trials. Statistics in Medicine 24: 329 -339, 2005.
n Relative efficiency of targeted design depends on n proportion of patients test positive specificity of treatment effect for test positive patients When less than half of patients are test positive and the drug has minimal benefit for test negative patients, the targeted design requires dramatically fewer randomized patients than the standard design in which the marker is not used
Two Clinical Trial Designs n Standard design n n Targeted design n n n Randomized comparison of new drug E to control C without the test for screening patients Test patients Randomize only test + patients Treatment effect D+ in test + patients Treatment effect D- in test – patients Proportion of patients test + is p+ Size each design to have power 0. 9 and significance level 0. 05
Rand. Rat = nuntargeted/ntargeted n If D-=0, Rand. Rat = 1/ p+2 n n if p+=0. 5, Rand. Rat=4 If D-= D+/2, Rand. Rat = 4/(p+ +1)2 n if p+=0. 5, Rand. Rat=16/9=1. 77
Comparing T vs C on Survival or DFS 5% 2 -sided Significance and 90% Power % Reduction in Hazard Number of Events Required 25% 509 30% 332 35% 227 40% 162 45% 118 50% 88
n Hazard ratio 0. 60 for test + patients n n 40% reduction in hazard Hazard ratio 1. 0 for test – patients n 0% reduction in hazard 33% of patients test positive n Hazard ratio for unselected population is n 0. 33*0. 60 + 0. 67*1 = 0. 87 n 13% reduction in hazard n
n To have 90% power for detecting 40% reduction in hazard within a biomarker positive subset n n Number of events within subset = 162 To have 90% power for detecting 13% reduction in hazard overall n Number of events = 2172
Trastuzumab Herceptin n n Metastatic breast cancer 234 randomized patients per arm 90% power for 13. 5% improvement in 1 -year survival over 67% baseline at 2 -sided. 05 level If benefit were limited to the 25% test + patients, overall improvement in survival would have been 3. 375% n 4025 patients/arm would have been required
Web Based Software for Planning Clinical Trials of Treatments with a Candidate Predictive Biomarker n http: //brb. nci. nih. gov
Principle n If a drug is found safe and effective in a defined patient population, approval should not depend on finding the drug ineffective in some other population
Implications for Early Phase Studies n n Need to design and size early phase studies to discover an effective predictive biomarker for identifying the correct target population Need to establish an analytically validated test for measuring the predictive marker in the phase III pivotal studies
When the drug is specific for one target and the biology is well understood n May need to evaluate several candidate tests n n n e. g. protein expression of target or amplification of gene Need to decide whether to include test negative patients in phase II trials Phase II trials sized for adequate numbers of test positive patients
When the drug has several targets or the biology is not well understood n n n Should biologically characterize tumors for all patients on phase II studies with regard to candidate targets and response moderators Phase II trials sized for evaluating candidates Opportunity for sequential and adaptive designs to improve efficiency
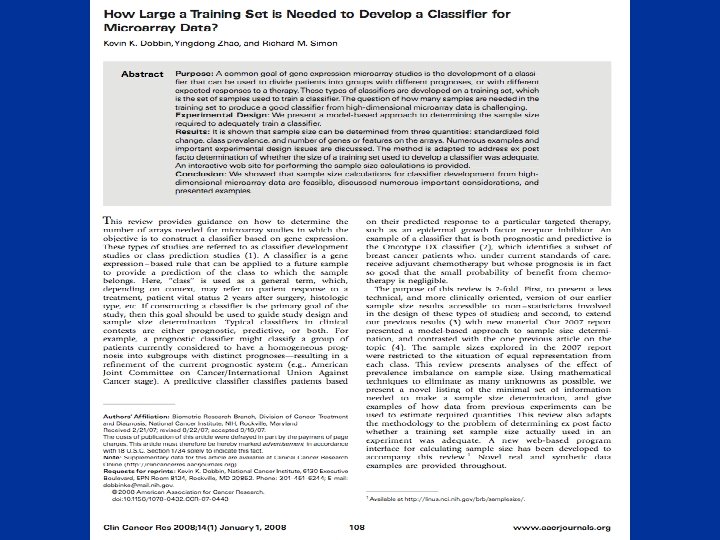
Empirical screening of expression profiles or mutations to develop predictive marker n Larger sample size required n n n Dobbin, Zhao, Simon, Clinical Ca Res 14: 108, 2008. Use of archived samples from previous negative phase III trial Use of large disease specific panel of molecularly characterized human tumor cell lines to identify predictive marker
“Stratification Design” “Interaction Design” Develop Predictor of Response to New Rx Predicted Responsive To New Rx New RX Predicted Non-responsive to New Rx Control New RX Control
Develop prospective analysis plan for evaluation of treatment effect and how it relates to biomarker n n n Defined analysis plan that protects type I error Trial sized for evaluating treatment effect in test + and test – subsets Test negative patients should be adequately protected using interim futility analysis
Fallback Analysis Plan n Test average treatment effect at reduced level p 0 (e. g. . 01) n n If overall effect is not significant, test treatment effect in marker + subset at level. 05 -p 0 n n If significant claim broad effectiveness If significant claim effectiveness for marker + subset Test of marker + subset should not require either n n Overall significance nor Significant interaction 63
Sample size for Analysis Plan n n To have 90% power for detecting uniform 33% reduction in overall hazard at 1% two-sided level requires 370 events. If 33% of patients are positive, then when there are 370 total events there will be approximately 123 events in positive patients n 123 events provides 90% power for detecting a 45% reduction in hazard at a 4% two-sided significance level.
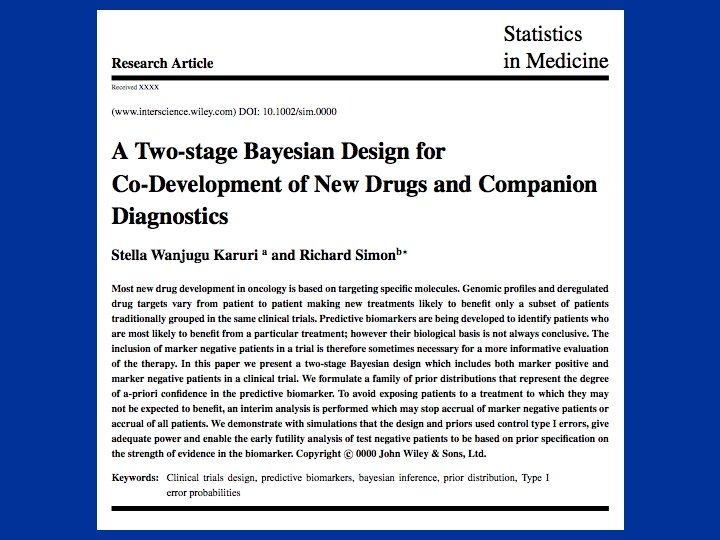
Bayesian Two-Stage Design RCT With Single Binary Marker 68
The Biology is Often Not So Clear n Cancer biology is complex and it is not always possible to have the right single predictive classifier identified with an appropriate cut-point by the time the phase 3 trial of a new drug is ready to start accrual
The Objectives of a Phase III Clinical Trial n Test the strong null hypothesis that the test treatment is uniformly ineffective compared to control for primary endpoint n If the null hypothesis is rejected, develop a labeling indication for informing physicians in their decisions about which patients they treat with the drug.
n n The test of the null hypothesis of no average treatment effect is not necessarily a good test of the strong null hypothesis that the new treatment is uniformly ineffective Rejection of the null hypothesis is not in itself adequate information for guiding physicians on how to use the treatment
Biomarker Selection Design Based on Adaptive Threshold Design W Jiang, B Freidlin & R Simon JNCI 99: 1036 -43, 2007 72
Biomarker Selection Design Have identified K candidate biomarkers B 1 , …, BK thought to be predictive of patients likely to benefit from T relative to C n Cut-points not necessarily established for each biomarker n Eligibility not restricted by candidate markers n
Marker Selection Design
n n Compute p* = min{p 1 , p 2 , …, p. K} Compute whether the value of p* is statistically significant when adjusted for multiple testing Adjust for multiple testing by permuting the treatment labels and re-calculating p 1…p. K and p* for the permuted treatment labels n Repeat for 10, 000 random permutations to approximate the null distribution of p* n
n n n To detect a 40% reduction in hazard in an apriori defined subset with 90% power and a 4% two-sided significance level requires 171 events in the subset. To adjust for multiplicity with 4 independent binary tests, 171 -> 224. If 33% are positive for each marker, then the trial might be sized for 3*224= total 672 events.
Designs When there are Many Candidate Markers and too Much Patient Heterogeneity for any Single Marker
Adaptive Signature Design
n n The indication classifier is not a binary classifier of whether a patient has good prognosis or poor prognosis It is a “two sample classifier” of whether the prognosis of a patient on E is better than the prognosis of the patient on C
n n The indication classifier can be a binary classifier that maps the vector of candidate covariates into {E, C} indicating which treatment is predicted superior for that patient The classifier need not use all the covariates but variable selection must be determined using only the training set n n Variable selection may be based on selecting variables with apparent interactions with treatment, with cut-off for variable selection determined by cross-validation within training set for optimal classification The indication classifier can be a probabilistic classifier 81
82
83
Treatment effect restricted to subset. 10% of patients sensitive, 400 patients. Test Power Overall. 05 level test 46. 7 Overall. 04 level test 43. 1 Sensitive subset. 01 level test 42. 2 (performed only when overall. 04 level test is negative) Overall adaptive signature design 85. 3
Overall treatment effect, no subset effect. 400 patients Test Power Overall. 05 level test 74. 2 Overall. 04 level test 70. 9 Sensitive subset. 01 level test 1. 0 Overall adaptive signature design 70. 9
n This approach can be used with any set of candidate predictor variables n This approach can also be used to identify the subset of patients who don’t benefit from E in cases where E is superior to C overall
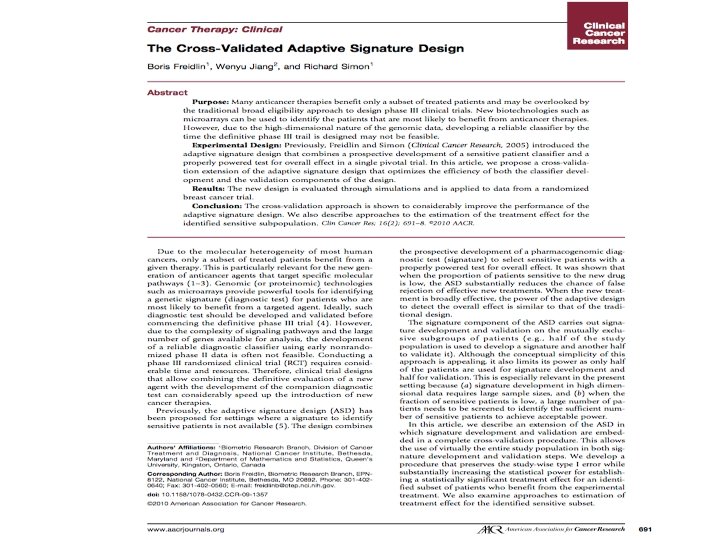
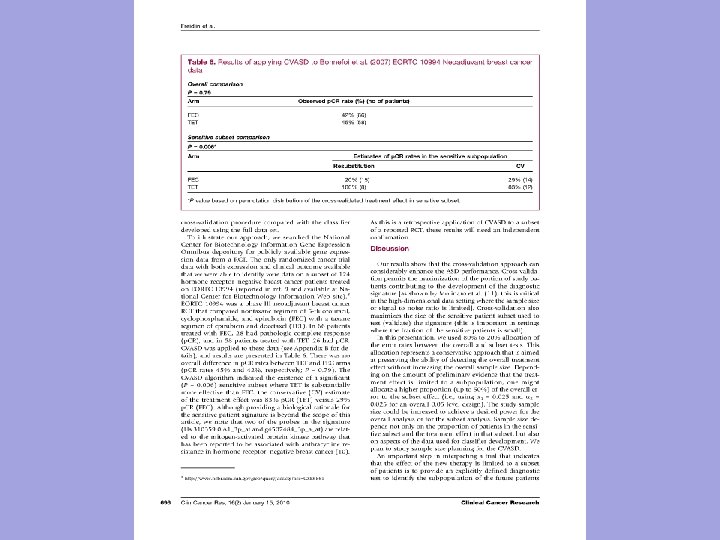
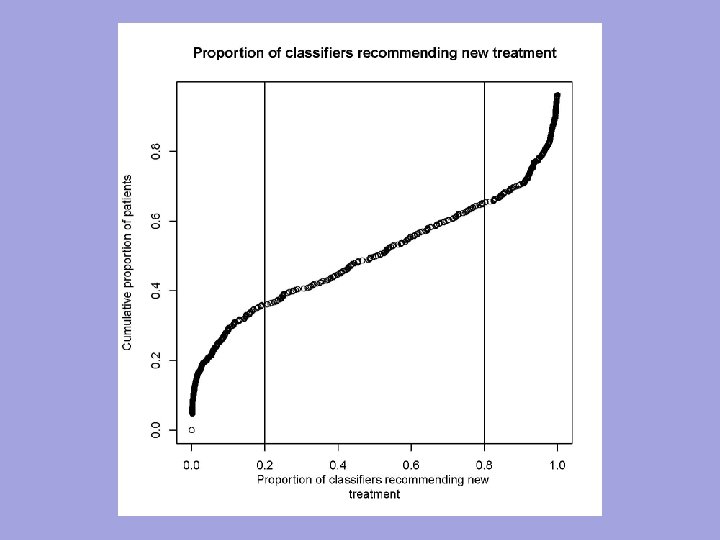
Cross-Validated Adaptive Signature Design • • • Define indication classifier development algorithm A Apply algorithm to full dataset to develop indication classifier for use in future patients M(x; A, P) Using K fold cross validation • • Classify patients in test sets based on classifiers developed in training sets; e. g. yi=M(xi; A, P-i) S={i : yi = E} Compare E to C in S and estimate size of treatment effect is an estimate of the size of the treatment effect for future patients with M(x; A, P)=E
Cross-Validated Adaptive Signature Design • • Approximate null distribution of Permute treatment labels • • Repeat complete cross-validation procedure Generate permutation distribution of the values for permuted data • Test null hypothesis that the treatment effect in classifier positive patients is null using as test statistic cross-validated estimate of treatment effect in positive patients
Key Ideas • • Replace multiple significance testing by development of one indication classifier Control study-wise type I error for significance test of • • Overall average treatment effect Treatment effect in classifier positive patients Test of treatment effect in classifier positive patients does not depend on significance of overall test nor on significant interaction Obtain unbiased or conservative estimate of the treatment effect of future classifier positive patients
• • The size of the E vs C treatment effect for the indicated population is (conservatively) estimated from the cross validation by the Kaplan Meier survival curves of E and of C in S The Kaplan-Meier curves of E and C for patients in S provides an estimate of
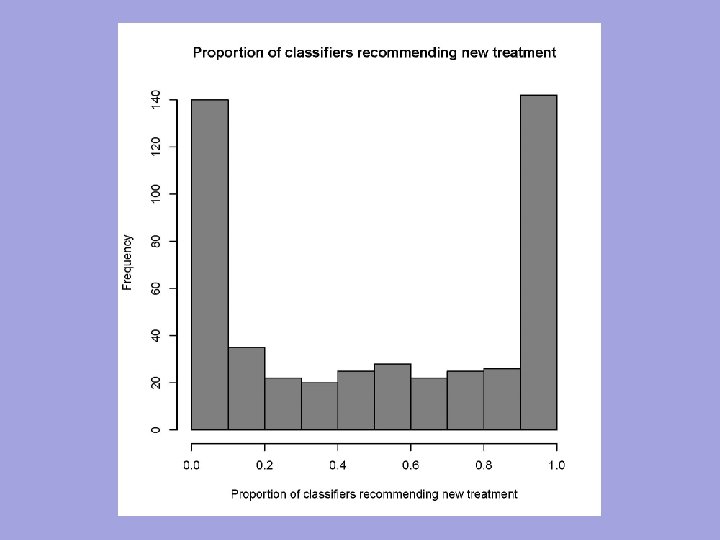
• The stability of the indication classifier M(x; A, D)can be evaluated by examining the consistency of classifications M(xi; A, B) for bootstrap samples B from D.
• Although there may be less certainty about exactly which types of patient benefit from E relative to C, classification may be better than for many standard clinical trial in which all patients are classified based on results of testing the single overall null hypothesis
70% Response to E in Sensitive Patients 25% Response to E Otherwise 25% Response to C 30% Patients Sensitive ASD CV-ASD Overall 0. 05 Test 0. 830 0. 838 Overall 0. 04 Test 0. 794 0. 808 Sensitive Subset 0. 01 Test 0. 306 0. 723 Overall Power 0. 825 0. 918
25% Response to T 25% Response to C No Subset Effect ASD CV-ASD Overall 0. 05 Test 0. 047 0. 056 Overall 0. 04 Test 0. 048 Sensitive Subset 0. 01 Test 0. 001 0 Overall Power 0. 041 0. 048
For Binary Outcome
For Binary Outcome
506 prostate cancer patients were randomly allocated to one of four arms: Placebo and 0. 2 mg of diethylstilbestrol (DES) were combined as control arm C 1. 0 mg DES, or 5. 0 mg DES were combined as T. The end-point was overall survival (death from any cause). Covariates: Age, performance status (pf), tumor size (sz), stage/grade index (sg), serum acid phosphatase (ap)
Figure 1: Overall analysis. The value of the log-rank statistic is 2. 9 and the corresponding p-value is 0. 09. The new treatment thus shows no benefit overall at the 0. 05 level.
Figure 2: Cross-validated survival curves for patients predicted to benefit from the new treatment. log-rank statistic = 10. 0, permutation p-value is. 002
Figure 3: Survival curves for cases predicted not to benefit from the new treatment. The value of the log-rank statistic is 0. 54.
Prediction Based Clinical Trials • We can evaluate our methods for analysis of clinical trials in terms of their effect on patient outcome via informing therapeutic decision making
Expected Survival Distribution for Future Patients With Standard Analysis
Expected Survival Distribution for Future Patients With Indication Classifier
• Hence, alternative methods for analyzing RCT’s can be evaluated in an unbiased manner with regard to their value to patients using the actual RCT data
Conclusions n n n New biotechnology and knowledge of tumor biology provide important opportunities to improve therapeutic decision making Treatment of broad populations with regimens that do not benefit most patients is increasingly no longer necessary nor economically sustainable The established molecular heterogeneity of human diseases requires the use new approaches to the development and
Acknowledgements n n Boris Freidlin Wenyu Jiang Aboubakar Maitournam Jyothi Subramanian