How Can Predictive Analytics in Healthcare Insurance Save

 low annual claim cost")


- Slides: 21
How Can Predictive Analytics in Healthcare Insurance Save Money? Lina Jichi, Manager of Health Financing Advisory and Monitoring, Department of Health - Abu Dhabi (DOH)
• Payers choose Providers with low Provider prices (multiplier) low annual claim cost • Facilities hiring more GPs lower Facility spend • Payers applying Caps on Claims lower claim cost • Facilities asking their physicians to code save on coders cost However, they are missing the target!
For simplicity, let us narrow the discussion down to controlling health insurance claims cost Claim cost components 1 1 Ineffective ways to reduce cost 2 2 Elements of success 3 3
Claim cost components Claim Cost Unit Cost Utilization • # of claims (Visits + follow up visits after the free 7 days) • # of the activities in each non bundled claim • Activities utilization pattern by type (Activity price) • • Basic Price list Multiplier Medical Inflation Equipment & Devices
We created the Financing Model to better understand the high level links among the components of the Health Financing System and produce financial projections the next 10 years. In summary: Source Individuals Government (Do. F) Insurance Intermediary Sink Employers Public Providers Private Providers Foreign Providers . . This helps to classify which initiatives will shift the spend from one component to another vs. the initiatives that actually saves money from the total healthcare cost Source Health Statistics Analysis
But the provider income is based on many factors Utilization Provider income driver tree Provider Activity Product 1 Inpatient + + Product 2 … + Outpatient Product n Members × + Governme nt subsidy + Other Reimbursement = Claim net * (1 - denial rate) * (1+ IBNR[Incurred but not reported]) Out of pocket = Self pay + Patient Share Other Income = Medical Tourism in UAE + Research grants × Public/priv ate Share × Payment Reimb’t + Out of pocket
Insurance premium driver tree Gov’t* + Premium Insurance Premium Product 1 × + Members Product 2 … + Product n * Government contribution = Basic Product Subsidy Employer + Beneficiary
By proper modeling and detailed assumptions, future spend can be predicted more accurately accounting for the financial impact of the initiatives , whether it is truly “improving efficiency” OR “causing lack of control” Source Health Statistics Analysis
Claim cost components 1 1 Ineffective ways to reduce cost 2 2 Elements of success 3 3
Evaluation based on local and international data Weqaya portal Providers Knowledge Engine for Health DW Payers Strategy Data architecture Statistics & Modelling Demographics e. Claims Pharmacy Benefits Management e. Authorisation e. Prescribing Routine reporting: Diabetes Hb. A 1 c Fasting plasma glucose Plasma glucose Fasting triglyceride Blood cholesterol LDL Blood cholesterol HDL Albumin Microalbumin Clinical signs Body Height Body Weight Intravascular systolic Intravascular diastolic History of tobacco use Breast cancer Screening Mammography Unlisted codes Activity cost Cancer Date of Initial Encounter Date of Initial Diagnosis Date of Initial Treatment Primary Site Histology Sequence Number Behaviour Grade Laterality Basis of Diagnosis Clinical T, N, M Clinical Stage Group Pathologic T, N, M Pathologic Stage Group Multiplicity Counter Marital Status Occupation City of Residence Strategy HF Advisory & Monitoring Strategy Policy & Standards Profess ional Provide rs Insurer sl Policy Manuals Weqaya Random glucose Hb. A 1 c Total cholesterol Blood cholesterol in HDL Total vitamin D Serum Creatinine Body height Body weight Intravascular systolic Intravascular diastolic Circumference at umbilicus Circumference 100 -questionnaire: • Education • Employment • Network • Family history • Smoking • Food choice • Physical activity Data validation for clinical quality management system External and internal requests Advise to other departments Health System Strategy Review Health System Regulation Analysis of prescribing patterns Enforcement of compliance Public Health Weqaya CVD, Asthma analyses Key Performance Indicators Financing model DRG weights update Compliance enforcement framework DG office External requests Regulat ors Policy impact assessment Policy evaluation Planning & Investment Communications Publications of health sector data in media Health System. Financing Audit Enforcement Mandatory Tariff Key Performance Indicators Planning applications Capacity planning Capacity management initiative
We classified ineffective ways to reduce claim cost Type 1 15 Type 1: Decrease claim cost temporarily but increase it shortly after 10 5 0 Type 2: Decrease claim cost while negatively affecting quality and/or access which lead to increasing ED or inpatient admission higher cost in the long term Type 3: Do not reduce claim cost and sometimes even increase it due to providers identification of some workaround to avoid revenue loss 1 2 3 4 5 6 Type 2 12 10 8 6 4 2 0 1 2 3 4 5 6 Type 3 20 15 10 5 0 1 2 3
Ineffective ways examples 1. Determining price based on few hospitals cost encourages inefficiency 2. Determining a facility’s multiplier based on the facility group multiplier more common specialty clinics will open in overserved areas (so higher utilization here) and less access in underserved (less access here will push for more ED and inpatient admissions) 3. Over rejecting claims higher cost to reprocess claims and/or providers to over-utilize
Ineffective ways examples 4. Reducing Audits for more saving on operational cost providers to up-code 5. Adopting tools and initiatives from non-compatible insurance systems without customization unexpected consequences and unclear financial impact 6. Targeting the controls on higher unit cost services and lack of detailed analysis to identify higher utilization activities Providers to increase over utilizing the non targeted services
Claim cost components 1 1 Ineffective ways to reduce cost 2 2 Elements of success 3 3
Elements of success 1. 2. 3. To really believe that you need to save on cost Each claim cost reduction initiative to be evaluated from the 3 angles: access, quality, and cost, and evaluation should be over the short term and long term Finally, most sustainable claim cost control initiatives for payers are the initiatives that encourage providers cost efficiency too, so when a provider have a lower cost of a total service, he will be less likely to resist a small total service price reduction, such as DRGs and homecare bundled services- so bundling while monitoring and rewarding positive outcomes are the keys to ensure financial efficiency and sustainability 1. Encounter Type: Inpatient, Outpatient, Emergency 2. Member group: Basic, Enhanced, Thiqa 3. Providers : Public, Private, Abroad 4. Diagnosis Group: Respiratory, Circulatory, Digestive, … 5. Increase reason : Population Increase, Utilization change, Price Inflation
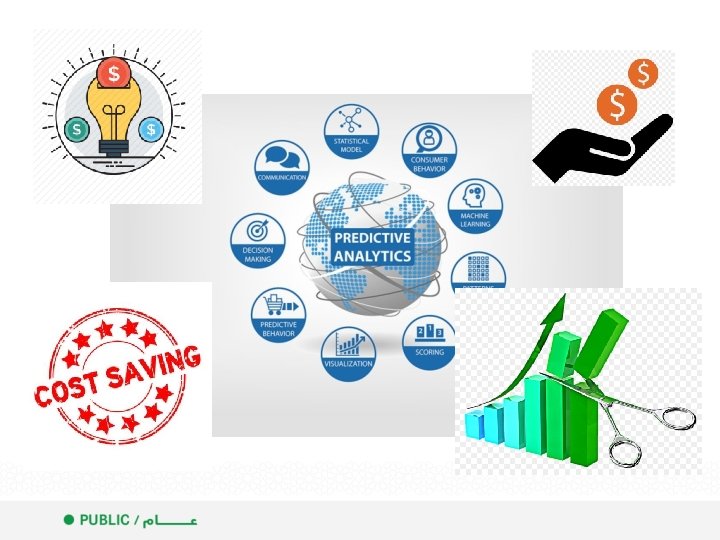
Data Analytics can also be used in monitoring utilization and financial sustainability on a daily basis
Where to start? If you have not done so already, we recommend having a detailed dashboard by count and dirham amount of the most granular level of data points available and identifying your actual cost, historical trends and projections: Payers Providers • Product# • Facility # • Main • Service line Policyholder • Doctor • Facility • Nurses • Service line • Inpatient • Outpatient • Labs • Service type • Pharma • Quality & Financial KPIs
Questions?