
Predictive Analytics in Higher Education And an OCCC
- Slides: 17
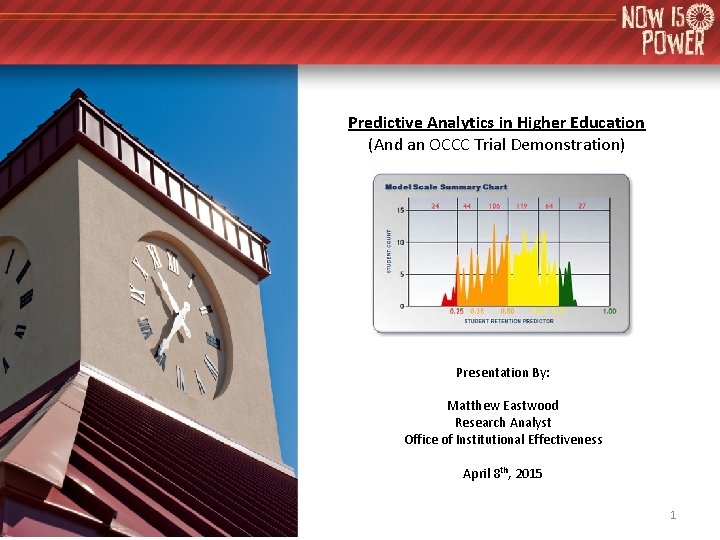
Predictive Analytics in Higher Education (And an OCCC Trial Demonstration) Presentation By: Matthew Eastwood Research Analyst Office of Institutional Effectiveness April 8 th, 2015 1
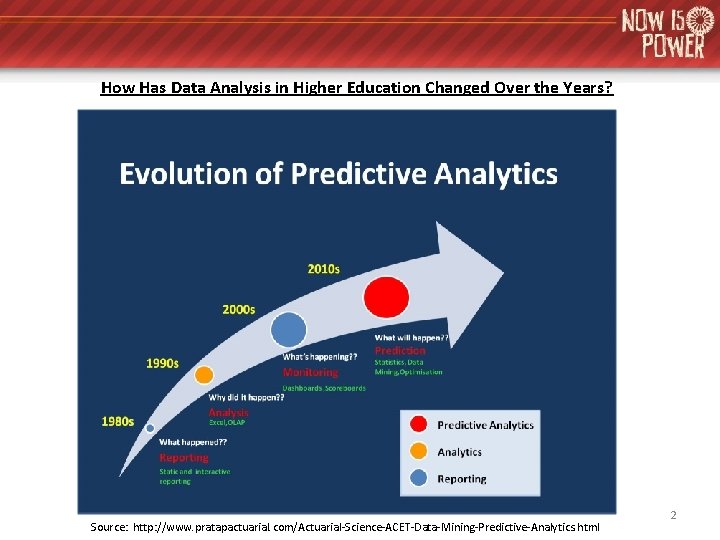
How Has Data Analysis in Higher Education Changed Over the Years? Source: http: //www. pratapactuarial. com/Actuarial-Science-ACET-Data-Mining-Predictive-Analytics. html 2
What is Predictive Analytics you ask? Predictive analytics is the practice of extracting information from existing data sets in order to determine patterns and predict future outcomes and trends. Predictive analytics does not tell you what will happen in the future. It forecasts what might happen in the future with an acceptable level of reliability. Source: http: //www. webopedia. com/TERM/P/predictive_analytics. html 3
What have been some traditional industry sources utilizing predictive analytics? - Actuarial Science Financial Services Insurance Manufacturing Telecommunications Retail Travel/Logistics Marketing Energy/Utilities Airlines More recent large industry sources: - Healthcare - Education - Government 4
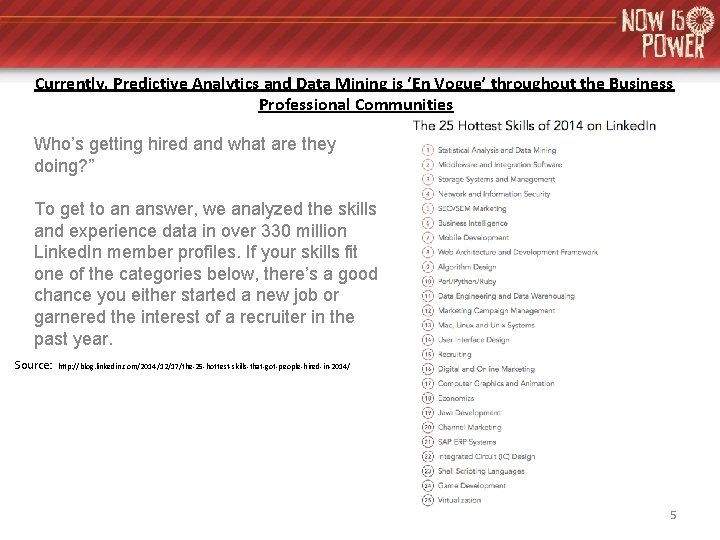
Currently, Predictive Analytics and Data Mining is ‘En Vogue’ throughout the Business Professional Communities Who’s getting hired and what are they doing? ” To get to an answer, we analyzed the skills and experience data in over 330 million Linked. In member profiles. If your skills fit one of the categories below, there’s a good chance you either started a new job or garnered the interest of a recruiter in the past year. Source: http: //blog. linkedin. com/2014/12/17/the-25 -hottest-skills-that-got-people-hired-in-2014/ 5
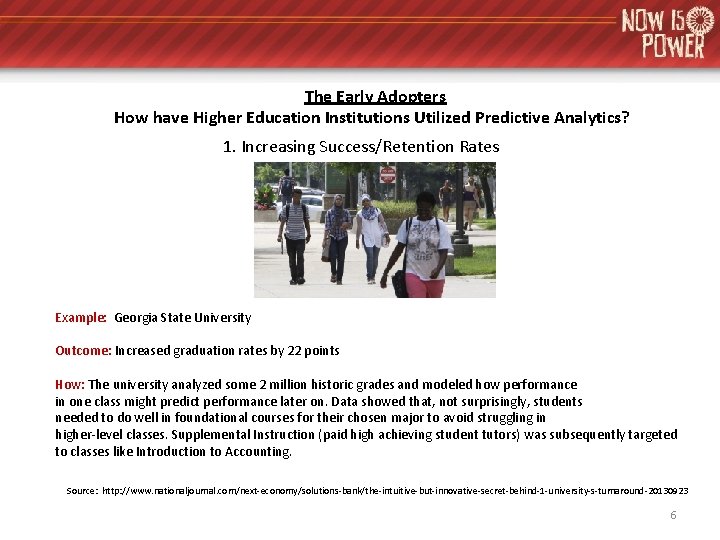
The Early Adopters How have Higher Education Institutions Utilized Predictive Analytics? 1. Increasing Success/Retention Rates Example: Georgia State University Outcome: Increased graduation rates by 22 points How: The university analyzed some 2 million historic grades and modeled how performance in one class might predict performance later on. Data showed that, not surprisingly, students needed to do well in foundational courses for their chosen major to avoid struggling in higher-level classes. Supplemental Instruction (paid high achieving student tutors) was subsequently targeted to classes like Introduction to Accounting. Source: http: //www. nationaljournal. com/next-economy/solutions-bank/the-intuitive-but-innovative-secret-behind-1 -university-s-turnaround-20130923 6
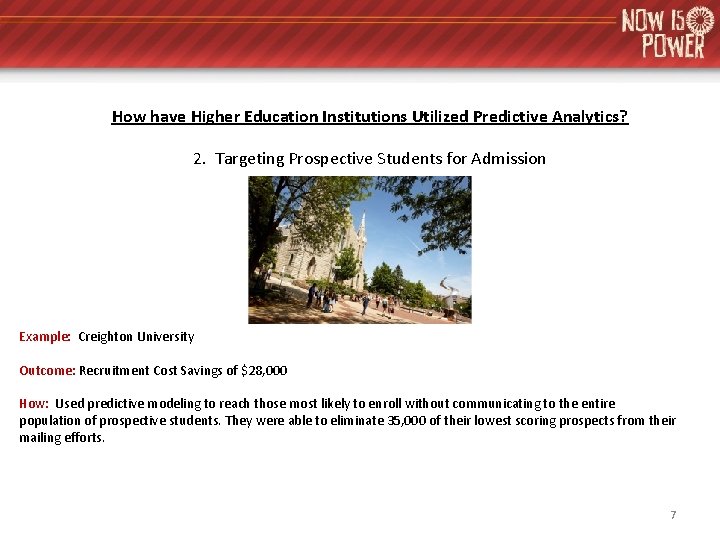
How have Higher Education Institutions Utilized Predictive Analytics? 2. Targeting Prospective Students for Admission Example: Creighton University Outcome: Recruitment Cost Savings of $28, 000 How: Used predictive modeling to reach those most likely to enroll without communicating to the entire population of prospective students. They were able to eliminate 35, 000 of their lowest scoring prospects from their mailing efforts. 7
How have Higher Education Institutions Utilized Predictive Analytics? 3. Identify underprepared students when they enter campus Example: University of Texas - Austin Outcome: Intervention group had good standing GPA (>= 2. 0) for 87% of students compared to 78% for like students not provided the intervention How: The University Leadership Network (ULN), started in the 2013– 2014 academic year, is a scholarship and experiential learning program which uses predictive analytics to identify students with academic and financial need and help them develop leadership skills. Students receive $5, 000 per year over four years, paid out in ten $500 payments. During their first-year, students in ULN work on academic and professional development while performing community service, participating in discussion groups, and attending weekly seminars on topics such as time management, professional branding, and team building. In their second-year, students intern in various on-campus offices where they learn real-world job skills. Source: http: //www. theuia. org/sites/default/files/UIA_predictive_onepagers. pdf 8
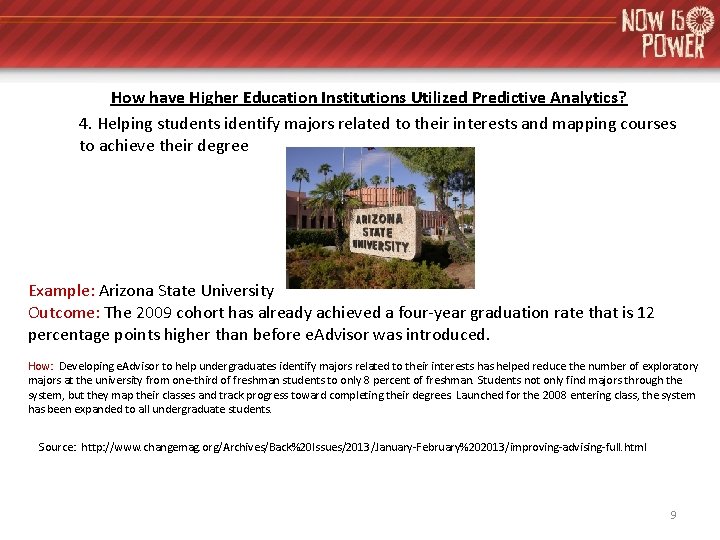
How have Higher Education Institutions Utilized Predictive Analytics? 4. Helping students identify majors related to their interests and mapping courses to achieve their degree Example: Arizona State University Outcome: The 2009 cohort has already achieved a four-year graduation rate that is 12 percentage points higher than before e. Advisor was introduced. How: Developing e. Advisor to help undergraduates identify majors related to their interests has helped reduce the number of exploratory majors at the university from one-third of freshman students to only 8 percent of freshman. Students not only find majors through the system, but they map their classes and track progress toward completing their degrees. Launched for the 2008 entering class, the system has been expanded to all undergraduate students. Source: http: //www. changemag. org/Archives/Back%20 Issues/2013/January-February%202013/improving-advising-full. html 9
Currently, Information Tech. Companies are Marketing Heavily towards Higher Education 10
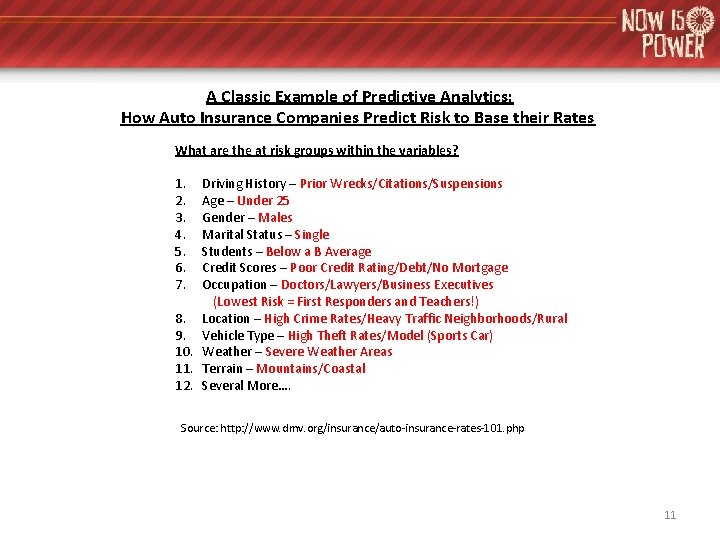
A Classic Example of Predictive Analytics: How Auto Insurance Companies Predict Risk to Base their Rates What are the at risk groups within the variables? 1. 2. 3. 4. 5. 6. 7. Driving History – Prior Wrecks/Citations/Suspensions Age – Under 25 Gender – Males Marital Status – Single Students – Below a B Average Credit Scores – Poor Credit Rating/Debt/No Mortgage Occupation – Doctors/Lawyers/Business Executives (Lowest Risk = First Responders and Teachers!) 8. Location – High Crime Rates/Heavy Traffic Neighborhoods/Rural 9. Vehicle Type – High Theft Rates/Model (Sports Car) 10. Weather – Severe Weather Areas 11. Terrain – Mountains/Coastal 12. Several More…. Source: http: //www. dmv. org/insurance/auto-insurance-rates-101. php 11
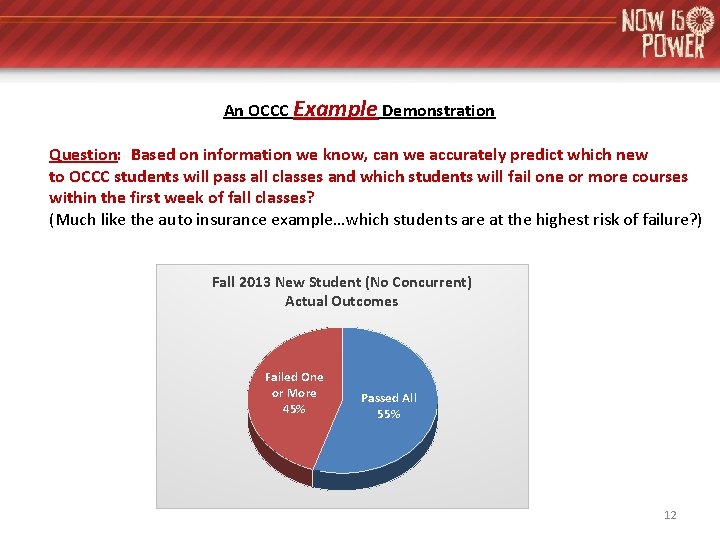
An OCCC Example Demonstration Question: Based on information we know, can we accurately predict which new to OCCC students will pass all classes and which students will fail one or more courses within the first week of fall classes? (Much like the auto insurance example…which students are at the highest risk of failure? ) Fall 2013 New Student (No Concurrent) Actual Outcomes Failed One or More 45% Passed All 55% 12
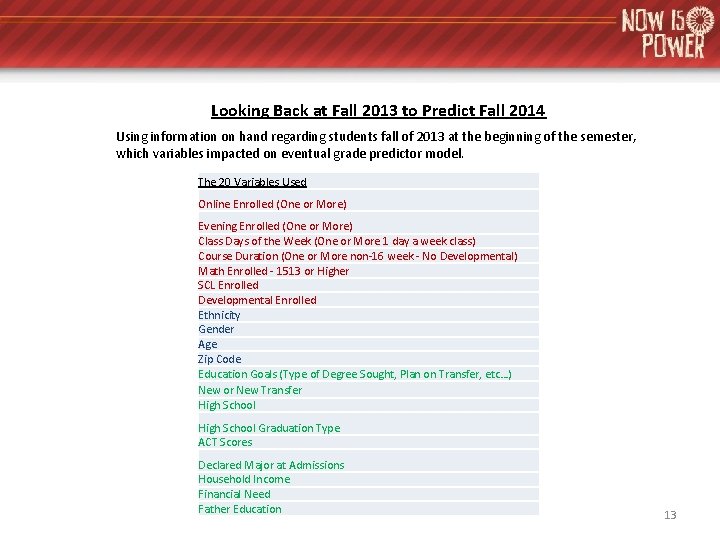
Looking Back at Fall 2013 to Predict Fall 2014 Using information on hand regarding students fall of 2013 at the beginning of the semester, which variables impacted on eventual grade predictor model. The 20 Variables Used Online Enrolled (One or More) Evening Enrolled (One or More) Class Days of the Week (One or More 1 day a week class) Course Duration (One or More non-16 week - No Developmental) Math Enrolled - 1513 or Higher SCL Enrolled Developmental Enrolled Ethnicity Gender Age Zip Code Education Goals (Type of Degree Sought, Plan on Transfer, etc…) New or New Transfer High School Graduation Type ACT Scores Declared Major at Admissions Household Income Financial Need Father Education 13
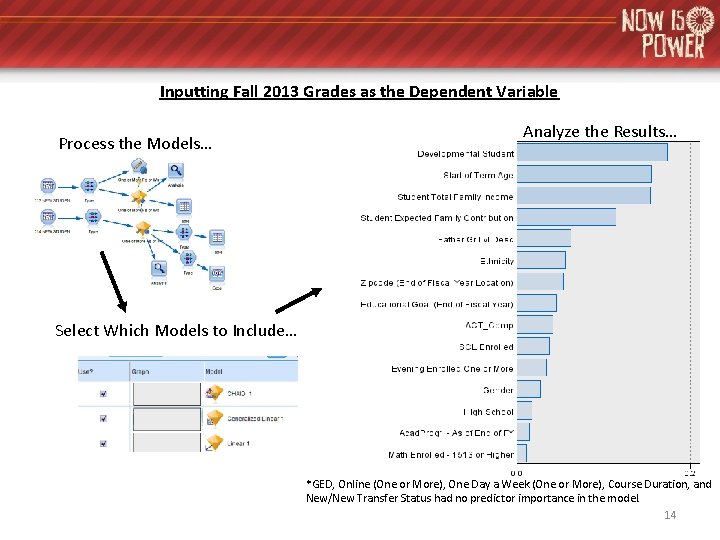
Inputting Fall 2013 Grades as the Dependent Variable Process the Models… Analyze the Results… Select Which Models to Include… *GED, Online (One or More), One Day a Week (One or More), Course Duration, and New/New Transfer Status had no predictor importance in the model. 14
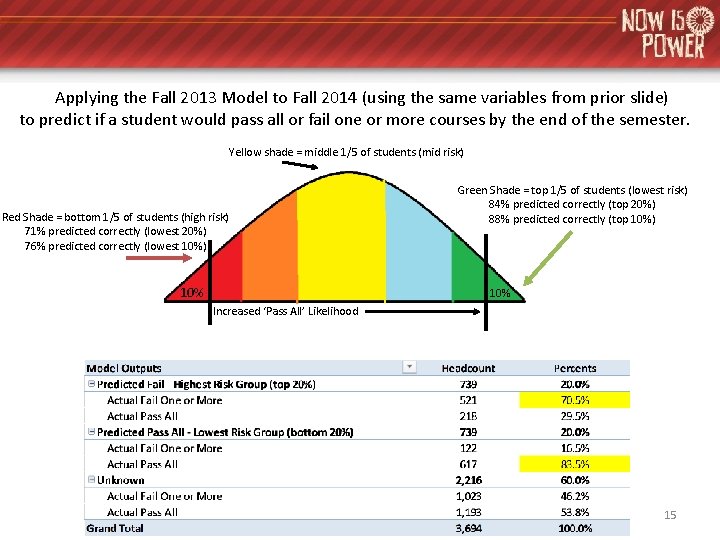
Applying the Fall 2013 Model to Fall 2014 (using the same variables from prior slide) to predict if a student would pass all or fail one or more courses by the end of the semester. Yellow shade = middle 1/5 of students (mid risk) Red Shade = bottom 1/5 of students (high risk) 71% predicted correctly (lowest 20%) 76% predicted correctly (lowest 10%) 10% Green Shade = top 1/5 of students (lowest risk) 84% predicted correctly (top 20%) 88% predicted correctly (top 10%) 10% Increased ‘Pass All’ Likelihood 15
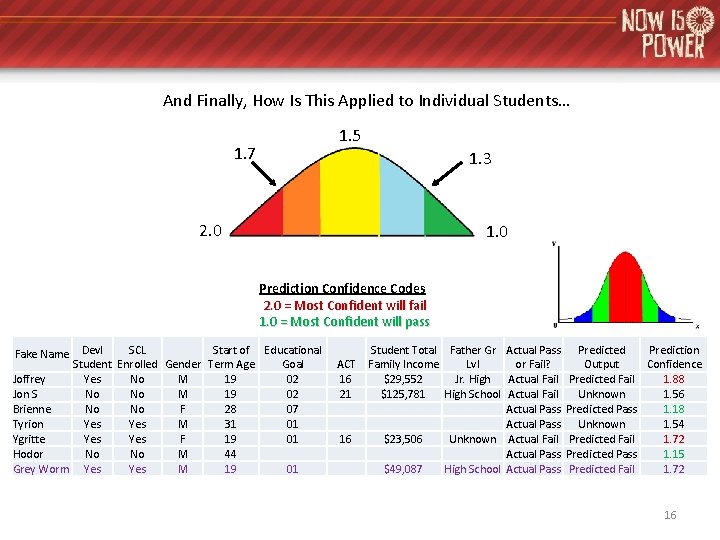
And Finally, How Is This Applied to Individual Students… 1. 5 1. 7 1. 3 2. 0 1. 0 Prediction Confidence Codes 2. 0 = Most Confident will fail 1. 0 = Most Confident will pass Devl SCL Start of Educational Student Enrolled Gender Term Age Goal Joffrey Yes No M 19 02 Jon S No No M 19 02 Brienne No No F 28 07 Tyrion Yes M 31 01 Ygritte Yes F 19 01 Hodor No No M 44 Grey Worm Yes M 19 01 Fake Name ACT 16 21 16 Student Total Father Gr Actual Pass Family Income Lvl or Fail? $29, 552 Jr. High Actual Fail $125, 781 High School Actual Fail Actual Pass $23, 506 Unknown Actual Fail Actual Pass $49, 087 High School Actual Pass Predicted Prediction Output Confidence Predicted Fail 1. 88 Unknown 1. 56 Predicted Pass 1. 18 Unknown 1. 54 Predicted Fail 1. 72 Predicted Pass 1. 15 Predicted Fail 1. 72 16
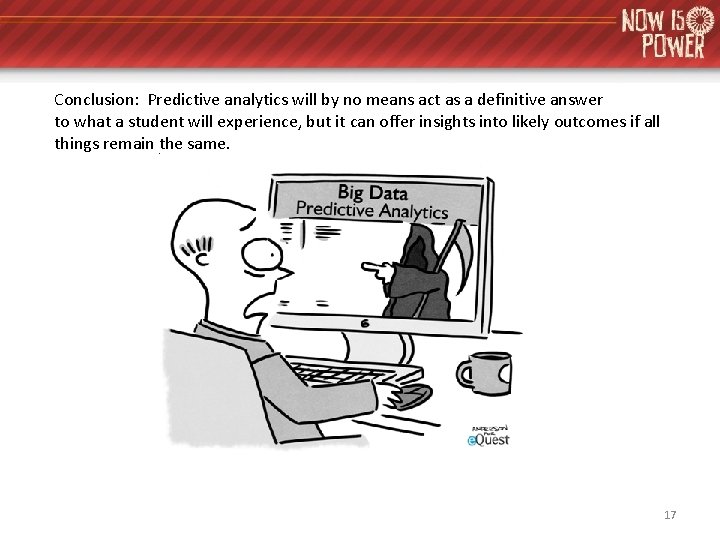
Conclusion: Predictive analytics will by no means act as a definitive answer to what a student will experience, but it can offer insights into likely outcomes if all things remain the same. 17