Precipitation on the South American Altiplano Investigation of

- Slides: 46
Precipitation on the South American Altiplano Investigation of relations between large-scale and local-scale flow, Part of the Climandes Project Authors: Ariane Maurer (1), Katrin Sedlmeier (2), Michael Sprenger (1), Cornelia Schwierz (2), Daniela Domeisen (1) Swiss Federal Institute of Technology ETH, Zürich, Switzerland (2) Federal Office of Meteorology and Climatology Meteo. Swiss, Zürich, Switzerland Introduction
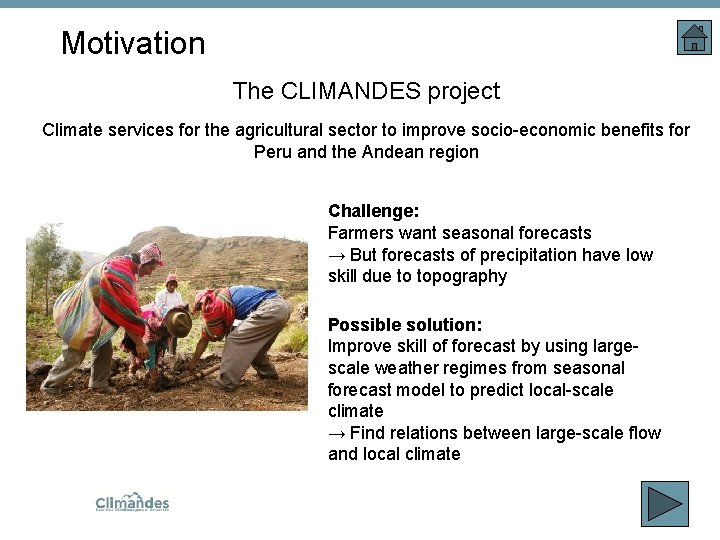
Motivation The CLIMANDES project Climate services for the agricultural sector to improve socio-economic benefits for Peru and the Andean region Challenge: Farmers want seasonal forecasts → But forecasts of precipitation have low skill due to topography Possible solution: Improve skill of forecast by using largescale weather regimes from seasonal forecast model to predict local-scale climate → Find relations between large-scale flow and local climate.
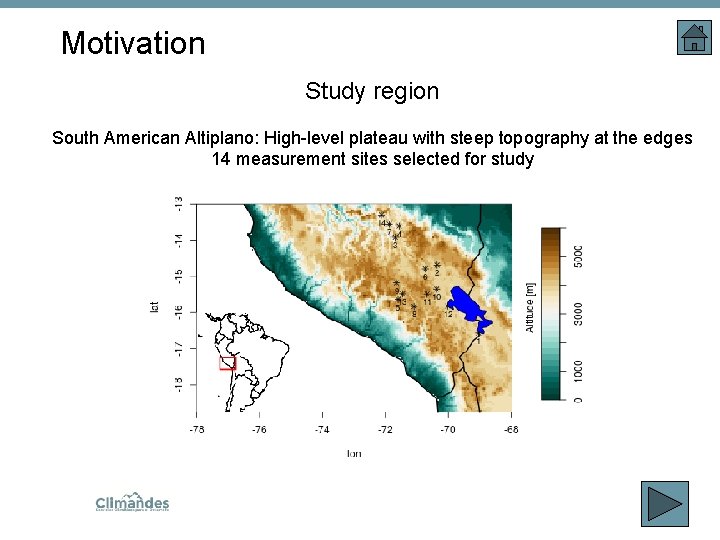
Motivation Study region South American Altiplano: High-level plateau with steep topography at the edges 14 measurement sites selected for study .
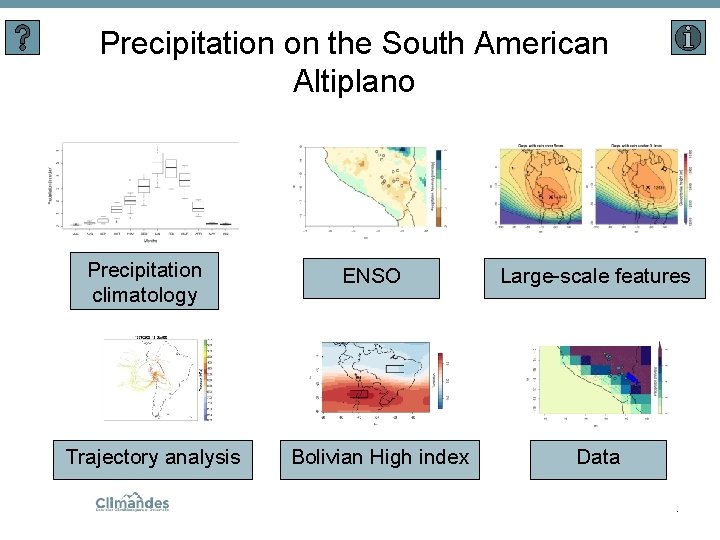
Precipitation on the South American Altiplano Precipitation climatology Trajectory analysis ENSO Bolivian High index Large-scale features Data.
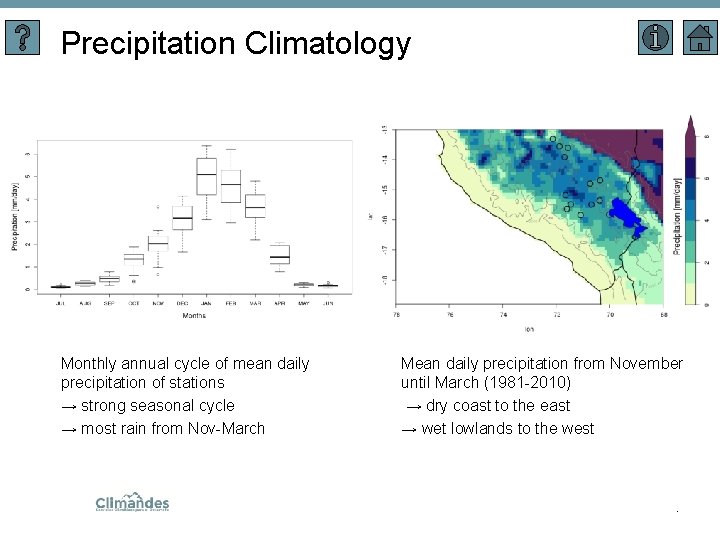
Precipitation Climatology Monthly annual cycle of mean daily precipitation of stations → strong seasonal cycle → most rain from Nov-March Mean daily precipitation from November until March (1981 -2010) → dry coast to the east → wet lowlands to the west .
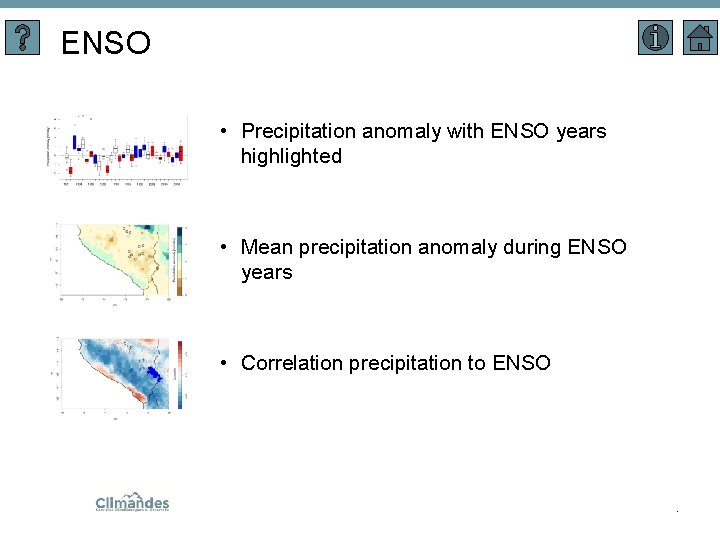
ENSO • Precipitation anomaly with ENSO years highlighted • Mean precipitation anomaly during ENSO years • Correlation precipitation to ENSO .
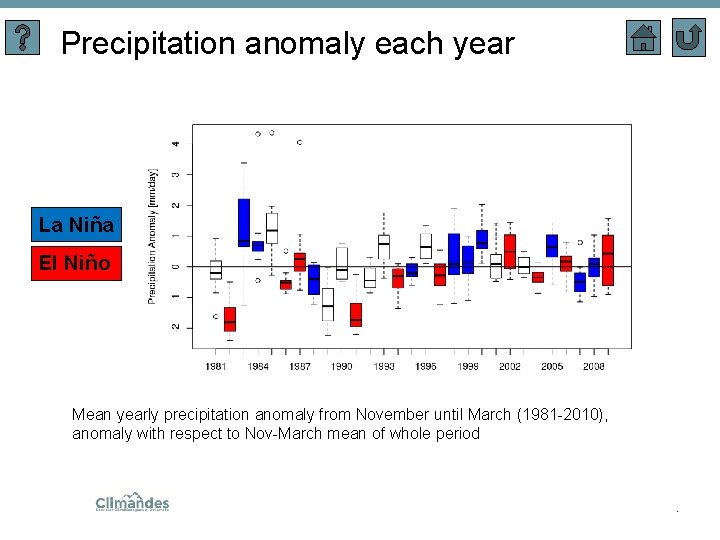
Precipitation anomaly each year La Niña El Niño Mean yearly precipitation anomaly from November until March (1981 -2010), anomaly with respect to Nov-March mean of whole period .
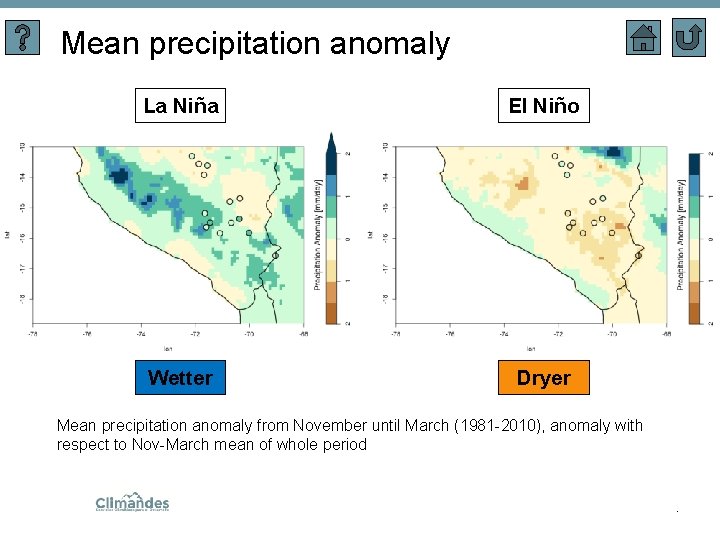
Mean precipitation anomaly La Niña El Niño Wetter Dryer Mean precipitation anomaly from November until March (1981 -2010), anomaly with respect to Nov-March mean of whole period .
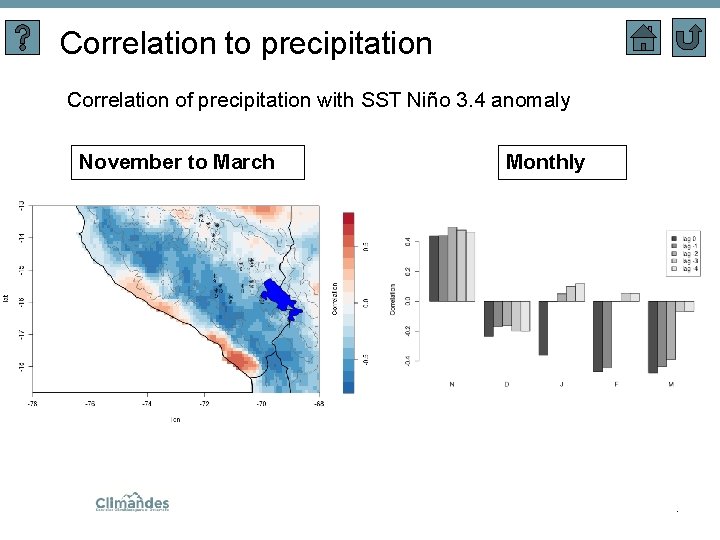
Correlation to precipitation Correlation of precipitation with SST Niño 3. 4 anomaly November to March Monthly .
Large-scale features • Features climatology (anticyclones, jet stream, low-level jet, bolivian high) (For the dynamic flow features, the global climatologies based on ERAInterim developed by Sprenger et al. (2017) were used) Comparison of large scale features for rainy days and dry days: • Case Study (3 dry days followed by 3 rain days) • Climatological patterns and anomalies.
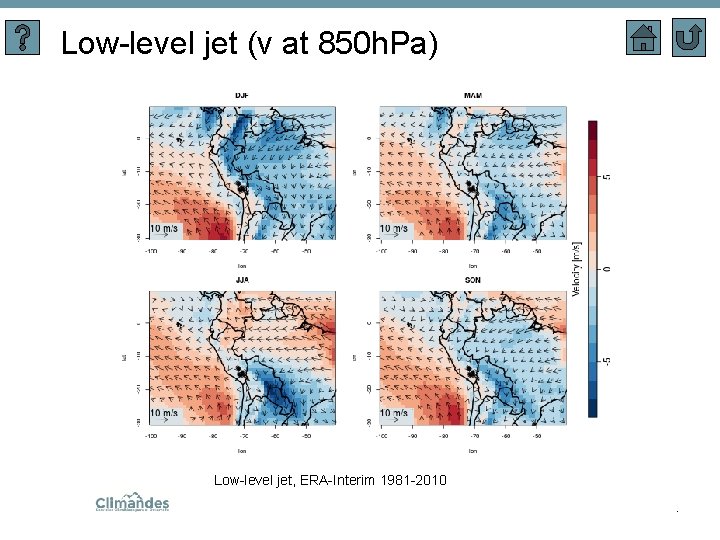
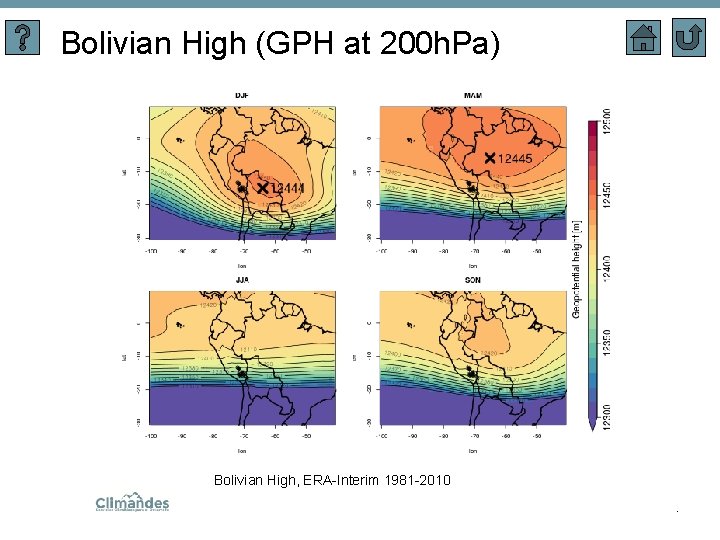
Features climatology • Anticyclone frequency on SLP-level • Upper-level jet frequency • Low-level jet (meridional velocity at 850 h. Pa ) • Bolivian high (geopotential height at 200 h. Pa) .
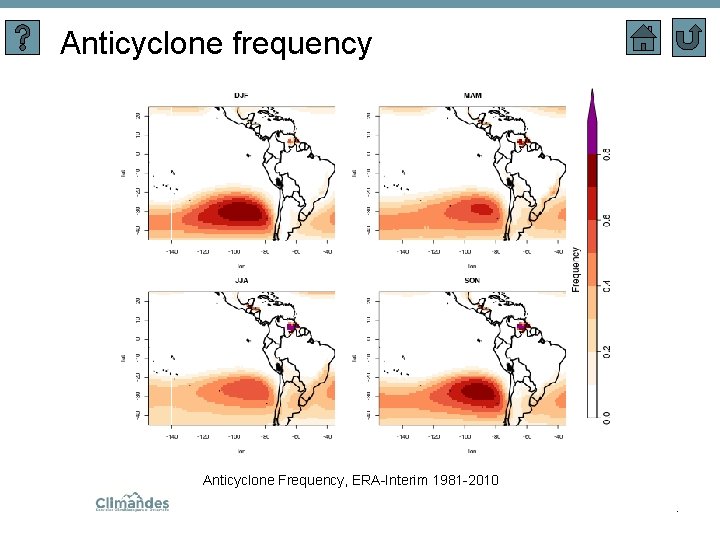
Anticyclone frequency Anticyclone Frequency, ERA-Interim 1981 -2010.
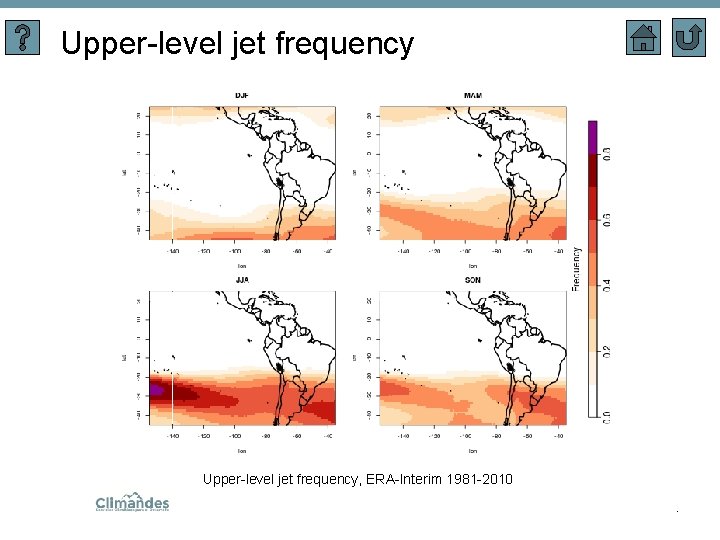
Upper-level jet frequency, ERA-Interim 1981 -2010.
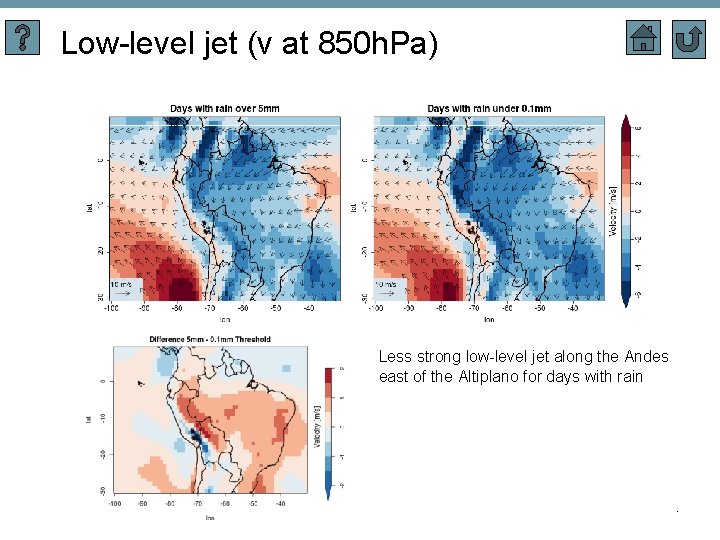
Low-level jet (v at 850 h. Pa) Low-level jet, ERA-Interim 1981 -2010.
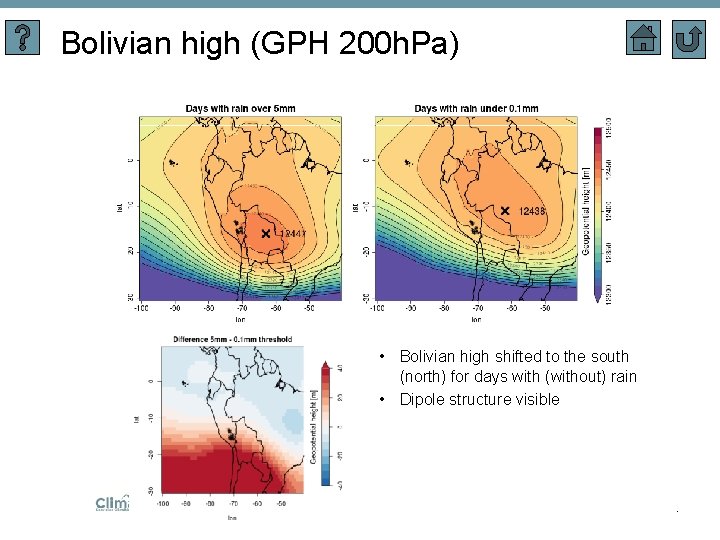
Bolivian High (GPH at 200 h. Pa) Bolivian High, ERA-Interim 1981 -2010.
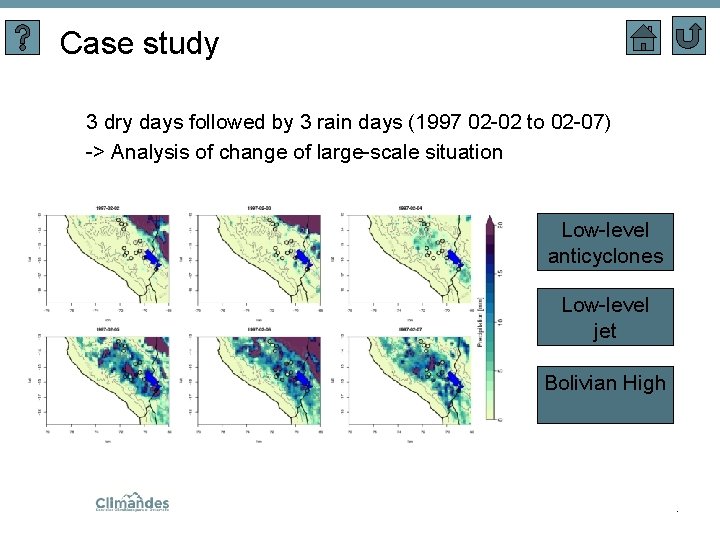
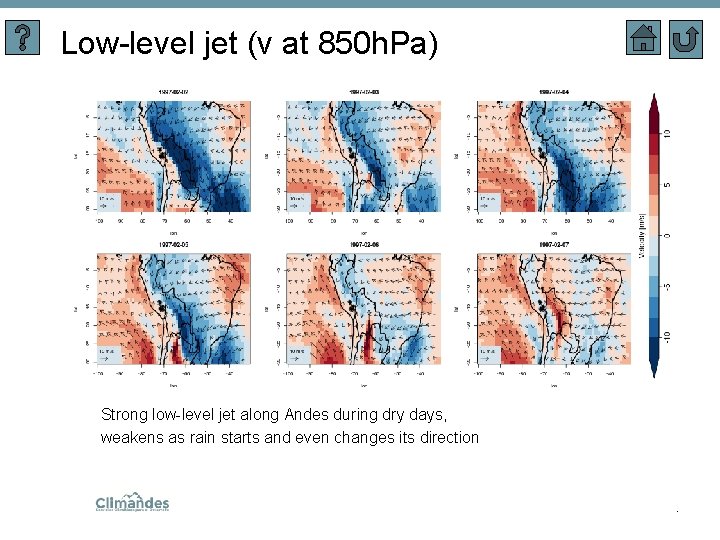
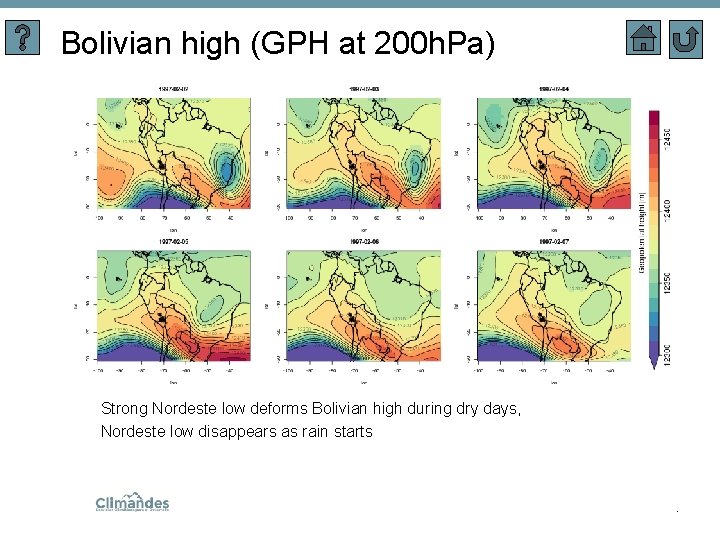
Case study 3 dry days followed by 3 rain days (1997 02 -02 to 02 -07) -> Analysis of change of large-scale situation Low-level anticyclones Low-level jet Bolivian High .
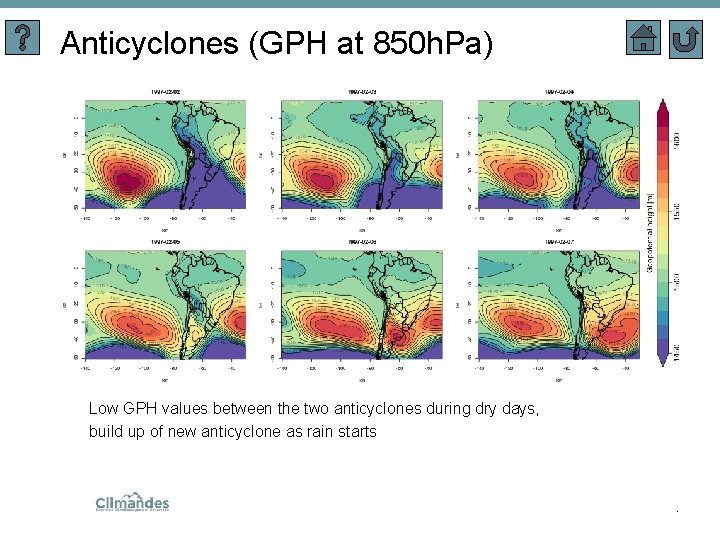
Anticyclones (GPH at 850 h. Pa) Low GPH values between the two anticyclones during dry days, build up of new anticyclone as rain starts .
Low-level jet (v at 850 h. Pa) Strong low-level jet along Andes during dry days, weakens as rain starts and even changes its direction .
Bolivian high (GPH at 200 h. Pa) Strong Nordeste low deforms Bolivian high during dry days, Nordeste low disappears as rain starts .
Climatological patterns & anomalies • Influence of large-scale phenomena on precipitation → Difference of large-scale features between days with rain over 5 mm and under 0. 1 mm (dry days) Low-level anticyclones Low-level jet Bolivian High .
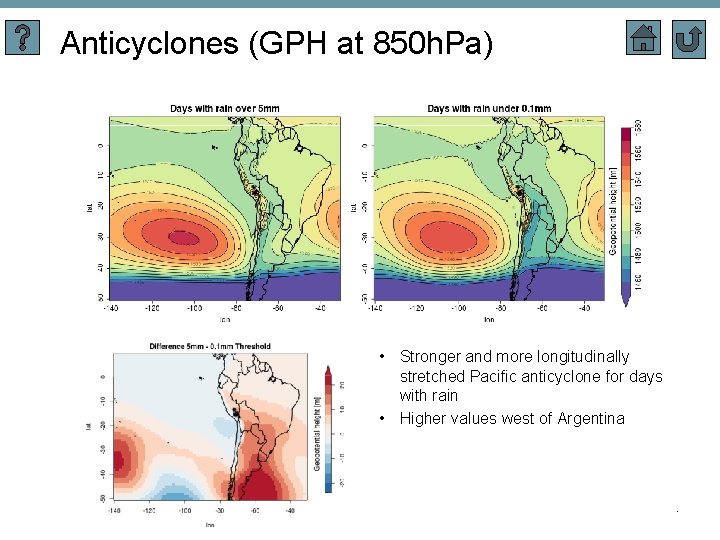
Anticyclones (GPH at 850 h. Pa) • Stronger and more longitudinally stretched Pacific anticyclone for days with rain • Higher values west of Argentina .
Low-level jet (v at 850 h. Pa) Less strong low-level jet along the Andes east of the Altiplano for days with rain .
Bolivian high (GPH 200 h. Pa) • Bolivian high shifted to the south (north) for days with (without) rain • Dipole structure visible .
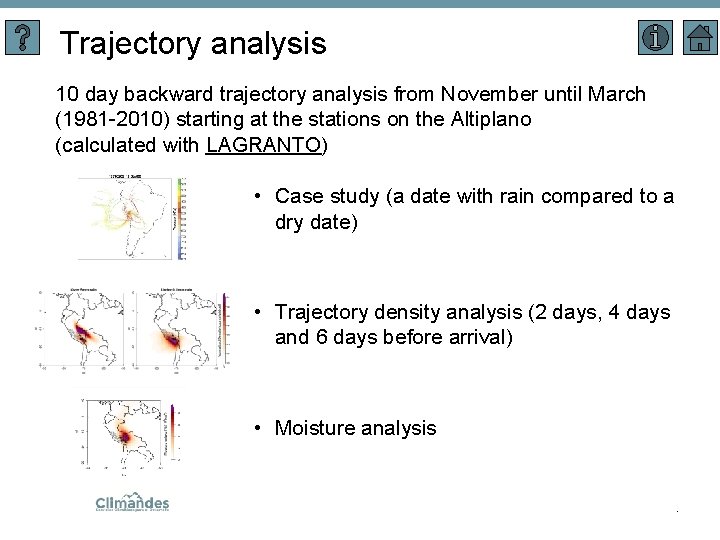
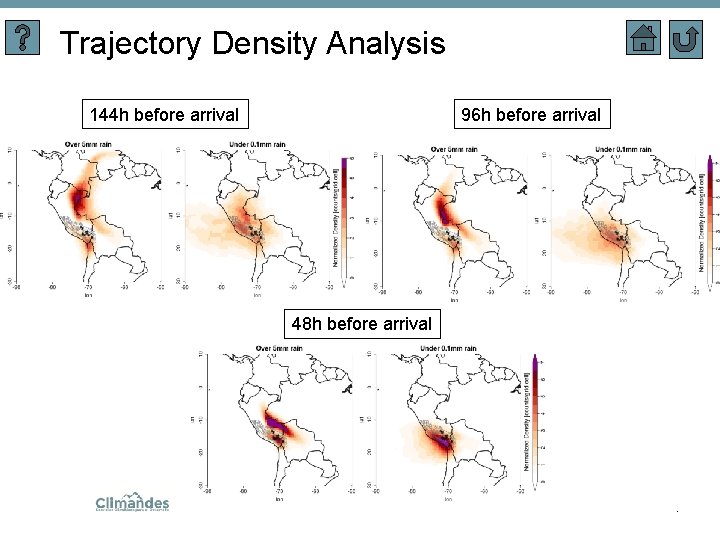
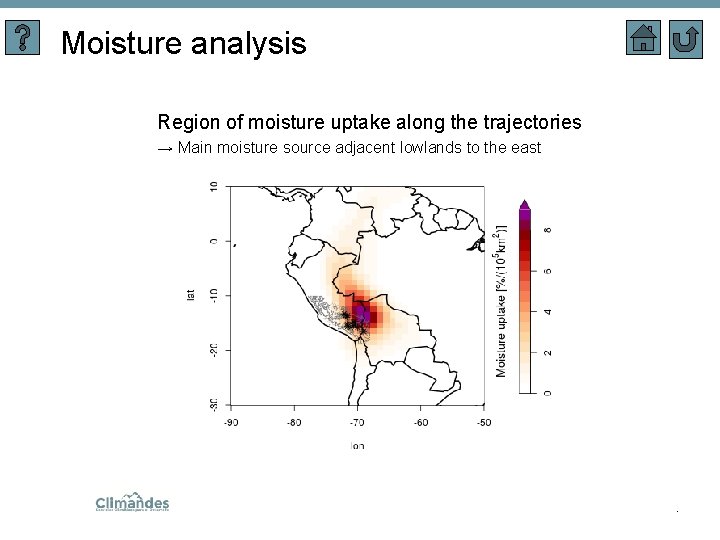
Trajectory analysis 10 day backward trajectory analysis from November until March (1981 -2010) starting at the stations on the Altiplano (calculated with LAGRANTO) • Case study (a date with rain compared to a dry date) • Trajectory density analysis (2 days, 4 days and 6 days before arrival) • Moisture analysis .
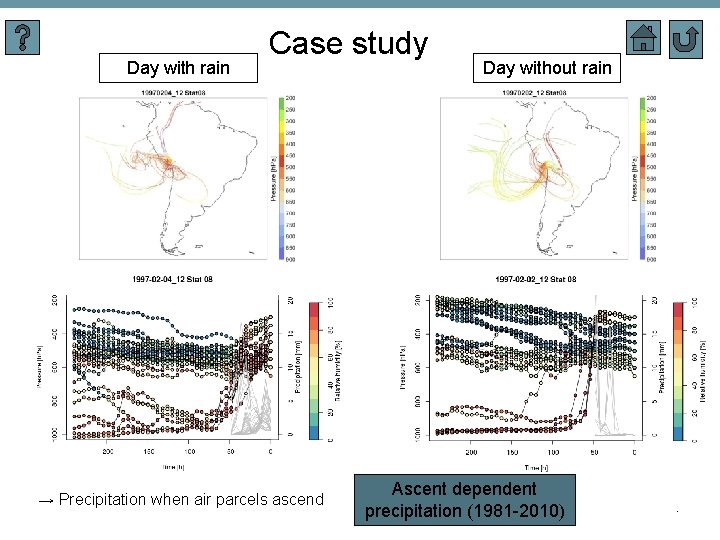
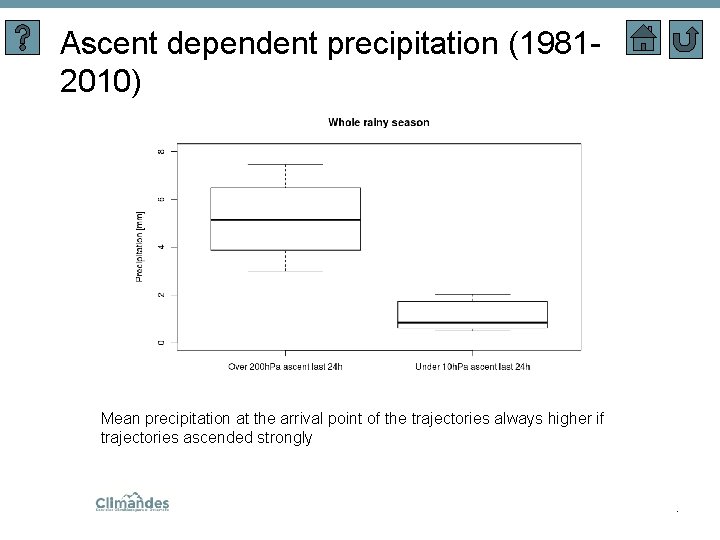
Day with rain Case study → Precipitation when air parcels ascend Day without rain Ascent dependent precipitation (1981 -2010) .
Ascent dependent precipitation (19812010) Mean precipitation at the arrival point of the trajectories always higher if trajectories ascended strongly .
Trajectory Density Analysis 144 h before arrival 96 h before arrival 48 h before arrival .
Moisture analysis Region of moisture uptake along the trajectories → Main moisture source adjacent lowlands to the east .
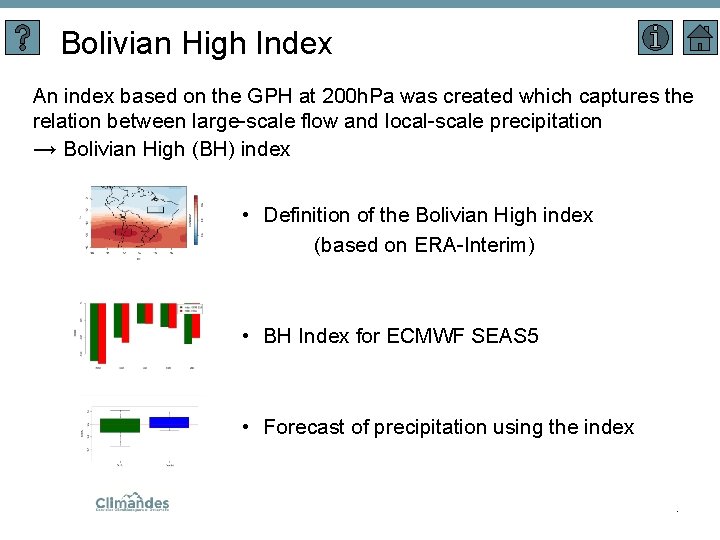
Bolivian High Index An index based on the GPH at 200 h. Pa was created which captures the relation between large-scale flow and local-scale precipitation → Bolivian High (BH) index • Definition of the Bolivian High index (based on ERA-Interim) • BH Index for ECMWF SEAS 5 • Forecast of precipitation using the index .
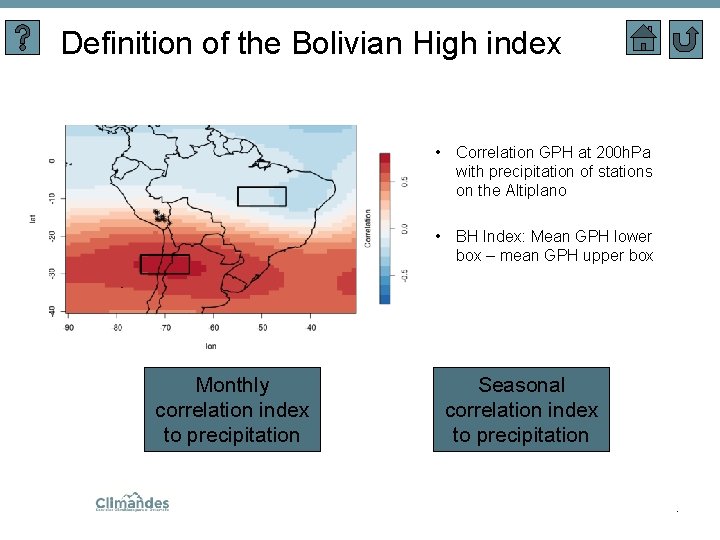
Definition of the Bolivian High index • Correlation GPH at 200 h. Pa with precipitation of stations on the Altiplano • BH Index: Mean GPH lower box – mean GPH upper box Monthly correlation index to precipitation Seasonal correlation index to precipitation .
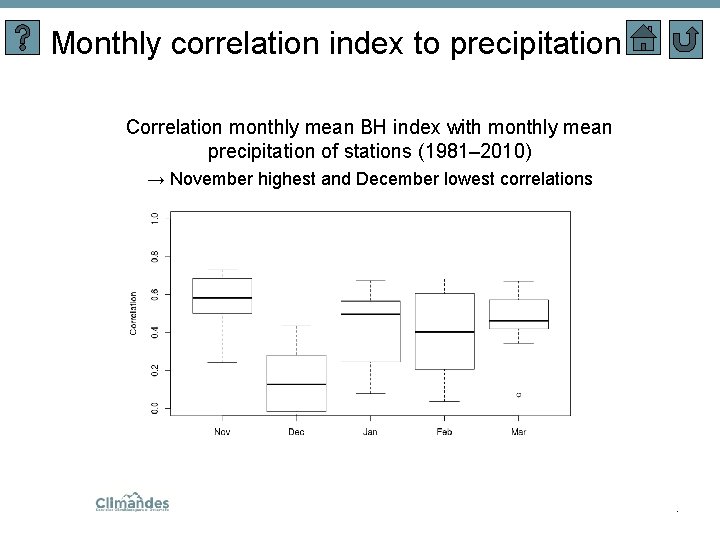
Monthly correlation index to precipitation Correlation monthly mean BH index with monthly mean precipitation of stations (1981– 2010) → November highest and December lowest correlations .
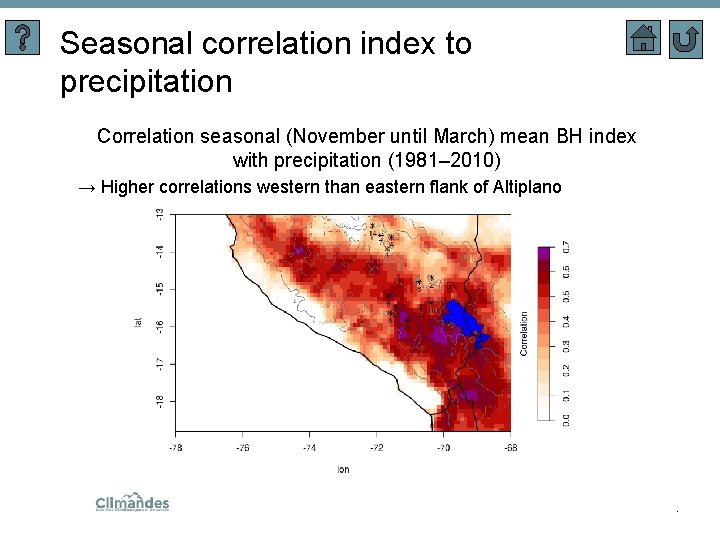
Seasonal correlation index to precipitation Correlation seasonal (November until March) mean BH index with precipitation (1981– 2010) → Higher correlations western than eastern flank of Altiplano .
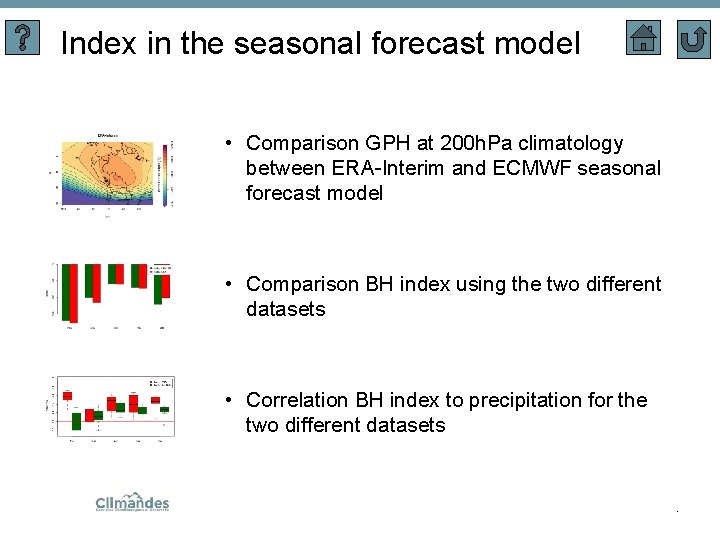
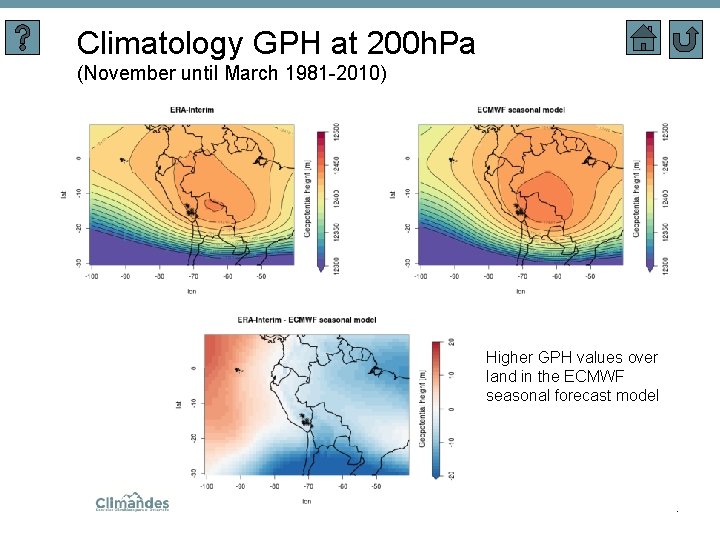
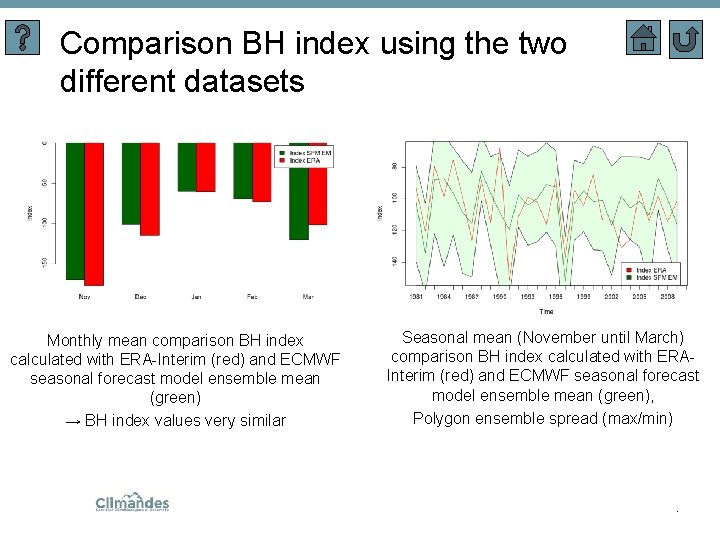
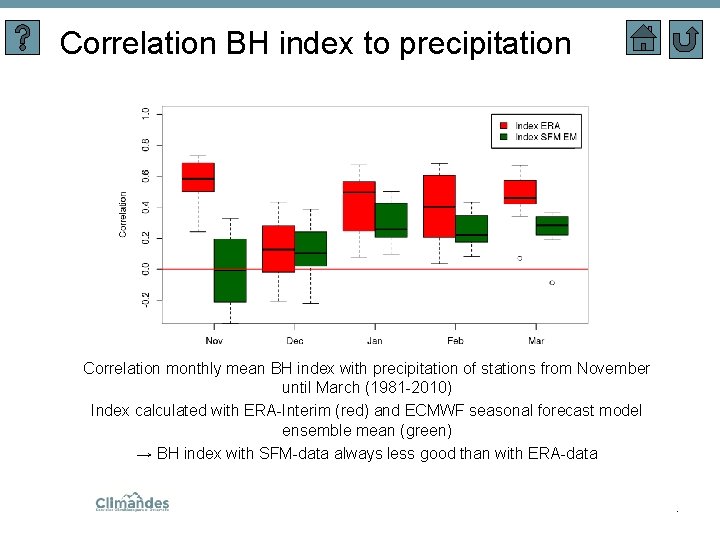
Index in the seasonal forecast model • Comparison GPH at 200 h. Pa climatology between ERA-Interim and ECMWF seasonal forecast model • Comparison BH index using the two different datasets • Correlation BH index to precipitation for the two different datasets .
Climatology GPH at 200 h. Pa (November until March 1981 -2010) Higher GPH values over land in the ECMWF seasonal forecast model .
Comparison BH index using the two different datasets Monthly mean comparison BH index calculated with ERA-Interim (red) and ECMWF seasonal forecast model ensemble mean (green) → BH index values very similar Seasonal mean (November until March) comparison BH index calculated with ERAInterim (red) and ECMWF seasonal forecast model ensemble mean (green), Polygon ensemble spread (max/min) .
Correlation BH index to precipitation Correlation monthly mean BH index with precipitation of stations from November until March (1981 -2010) Index calculated with ERA-Interim (red) and ECMWF seasonal forecast model ensemble mean (green) → BH index with SFM-data always less good than with ERA-data .
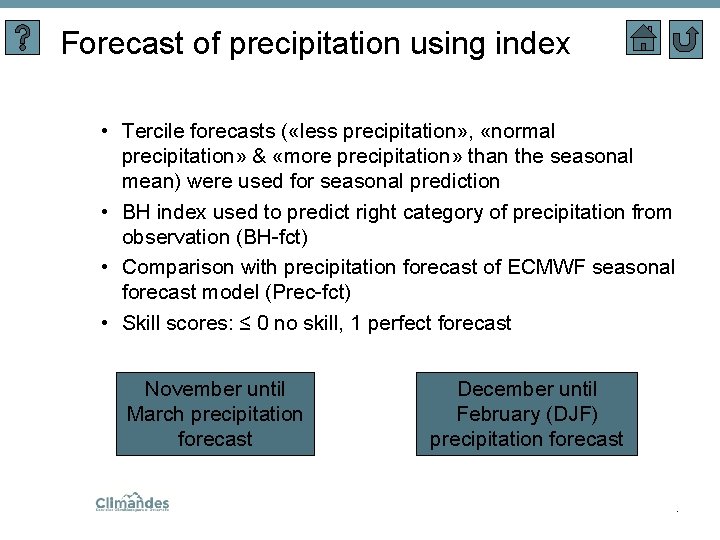
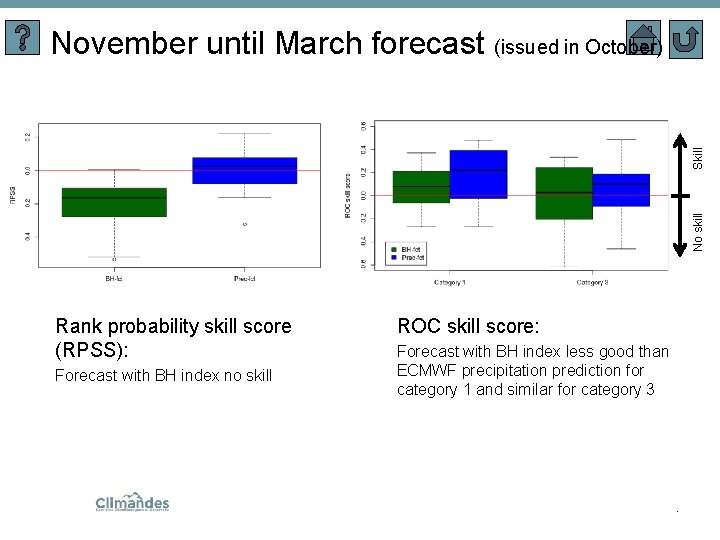
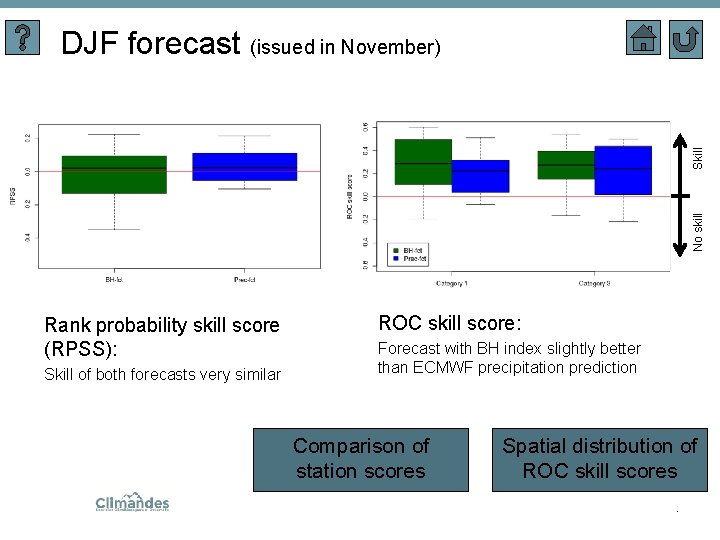
Forecast of precipitation using index • Tercile forecasts ( «less precipitation» , «normal precipitation» & «more precipitation» than the seasonal mean) were used for seasonal prediction • BH index used to predict right category of precipitation from observation (BH-fct) • Comparison with precipitation forecast of ECMWF seasonal forecast model (Prec-fct) • Skill scores: ≤ 0 no skill, 1 perfect forecast November until March precipitation forecast December until February (DJF) precipitation forecast .
No skill Skill November until March forecast (issued in October) Rank probability skill score (RPSS): Forecast with BH index no skill ROC skill score: Forecast with BH index less good than ECMWF precipitation prediction for category 1 and similar for category 3 .
No skill Skill DJF forecast (issued in November) Rank probability skill score (RPSS): Skill of both forecasts very similar ROC skill score: Forecast with BH index slightly better than ECMWF precipitation prediction Comparison of station scores Spatial distribution of ROC skill scores.
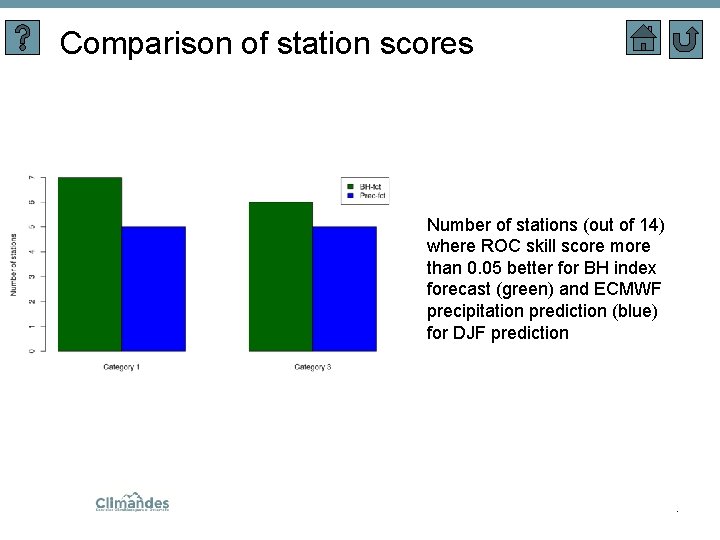
Comparison of station scores Number of stations (out of 14) where ROC skill score more than 0. 05 better for BH index forecast (green) and ECMWF precipitation prediction (blue) for DJF prediction .
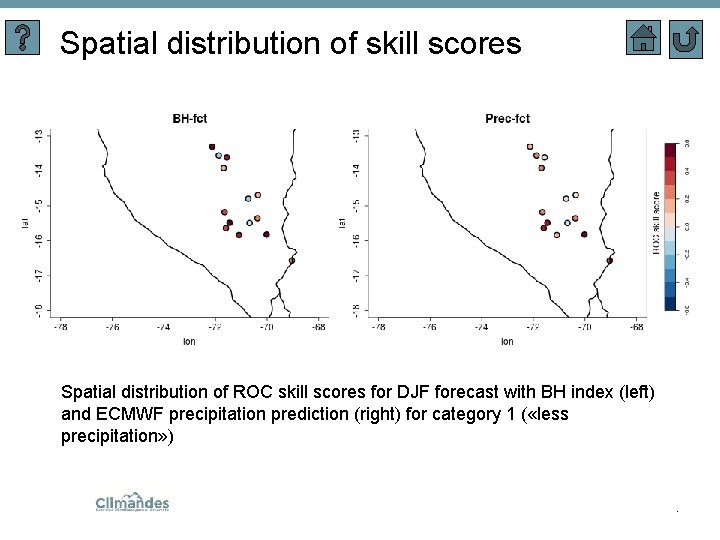
Spatial distribution of skill scores Spatial distribution of ROC skill scores for DJF forecast with BH index (left) and ECMWF precipitation prediction (right) for category 1 ( «less precipitation» ) .
Data • SENAMHI (Servicio Nacional de Meteorologica e Hidrologia del Peru) station data (14 stations, homogenized) • PISCO: Gridded precipitation dataset composed of station and satellite data covering Peru • Modelling data - ERA-Interim (dynamic flow features based on global climatologies from Sprenger et al. (2017)) - ECMWF seasonal forecast model fifth generation (hindscasts) Precipitation ERA-Interim vs Station data • Period: November to March from 1981 - 2010 .
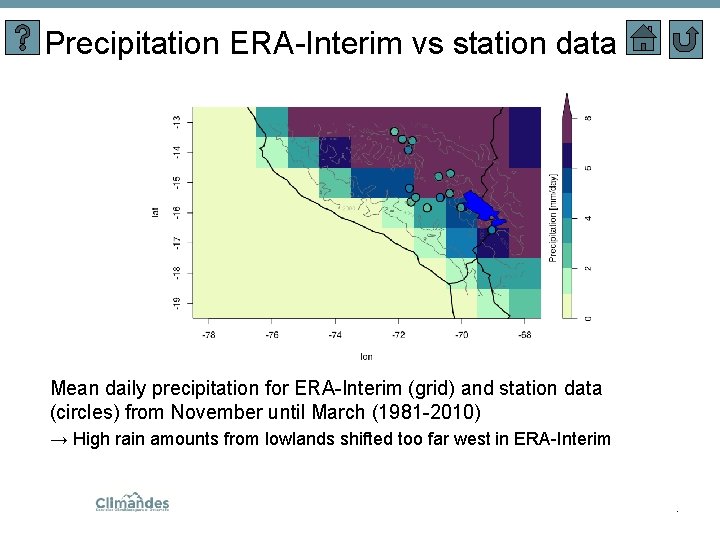
Precipitation ERA-Interim vs station data Mean daily precipitation for ERA-Interim (grid) and station data (circles) from November until March (1981 -2010) → High rain amounts from lowlands shifted too far west in ERA-Interim .
Navigation help Leads to this slide Box / Picture with glow Leads to another slide Starting slide Motivation slide Back to last slide/up one level .
References • Sprenger et al. : Sprenger, M. , Fragkoulidis, G. , Binder, H. , Croci-Maspoli, M. , Graf, P. , Grams, C. M. , Knippertz, P. , Madonna, E. , Schemm, S. , Skerlak, B. , and et al. (2017). Global Climatologies of Eulerian and Lagrangian Flow Features based on ERA-Interim. Bulletin of the American Meteorological Society, 98(8): 1739 -1748. Doi: 10. 1175/bams-d-15 -00299. 1 • LAGRANTO: Sprenger, M. and Wernli, H. (2015). The LAGRANTO Lagrangian analysis tool – version 2. 0. Geoscientific Model Development, 8(8): 2569 -2586. Doi: 10. 5194/gmd-8 -2569 -2015 • PISCO: Aybar, C. , Lavado-Casimiro, W. , Huerta, A. , Fernandez, C. , Vega, F. , Sabino, E. , and Felipe-Obando, O. (2017). Uso del Producto Grillado „PISCO“ de precipitacion en Estudios, Investigaciones y Sistemas Operacionales de Monitoreo y Pronostico Hidrometeorologico. Nota Técnica 001 SENAMHI-DHI 2017, Lima-Peru .