MODERN METHODS IN TECHNIQUES OF ANALYTICAL CHEMISTRY SPECTROSCOPIC


 Describe the absorption of radiation by molecules and its relationship to molecular")


 Rotational transition -")
 Color absorption Color Observed 380 -420")


 - Absorptivity (a) cm-1 g-1 L Pathlength")

 in 100")


 Sources")


")


 Light Source (2) Monochromator (3) Sample/reference holder (4) Radiation")


 max Type of")
 Water 205 THF CH 3 C N")


 high X-RAY Energy INFRARED MICROWAVE ULTRAVIOLET Vibrational infrared Visible")


 § No two molecules of different structure will have exactly the")
 The Infrared Spectrum A plot of absorption intensity (% Transmittance) on")
 Principal Frequency Bands (from left to right in spectrum) O H")
 Suggested approach for analyzing IR Spectra Step 1. – Check for")
 Step 2. - If the Carbonyl Group is Absent Check for")
 Step 3. – Refine the Structure Possibilities by Looking for Double")
 Step 3 (Con’t) Aromatic Ring Absorptions § Aromatic unsaturated C=C bonds")
 Step 3 (Con’t) Aromatic Ring Absorptions (Con’t) § The unsaturated =C-H")
 Step 4. If none of the above apply then the compound")


.")


- Slides: 89
MODERN METHODS IN TECHNIQUES OF ANALYTICAL CHEMISTRY: SPECTROSCOPIC TECHNIQUES.
QR –Code 3 December 2018
Spectroscopic techniques Widely used to: • detect molecules • measure the concentration and • to determine molecular structure.
Spectroscopy : Spectroscopy is used in physical and analytical chemistry because atoms and molecules have unique spectra. So, spectroscopy use to detect, identify and quantify information. How spectroscopy used to identify elements? each natural element has a characteristic light spectrum that help identify it is samples of unknown substances.
What is the difference between spectrometry and spectroscopy? The term spectroscopy is normally reserved for measurements of the electromagnetic spectrum. Words ending in -scopy mean "looking at" whereas words in -metry mean "measurement of". In practice, the two are used interchangeably, with the exception of mass spectrometry where the term "mass spectroscopy" is discouraged
Scope: 1) Describe the absorption of radiation by molecules and its relationship to molecular structure. 2)Make quantitative calculations, relating the amount of radiation absorbed to the concentration of an absorbing analyte. 3)Describe the instrumentation required for making measurements.
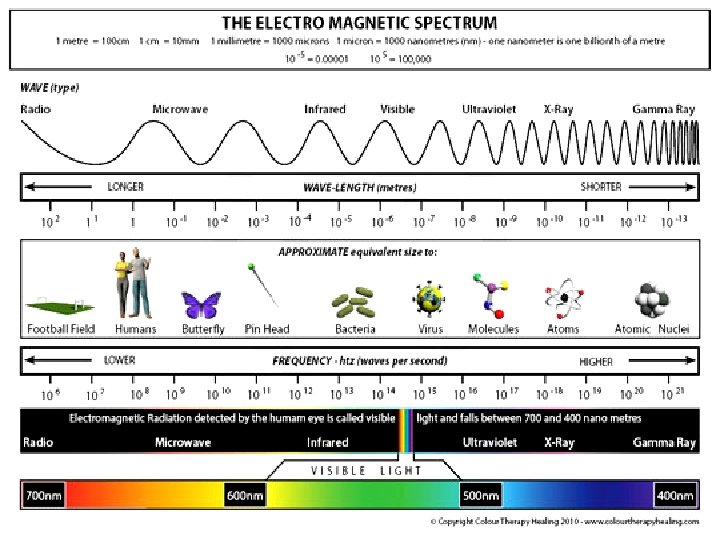
The Electromagnetic Radiation • Light is a form of electromagnetic radiation. Electromagnetic radiation can be considered as a form of radiant energy that is propagated as a transverse wave. It vibrates perpendicular to the direction of propagation, imparts a wave motion to the radiation
Wavelength , λ is the distance between the neighboring peaks of two wave. Frequency, v (nu) the number of cycles passing a fixed point per unit time. Frequency is measure in Hertz, 1 Hz= 1 s-1. Wavelength, λ = c/ v Where c = velocity of light (3 x 1010 cm/s) Wavenumber, ṽ (nu tilde) the number of complete wavelengths in a given length. Wavenumber, ṽ = v/c =1/λ e. g. : A wave number of 5 cm-1 indicates there are 5 complete wavelength in 1 cm.
Electromagnetic radiation possesses certain amount of energy E = hν = hc/λ E = energy of a photon h = Planck’s Constant (6. 62 x 10 -34 joule second (J-s)) It is apparent that the shorter the wavelength or the greater frequency, the greater energy. In spectrometric methods, the sample solution absorbs electromagnetic radiation from appropriate source, and the amount absorbed is related to the concentration of analyte in the solution.
11 109 107 105 103 101 10 -3 10 -5 10 -7 10 -9 10 - Electromagnetic Spectrum gamma X-rays 500 Ultra Violet 600 Infra red microwave Radio waves 700 Violet, indigo, blue Green, yellow Orange, red Color Wave length (nm) violet 400 -435 indigo 435 -480 blue 480 -500 green 500 -560 yellow 560 -595 orange 595 -610 red 610 -750
How does matter absorb radiation? There are 3 basic process: 1) Rotational transition - molecules rotate, absorb radiation and raised to higher rotational energy level 2) Vibrational transition - Atoms or group of atoms within molecule vibrate relative to each other, absorb radiation and raised to higher vibrational energy level. 3) Electronic transition - Electrons of molecule raised to higher electron energy.
Wavelenghts and Color Wavelength of Maximum absorption (nm) Color absorption Color Observed 380 -420 Violet Green-yellow 420 -440 Violet-blue Yellow 440 -470 Blue Orange 470 -500 Blue-green Red 500 -520 Green Purple 520 -550 Yellow-green Violet 550 -580 Yellow Violet-blue 580 -620 Orange Blue 620 -680 Red Blue-green 680 -780 Purple Green
Derivation of Beer’s Law Schematic of a simple spectrometer. Irradiance Out, P Irradiance In, P 0 Pathlenght Readout Irradiance or radiant power, P (Wm-2), is the energy per second per unit area of the beam of light.
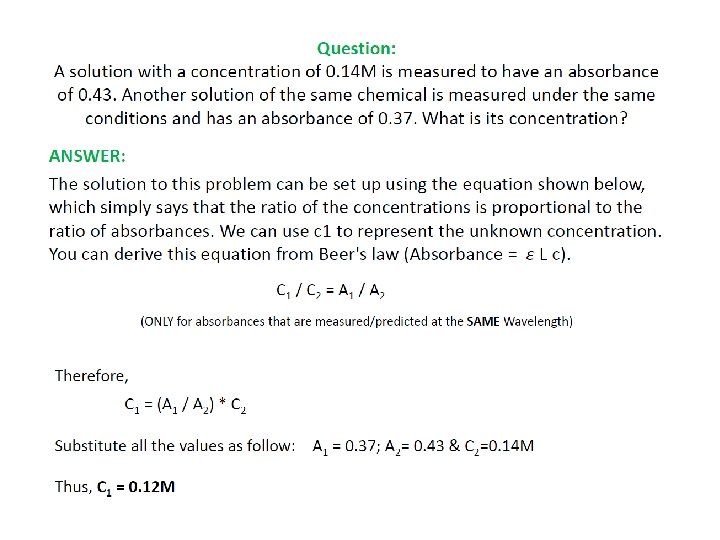
Transmittance, T, is the fraction of original light not absorbed by the sample. Transmittance is T=Po/P =10 -kb Po = power of incident light P= power of transmitted light Putting transmittance in logarithmic form: log T = log P/Po = -kb Similar law holds for the dependence of T on concentration, c T=Po/P =10 -k’c and log T = log P/Po = -k’c Combining these two laws, T = P/P 0 =10 -abc (Beer’s Law)
Continue…. . log T = log P/P 0 = -abc A = -log T = log 1/T = log P 0/P = abc = log 100 – log %T Where A = absorbance, a = analyte’s absoptivity b = pathlenght through the material; c= concentration, OR A = εbc Where ε is the analyte’s molar absorptivity. ε = a x molecular weight
Spectroscopy Nomenclature Recommended Name Unit Absorbance (A) - Absorptivity (a) cm-1 g-1 L Pathlength (b) cm Transmittance (T) - Wavelength (λ) nm Concentration (c) moles per liter (moles L-1)
Example 1: A sample in a 1. 0 -cm cell is determine with a spectrometer to transmit 80% light at certain wavelength. If the absorptivity of this substance at this wavelength is 2. 0, What is the concentration of the substance? Solution: The percent of the transmittance is 80%, and so T = 0. 80. log 1/T =abc log 1/0. 80 = 2. 0 cm-1 g-1 L x 1. 0 cm x c log 1. 25 = 2. 0 g-1 L x c c = 0. 10/2. 0 = 0. 050 g. L-1
Example 2: A solution containing 1. 00 mg ion (as thiocyanate complex) in 100 m. L was observed to transmit 70. 0% of the incident light compared to an appropriate blank. (a)What is the absorbance of the solution at this wavelength? (b) What fraction of light would be transmitted by a solution of iron four times as concentrated. Solution: (a)T = 0. 700 A = log 1/0. 700 = log 1. 43 = 0. 155 (b) 0. 155 = ab (0. 0100 g/L) ab = 15. 5 L/g From A= abc A = 15. 5 L/g x (4 x 0. 1000 g/L) = 0. 620 log 1/T = 0. 620 T = 0. 240
The absorbance of the new solution could have been calculated more directly:
Beer’s Law Assumption/Limitation • The light being shined on the sample must be monochromatic (one color or wavelenght) • The analyte must not be participate in a concentration dependent equilibrium § This isn’t good technique for many weak acid systems, as dilution increases dissociation and HA and A- probably don’t have the same absorbance.
Beer’s Law Assumption/Limitation Problems: Calibration curves are found to be nonlinear because occuring of deviation. Deviation from linearity are divided into three categories: 1)Fundamental : Law is valid for low concentration analyte. At higher concentration, there will be interaction between particle of analyte that may change the value of ε. 2) Chemical: when the absorbing species is involved in an equilibrium reaction. HA ↔ H+ + AHA will absorbs the wavelength and contribute to ε and C value. However, if the equilibrium shifts to right, less HA available for absorption and will result in non linearity of the curve. 3) Instrumentation: 2 principal limitation: i) Stricly valid for purely monochromatic instrumentation. ii) The effect of ‘leakage’ light from imperfections within wavelength selector. This phenomena is called stray radiation.
Deviation from beer’s law: continue… From the beer’s law, the absorbance against the conc. A straight line passing through origin is obtained (linear graph) However, deviation might occurs. Deviation is due to the following factors: § A foreign substance having colour particle may affect the absorption & extinction coefficient. § Deviation also occur if colored solute ionized or dissociates in the solution; e. g. - benzyl alcohol in chloroform § Due to the presence of impurities that fluoresce or absorb at the absorption wave length. § If monochromatic light is not used deviation may occurs. § If width of the slit is not proper. § If the solution species undergoes polymerization
Block of Diagram - Spectrometer Source Monochromator Sample Detector Readout (meter or recorder) Sources : Tungsten lamp (visible), hydrogen or deuterium discharge tube (ultraviolet), hot wires, light bulb or glowing seramic (IR), laser Monochromator: prism, difraction grating, optical filters. Sampel cell: cuvets, KBr, UV/IR quartz. Detector: phototube, photomultiplier tube, spectrophotometer (UV) thermocouples, bolometers (IR)
Two types of Monochromator Grating: • A fundamental property of gratings is that the angle of deviation of all but one of the diffracted beams depends on the wavelength of the incident light. • Therefore, a grating separates an incident polychromatic beam into its constituent wavelength components, i. e. , it is dispersive. Because of their dispersive properties, gratings are commonly used in monochromators and spectrometers.
Two types of Monochromator Prism: • Electromagnetic radiation is refracted because index of refraction of prism material is different from air. • Shorter wavelengths are refracted more than longer wavelength • The effects of refraction is to ‘spread’ the wavelength apart into different wavelength • By rotating the prism, different wavelength can be made to pass through an exit slid and to the sample
To do a Spectroscopic Analysis You need: A continuous light source A wavelength selector A sample cell A detector The sample cell is called cuvet and can be made of many substances Glass (good for visible) Quartz (UV-vis) Na. Cl/KBr (IR)
Spectroscopic Procedure You may have a single-beam or double beam Single-beam instrument has one sample holder, you must swap blank and sample Double-beam instrument splits light output between two holders so you can measure blank and sample A baseline spectrum is a spectrum of a reference solution (solvent or reagent blank) We try to do an analysis at the λmax if we can Sensitivity is greatest at maximum absorbance Curve is relatively flat in case the monochromator drifts and is off by a little in wavelength
The Single-Beam Spectrometer
How Do UV spectrometers work? Rotates, to achieve scan Matched quartz cuvettes Sample in solution at ca. 10 -5 M. System protects PM tube from stray light D 2 lamp-UV Tungsten lamp-Vis Double Beam makes it a difference technique Two photomultiplier inputs, differential voltage drives amplifier.
Optics of the Grating Monochromator The polychromatic light is separated into monochromatic wavelengths by diffraction. n = d(sin + sin )
Optics of the Grating Monochromator In the equation n = d(sin + sin ) n is the order of the diffraction n = 1, 2, 3 etc, d is the number of lines etched on the grating, is the angle of the incident beam and is the angle of the emerging beam.
The photodiode array detector
The photodiode array detector
UV Instrumentation Key components: (1) Light Source (2) Monochromator (3) Sample/reference holder (4) Radiation detection (5) Readout device
Spectroscopic Procedure You should always try to keep the absorbance reading of your sample below 1. Because % transmittance is related logarithmically with concentration, it means that from 1 -99% transmittance you can detect ~ 2 orders of magnitude in analyte concentration. Any orders of magnitude greater than that will be detected in the range of 0 -1% T. In order to maximize accuracy, you should dilute the solution if you have to so that the transmittance reading is not maxed out in that region.
An Electronic Spectrum Make solution of concentration low enough that A≤ 1 (Ensures Linear Beer’s law behavior) 1. 0 maxwith certain extinction UV Visible Even though a dual beam goes through a solvent blank, choose solvents that are UV transparent. Absorbance Can extract the value if conc. (M) and b (cm) are known UV bands are much broader than the photonic transition event. This is because vibration levels are superimposed on UV. 0. 0 200 400 Wavelength, , generally in nanometers (nm) 800
Ultraviolet Spectroscopy 200 -400 nm photons excite electrons from a bonding orbital to a * antibonding orbital. Conjugated dienes have MO’s that are closer in energy. A compound that has a longer chain of conjugated double bonds absorbs light at a longer wavelength. =>
Absorption Characteristics of Some Common Chromophores Chromophore Example Solvent max (nm) max Type of transition Alkene n-Heptane 177 13, 000 p p * Alkyne n-Heptane 178 196 225 10, 000 2, 000 160 p p * _ _ Carbonyl n-Hexane 186 280 1, 000 16 n s* n p * n-Hexane 180 293 Large 12 Carboxyl Ethanol 204 41 n p * Amido Water 214 60 n p * Azo Ethanol 339 5 n p * n s* n p * Nitro CH 3 NO 2 Isooctane 280 22 Nitroso C 4 H 9 NO Ethyl ether 300 665 100 20 n p * 270 12 n p * Nitrate C 2 H 5 ONO 2 Dioxane _
Solvents for UV (showing high energy cut-offs) Water 205 THF CH 3 C N 210 CH 2 Cl 2235 C 6 H 12 210 CHCl 3 245 Ether 210 CCl 4 265 Et. OH 210 benzene 280 Hexane 210 Acetone 300 Me. OH 210 Dioxane 220 Various buffers for HPLC, check before using. 220
Deviation from Beer’s Law Beer’s law is only valid for low concentration, up to 10 m. M; The intermolecular distances in a given solution will decrease, eventually reach a point at which neighboring molecules mutually affect the charge distribution of the other affect Chemical processes such as the reversible associationdissociation of analyte molecules, or the ionization of a weak acid in an unbuffered solvent. Instrumentation limitation-incident beam may be polychromatic.
Background Correction -Processes other than analyte absorption result in significant decrease in the power of the incident beam; - Reference cell is used to correct these processes; - Reference cell is often prepared by adding distilled water to an absorption cell; - The reference cell is then placed in the path of the light beam, and the power of the radiation exiting the reference cell is measured and taken as P 0 for the sample cell.
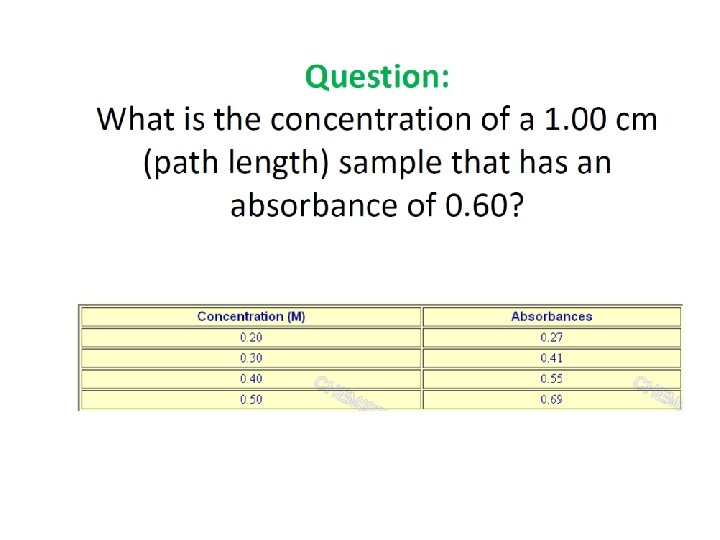
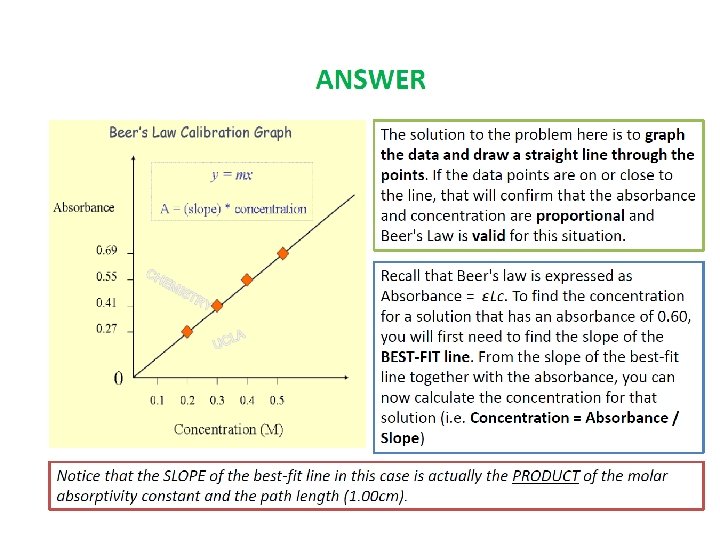
Calibration Curves • Linear calibration curve; • Nonlinear calibration
An Example--Pulegone Frequently plotted as log of molar extinction So at 240 nm, pulegone has a molar extinction of 7. 24 x 103 Antilog of 3. 86
INFRARED SPECTROSCOPY
Introduction Spectroscopy is an analytical technique which helps determine structure It destroys little or no sample The amount of light absorbed by the sample is measured as wavelength is varied
Infrared spectroscopy is very useful for obtaining qualitative information about the molecules. But molecule must possess certain properties in order to undergo absorption.
IR Spectroscopy The presence and also the environment of functional groups in organic molecule can be identified by infrared (IR) spectroscopy. Infrared spectroscopy is nondestructive. Moreover, the small quantity of sample needed, the speed with which spectrum can be obtained, the relatively low cost of the spectrometer, and I wide applicability of the method combine to make infrared spectroscopy one the most useful tools available to the organic chemist
THE ELECTROMAGNETIC SPECTRUM Frequency (n) high X-RAY Energy INFRARED MICROWAVE ULTRAVIOLET Vibrational infrared Visible Ultraviolet 2. 5 mm 200 nm 400 nm BLUE short low 15 mm RADIO Nuclear magnetic resonance 1 m 800 nm RED Wavelength ( ) FREQUENCY long 5 m
Types of Energy Transitions in Each Region of the Electromagnetic Spectrum REGION ENERGY TRANSITIONS X-ray UV/Visible Infrared Microwave Bond-breaking Electronic Vibrational Rotational Radio Frequency Nuclear and Electronic Spin (NMR)
Principles IR Spectroscopy Energy: E=h where: is the frequency in hertz In IR, frequency is commonly expressed as wave numbers ( , in Reciprocal cm, or cm-1) Where
Principles IR Spectroscopy • Absorption of radiation in this region by a typical organic molecule results in the excitation of vibrational, rotational, and bending modes, while the molecule itself remains in its electronic ground state. • Molecular asymmetry is a requirement for excitation by infrared radiation and fully symmetric molecules do not display absorbance in this region unless asymmetric stretching or bending transitions are possible. Symmetric stretch Assymmetric stretch Symmetric bending
Principles IR Spectroscopy For the purpose of routine organic structure determination, the most important absorptions in the infrared region are the simple stretching vibrations. For simple systems, these can be approximated by considering the atoms as point masses, linked by a “spring” having a spring constant k and following Hooke’s Law.
Principles IR Spectroscopy Using this simple approximation, the equation shown in below can be utilized to approximate the characteristic stretching frequency (in cm-1) of two atoms of mass m 1 and m 2, linked by a bond with a spring constant k: Where =m 1 m 2/(m 1+m 2) , also called “reduced mass”
Absorption of Infrared Radiation Only bonds which have significant dipole moments will absorb infrared radiation. Dipole is the polar covalent bond in which a pair of electron is shared unequally. For absorption occur, there must be a charge in the dipole moment (polarity) of the molecule. A diatomic molecule must have a permanent dipole in order to absorb, but larger molecule do not.
DIPOLE MOMENTS Bonds which do not absorb infrared include: Symmetrically substituted alkenes and alkynes Many types of C-C Bonds Symmetric diatomic molecules H-H Cl-Cl
Molecular Vibrations Light is absorbed when radiation frequency = frequency of vibration in molecule Covalent bonds vibrate at only certain allowable frequencies Associated with types of bonds and movement of atoms Vibrations include stretching and bending
IR Instrumentation Light source: Nichrome wire that glows when an electrical current is passed through; Interferometer: no monochrometer Detector: thermocouple detector, whose output voltage varies with changes caused by varying levels of radiation striking the detector.
IR Instrumentation
Infrared Spectroscopy (IR) § No two molecules of different structure will have exactly the same natural frequency of vibration, each will have a unique infrared absorption pattern or spectrum. § Two Uses: 1. IR can be used to distinguish one compound from another. 2. Absorption of IR energy by organic compounds will occur in a manner characteristic of the types of bonds and atoms in the functional groups present in the compound; thus, infrared spectrum gives structural information about a molecule. § The absorptions of each type of bond (N–H, C–H, OH, C–X, C=O, C–C, C=C, C≡N, etc. ) are regularly found only in certain small portions of the vibrational infrared region, greatly enhancing analysis possibilities.
Infrared Spectroscopy (IR) The Infrared Spectrum A plot of absorption intensity (% Transmittance) on the y-axis vs. frequency (wavenumbers) on the x-axis.
Infrared Spectroscopy (IR) Principal Frequency Bands (from left to right in spectrum) O H N H C≡N C≡C C=O C=C CH 2 CH 3 C O 3600 cm-1 (Acids - Very Broad, Alcohols - Broad) 3300 - 3500 cm-1 (2, 1, 0 peaks – 1 o, 2 o, 3 o) 2250 cm-1 (Nitrile) 2150 cm-1 (Acetylene) 1685 - 1725 cm-1 (1715) (Carbonyl) 1650 cm-1 (Alkene); 4 absorptions 1450 -1600 (aromatic) 1450 cm-1 (Methylene Group) 1375 cm-1 (Methyl Group) 900 - 1100 cm-1 (Alcohol, Acid, Ester, Ether, Anhydride) -C H =C-H ≡C-H (Saturated Alkane absorptions on Right side of 3000 cm-1) (Unsaturated Alkene absorptions on Left side of 3000 cm-1) (Aromatic absorptions) – Verify at 1667 – 2000 cm-1 (Unsaturated Alkyne absorptions on Left side of 3000 cm-1)
Infrared Spectroscopy (IR) Suggested approach for analyzing IR Spectra Step 1. – Check for the presence of the Carbonyl group (C=O) at 1715 cm-1. If molecule is conjugated, the strong (C=O) absorption will be shifted to the right by ~30 cm-1, i. e. , ~1685 cm-1 If the Carbonyl absorption is present, check for: § Carboxylic Acids - Check for OH group (broad absorption near 3300 -2500 cm-1) § Amides - Check for NH group (1 or 2 absorptions near 3500 cm-1) § Esters - Check for 2 C-O group (medium absorptions near 1300 -1000 cm-1) § Anhydrides - Check for 2 C=O absorptions near 1810 and 1760 cm-1 § Aldehydes - Check for Aldehyde CH group (2 weak absorptions near 2850 and 2750 cm-1) § Ketones - Ketones (The above groups have been eliminated)
Infrared Spectroscopy (IR) Step 2. - If the Carbonyl Group is Absent Check for Alcohols, Amines, or Ethers. § Alcohols & Phenols - Check for OH group (Broad absorption near 3600 -3300 cm-1 Confirm present of C O near 1300 -1000 cm-1 § Amines - Check for NH stretch (Medium absorptions) near 3500 cm-1 Primary Amine - 2 Peaks Secondary Amine - 1 Peak Tertiary Amine - No peaks N-H Scissoring at 1560 - 1640 cm-1 N-H Bend at 800 cm-1 § Ethers - Check for C-O group near 13001000 cm-1 and absence of OH
Infrared Spectroscopy (IR) Step 3. – Refine the Structure Possibilities by Looking for Double Bonds, Triple Bonds and Nitro Groups § Double Bonds - Unsaturated C=C (and C≡C) stretch show absorptions on the left side of 3000 cm-1 Alkene C=C weak absorption near 1650 cm-1 Aromatic C=C (4 absorptions 1450 -1650 cm-1) (Verify Aromatic at 1667 – 2000 cm-1) § Triple Bonds - R-C ≡ N Nitrile - medium, sharp absorption (stretch) near 2250 cm-1 R – C ≡ C – R Alkyne - weak, sharp absorption (stretch near 2150 cm-1) R – C ≡ C – H Terminal Acetylene (stretch near 3300 cm -1) § Nitro Groups - Two strong absorptions 1600 – 1500 cm-1 and 1390 - 1300 cm-1
Infrared Spectroscopy (IR) Step 3 (Con’t) Aromatic Ring Absorptions § Aromatic unsaturated C=C bonds show an absorption on the left side of 3000 cm-1, but the aromaticity must be verified in the overtone region (1667 – 2000 cm-1) and the out -of-plane (OOP) region (900 - 690 cm-1) § 4 Medium to strong absorptions in region 1650 - 1450 cm-1 § Many weak combination and overtone absorptions appear between 2000 and 1667 cm-1 The relative shapes and numbers (1 - 4) of the overtone absorptions can be used to tell whether the aromatic ring is monosubstituted or di-, tri-, tetra-, penta-, or hexasubstituted. Positional (ortho (o), meta (m), para (p)) isomers can also be distinguished. Note: A strong carbonyl absorption can overlap these overtone bands, making them unusable.
Infrared Spectroscopy (IR) Step 3 (Con’t) Aromatic Ring Absorptions (Con’t) § The unsaturated =C-H “Out-of-Plane (OOP) bending absorptions in the region 900 – 690 cm-1 can also be used to determine the type of ring substitution. § The number of absorptions and their relative positions are unique to each type of substitution. § Although these absorptions are in the “Fingerprint” region they are particularly reliable for rings with Alkyl group substitutions. § They are less reliable for Polar substituents.
Infrared Spectroscopy (IR) Step 4. If none of the above apply then the compound is most likely a: Hydrocarbon or Alkyl Halide Generally, a very simple spectrum Hydrocarbons - Check for saturated Alkane absorptions just on the right side of 3000 cm-1
ATOMIC ABSORPTION SPECTROMETRY
An atomic absorption spectrophotometer consists of a light source, a sample compartment and a detector.
Atomic spectroscopy is one of the major tools for of trace (ppm and ppb) metallic elements in industrial and environmental laboratories.
In these methods the solution sample is aspirated into a flame that is hot enough to break the molecules into their atomic states. The concentration of the analyte in the flame may be measured by either its absorption or emission of the radiation. The absorption mode is known as atomic absorption spectroscopy (AAS) whereas emission mode as atomic emission Spectroscopy (AES)
Sensitivity Atomic spectroscopy is very sensitive for most elements. Concentrations at the ppm level may be routinely determined using flame atomisation. Using electrothermal atomisation, concentrations at the ppb may be determined. 1 ppm = 10 -6 g/g or 1 g/g The density of dilute aqueous solutions is approximately 1. 00 so that: 1 g/g of aqueous solution = 1 g/ml = 1 ppm Fe = 1 x 10 -6 g Fe/ml = 1. 79 x 10 -5 mol dm-3
Instrumentation for an Atomic Absorption Spectrometer. The flowing fuel and air mixture provides the aspiration action drawing the solution sample into the flame.
Atomic Absorption Spectroscopy In atomic absorption spectroscopy the radiation of the lines of the analyte are produced by the lamp; the presence of the atomic state of the analyte in the flame attenuates or reduces the intensity of the radiation. The absorbance is proportional to the concentration of the analyte, similar to optical spectroscopy.
Atomic Absorption Spectrometry Most widely used method for determination of single elements in analytical chemistry Quantification of energy absorbed from an incident radiation source from the promotion of elemental electrons from the ground state Technique relies on a source of free elemental atoms electronically excited by monochromatic light
Upper Diagram is AES and the lower one is AAS. In FES the flame provides the excitation, but in AAS it provides only for the atomization.
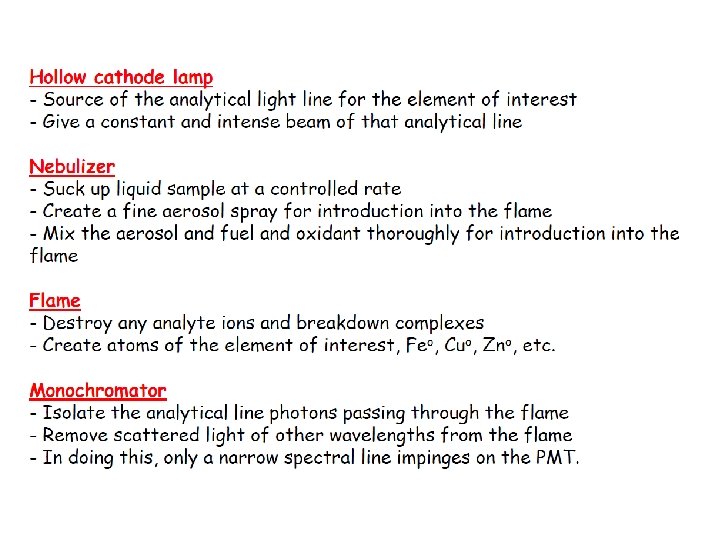
Hollow Cathode Lamp The light source in AAS is the hollow cathode lamp (HCL). The cathode is constructed of the metal or metals of the analysis. Passage of a dc voltage through the lamp produces the specific lines of those elements.
Atomic Absorption Spectroscopy
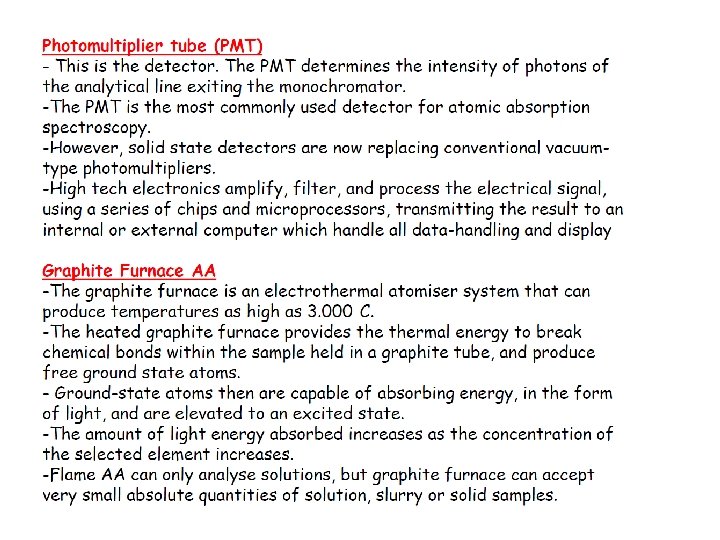
The signal from the detector is transferred to the computer, and the output registers on the monitor in a manner specified by the user.
Spectra output of the multi-element steel hollow cathode lamp. Note the extremely sharp spectral lines.
Sample Introduction in AAS Flame Method of supplying atom source Utilizes a nebulizer in conjunction with air/acetylene flame Solvent evaporates Metal salt vaporizes and is reduced to complete the atomization process Radiation source is a hollow cathode lamp