ANALYTICAL CHEMISTRY ERT 207 Lecture 5 Coefficient correlation
- Slides: 43
ANALYTICAL CHEMISTRY ERT 207 Lecture 5 Coefficient correlation Coefficient determination Calibration curve (slope & intercept)
Mid-term preparation Wednesday 6 November, 9 am BASIC STATISTICS Define accuracy and precision, remember ways of describing accuracy and precision, types of errors, understand the concept of significant figures, standard deviation. UTILIZATION OF STATISTICS IN DATA ANALYSIS Identify the significant testing. Calculate the T
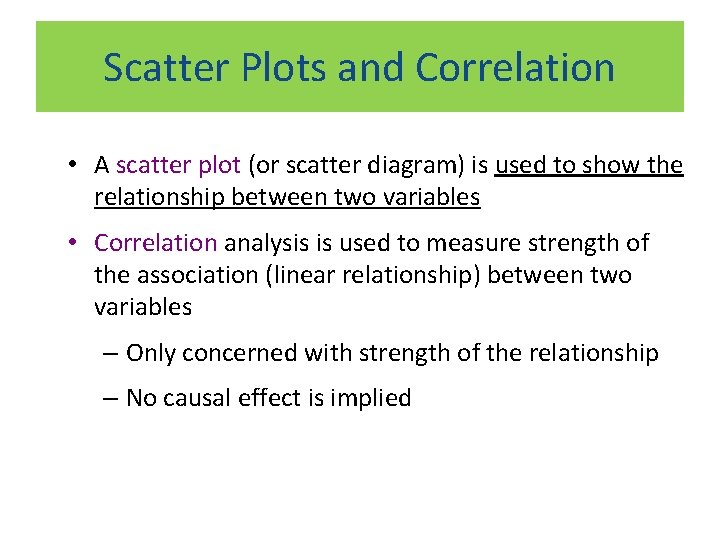
Scatter Plots and Correlation • A scatter plot (or scatter diagram) is used to show the relationship between two variables • Correlation analysis is used to measure strength of the association (linear relationship) between two variables – Only concerned with strength of the relationship – No causal effect is implied
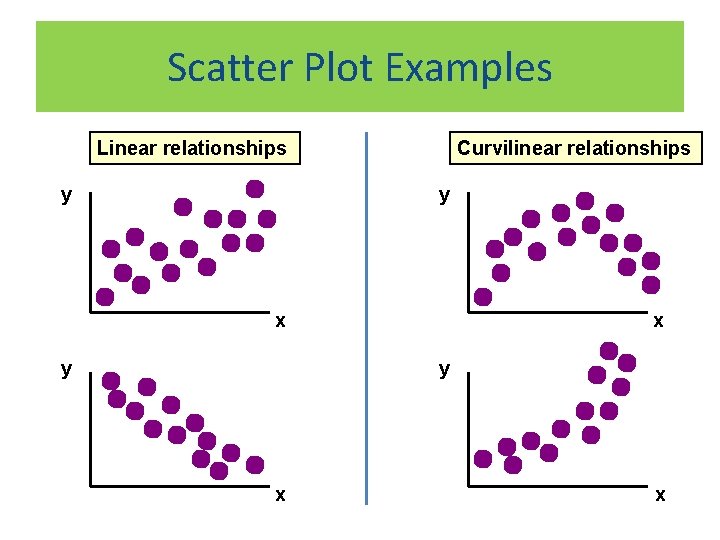
Scatter Plot Examples Linear relationships y Curvilinear relationships y x y x x
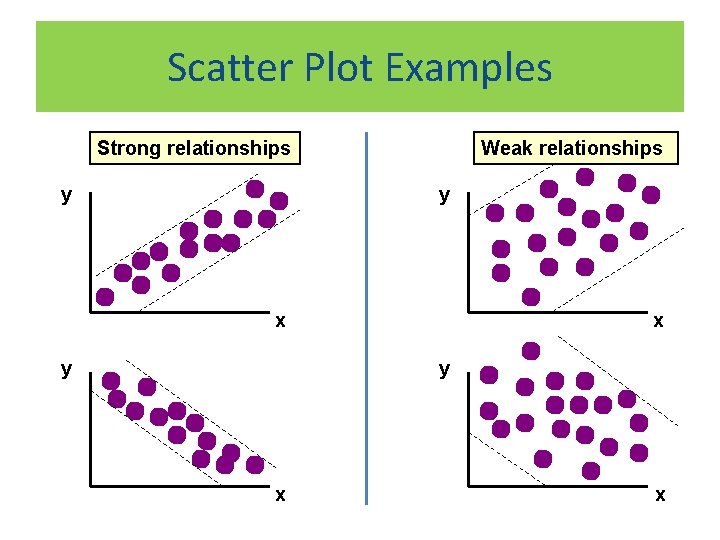
Scatter Plot Examples Strong relationships y Weak relationships y x y x x
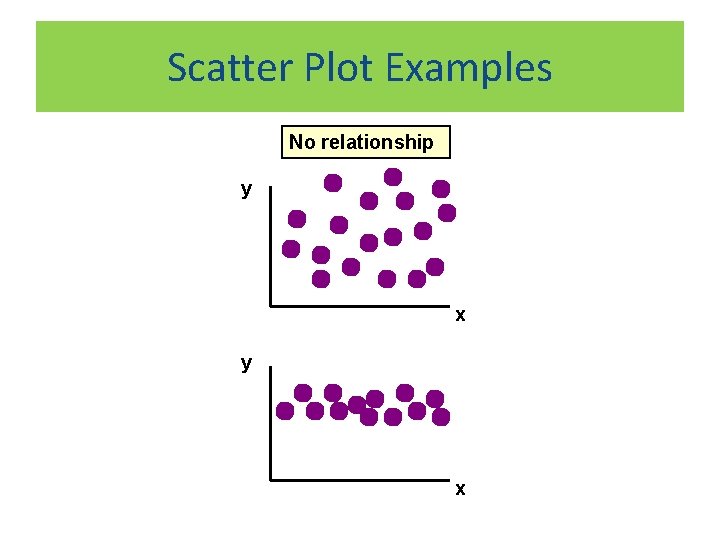
Scatter Plot Examples No relationship y x
Correlation Coefficient • The population correlation coefficient ρ (rho) measures the strength of the association between the variables • The sample correlation coefficient r is an estimate of ρ and is used to measure the strength of the linear relationship in the sample observations
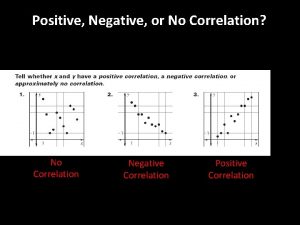
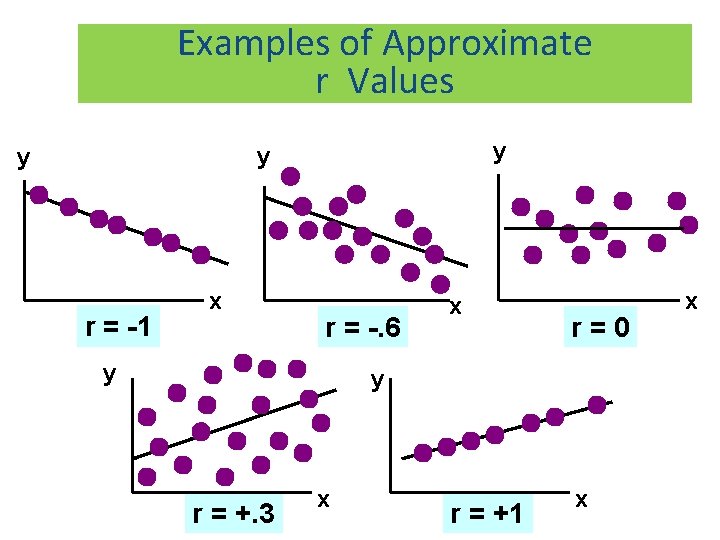
Features of ρ and r Unit free Range between -1 and 1 The closer to -1, the stronger the negative linear relationship The closer to 1, the stronger the positive linear relationship The closer to 0, the weaker the linear relationship
Examples of Approximate r Values y y y r = -1 x r = -. 6 y x r=0 y r = +. 3 x r = +1 x x
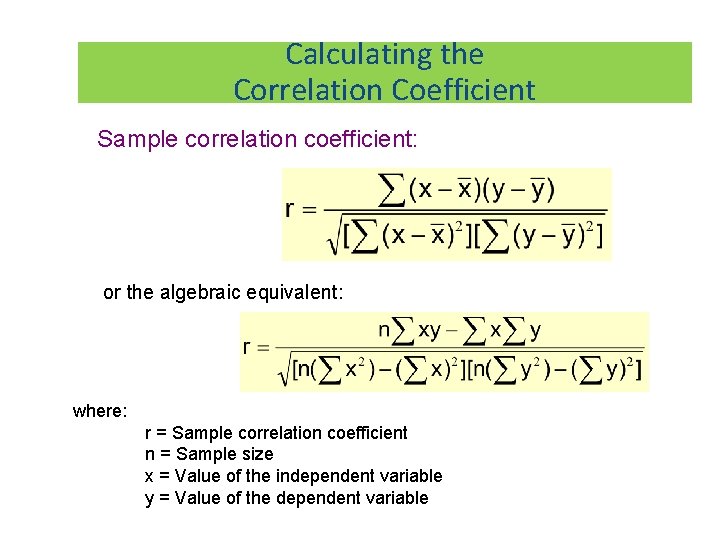
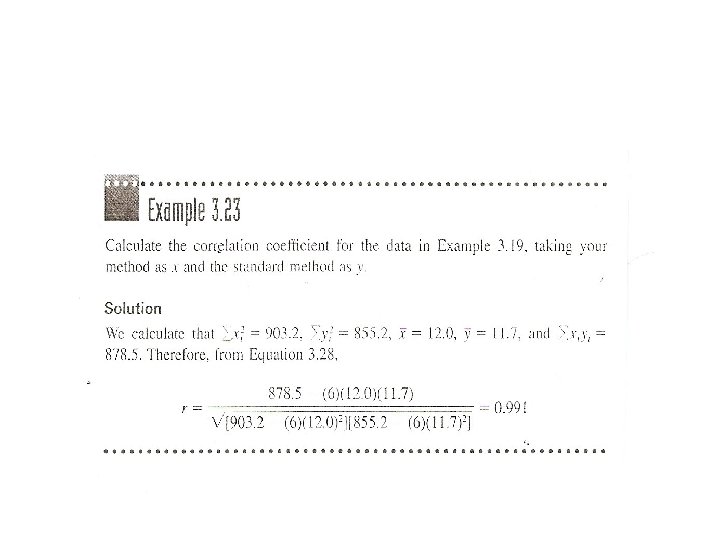
Calculating the Correlation Coefficient Sample correlation coefficient: or the algebraic equivalent: where: r = Sample correlation coefficient n = Sample size x = Value of the independent variable y = Value of the dependent variable
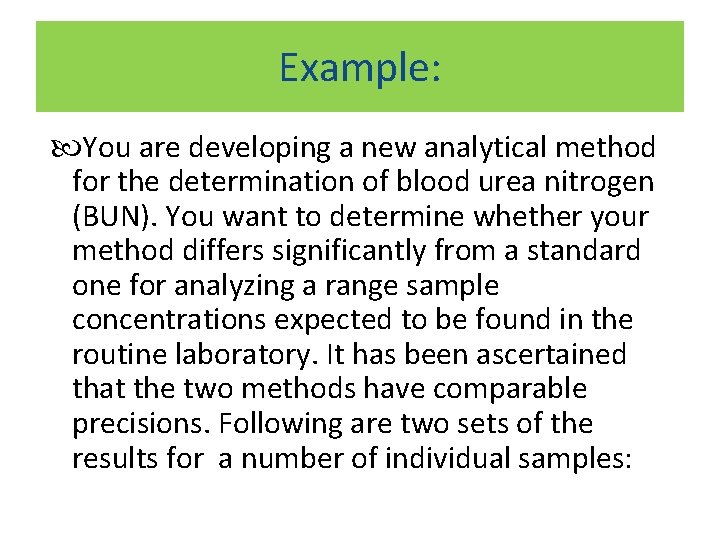
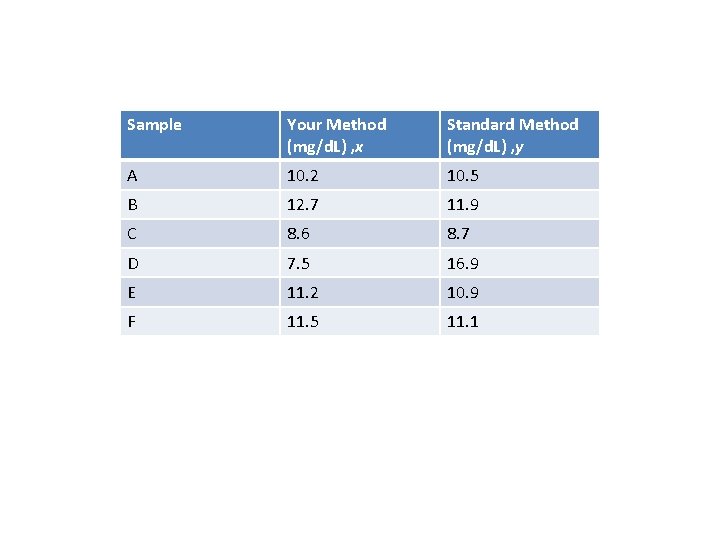
Example: You are developing a new analytical method for the determination of blood urea nitrogen (BUN). You want to determine whether your method differs significantly from a standard one for analyzing a range sample concentrations expected to be found in the routine laboratory. It has been ascertained that the two methods have comparable precisions. Following are two sets of the results for a number of individual samples:
Sample Your Method (mg/d. L) , x Standard Method (mg/d. L) , y A 10. 2 10. 5 B 12. 7 11. 9 C 8. 6 8. 7 D 7. 5 16. 9 E 11. 2 10. 9 F 11. 5 11. 1
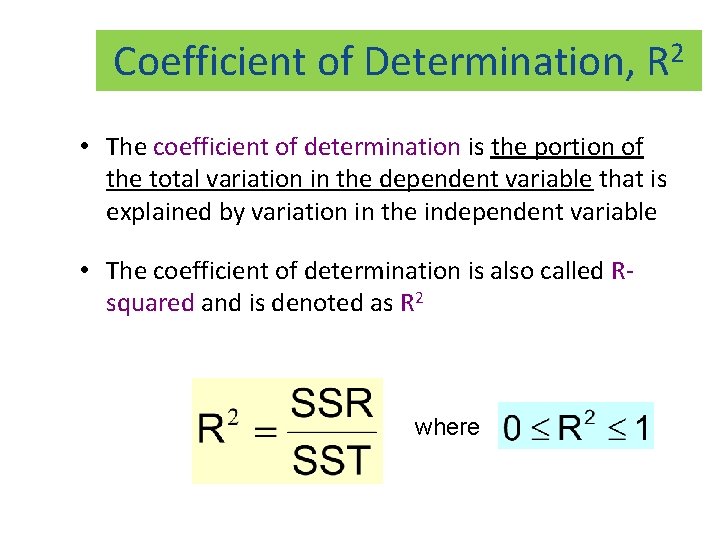
Coefficient of Determination, R 2 • The coefficient of determination is the portion of the total variation in the dependent variable that is explained by variation in the independent variable • The coefficient of determination is also called Rsquared and is denoted as R 2 where
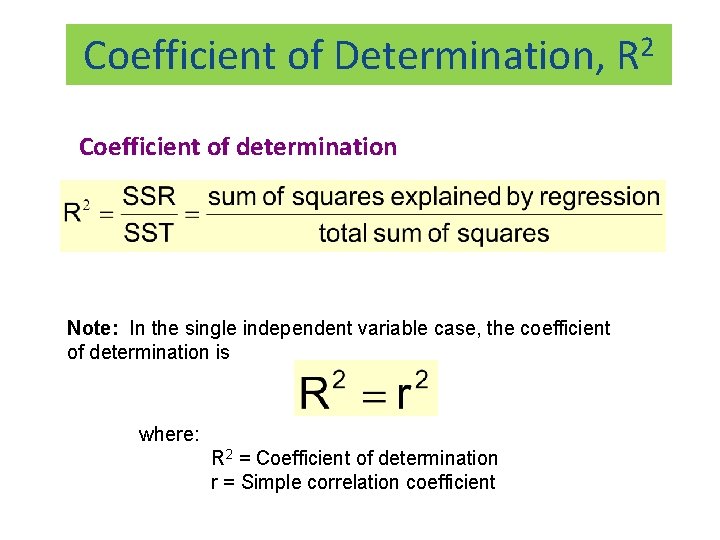
Coefficient of Determination, Coefficient of determination Note: In the single independent variable case, the coefficient of determination is where: R 2 = Coefficient of determination r = Simple correlation coefficient 2 R
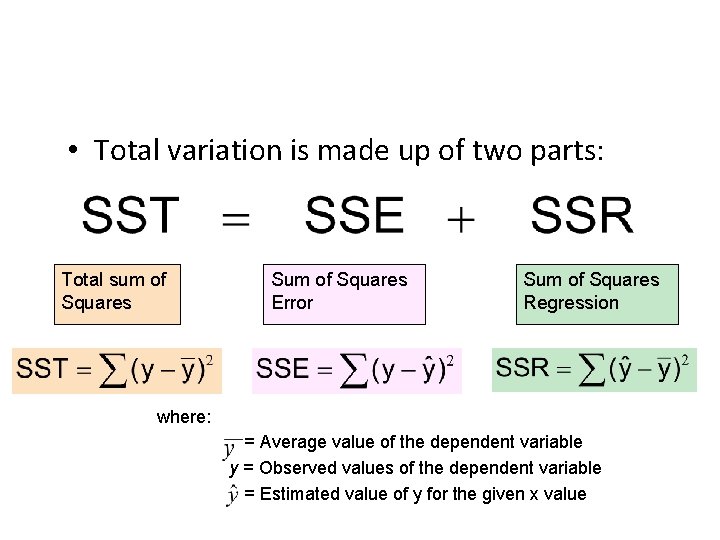
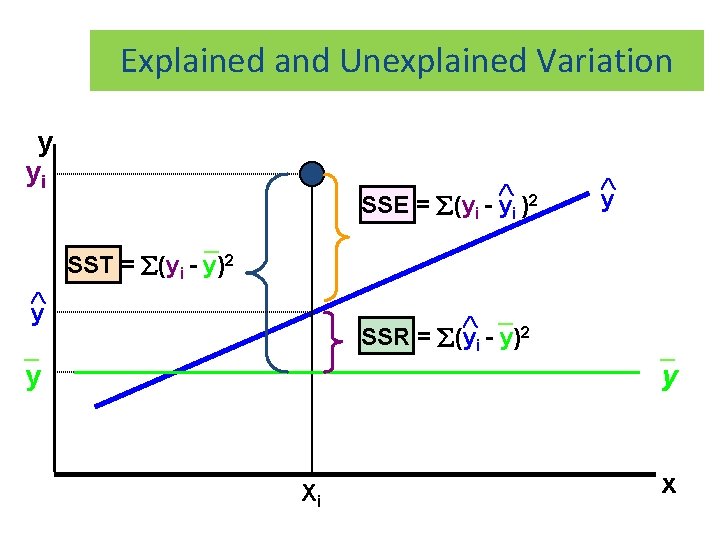
• Total variation is made up of two parts: Total sum of Squares Sum of Squares Error Sum of Squares Regression where: = Average value of the dependent variable y = Observed values of the dependent variable = Estimated value of y for the given x value
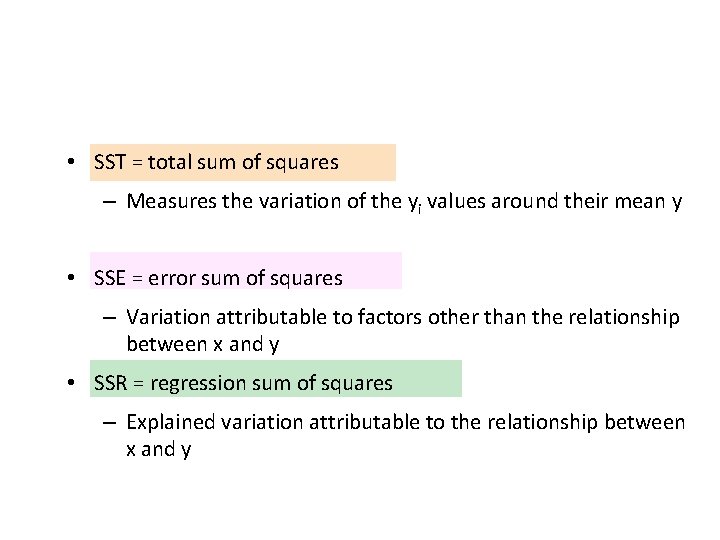
• SST = total sum of squares – Measures the variation of the yi values around their mean y • SSE = error sum of squares – Variation attributable to factors other than the relationship between x and y • SSR = regression sum of squares – Explained variation attributable to the relationship between x and y
Explained and Unexplained Variation y yi 2 SSE = (yi - yi ) _ y y SST = (yi - y)2 _2 SSR = (yi - y) _ y Xi _ y x
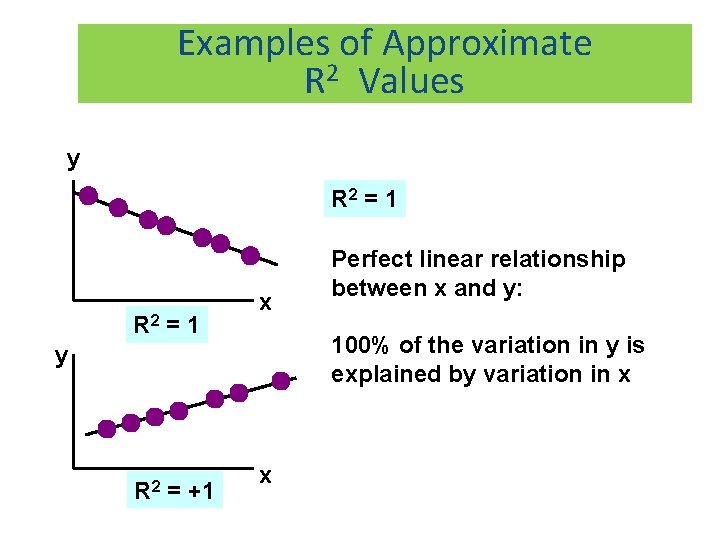
Examples of Approximate R 2 Values y R 2 = 1 x 100% of the variation in y is explained by variation in x y R 2 = +1 Perfect linear relationship between x and y: x
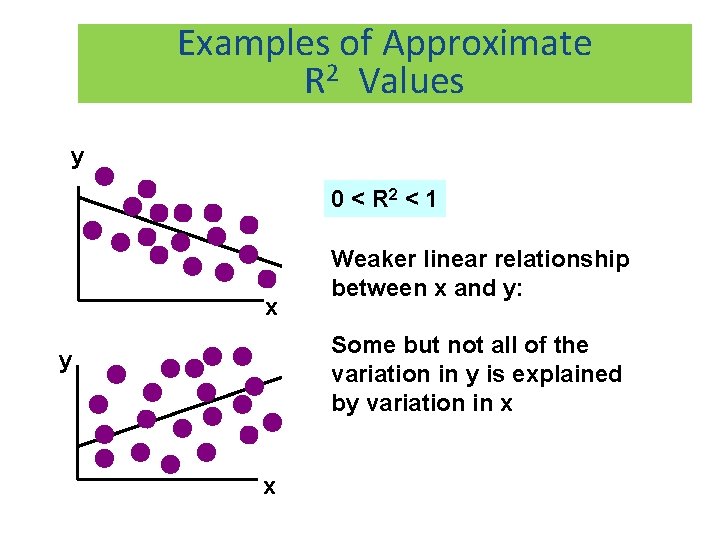
Examples of Approximate R 2 Values y 0 < R 2 < 1 x Weaker linear relationship between x and y: Some but not all of the variation in y is explained by variation in x y x
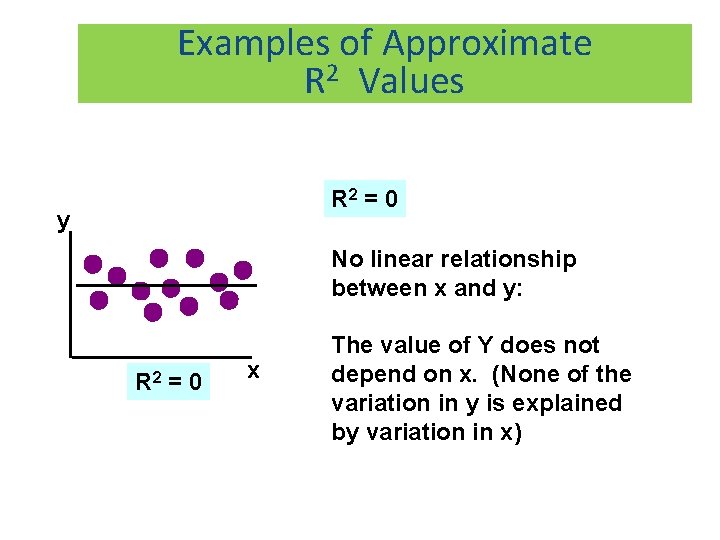
Examples of Approximate R 2 Values R 2 = 0 y No linear relationship between x and y: R 2 = 0 x The value of Y does not depend on x. (None of the variation in y is explained by variation in x)
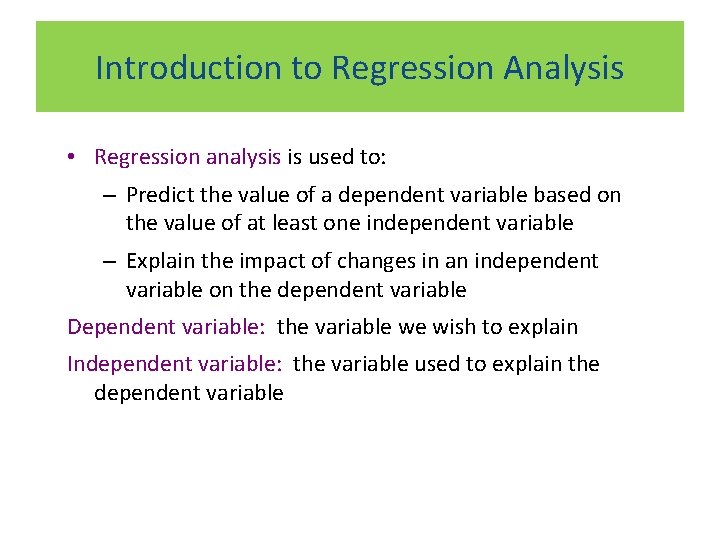
Introduction to Regression Analysis • Regression analysis is used to: – Predict the value of a dependent variable based on the value of at least one independent variable – Explain the impact of changes in an independent variable on the dependent variable Dependent variable: the variable we wish to explain Independent variable: the variable used to explain the dependent variable
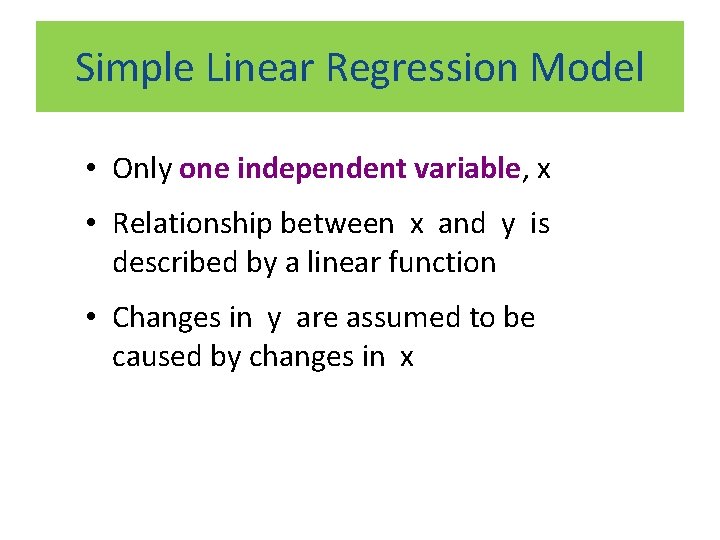
Simple Linear Regression Model • Only one independent variable, x • Relationship between x and y is described by a linear function • Changes in y are assumed to be caused by changes in x
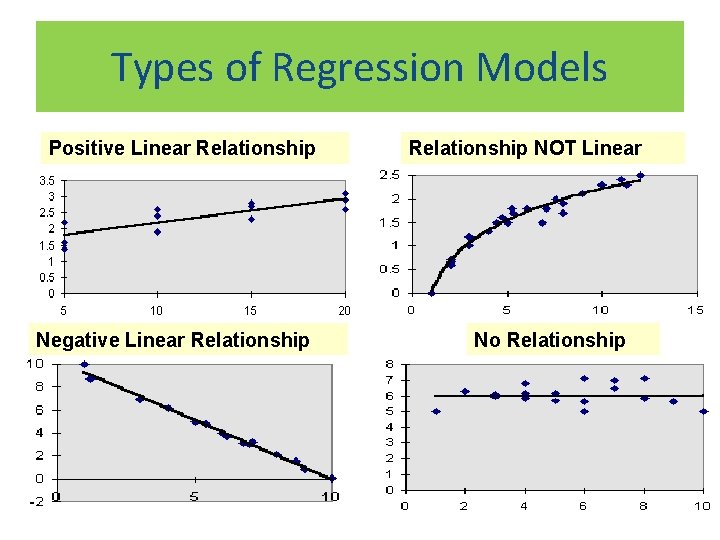
Types of Regression Models Positive Linear Relationship Negative Linear Relationship NOT Linear No Relationship
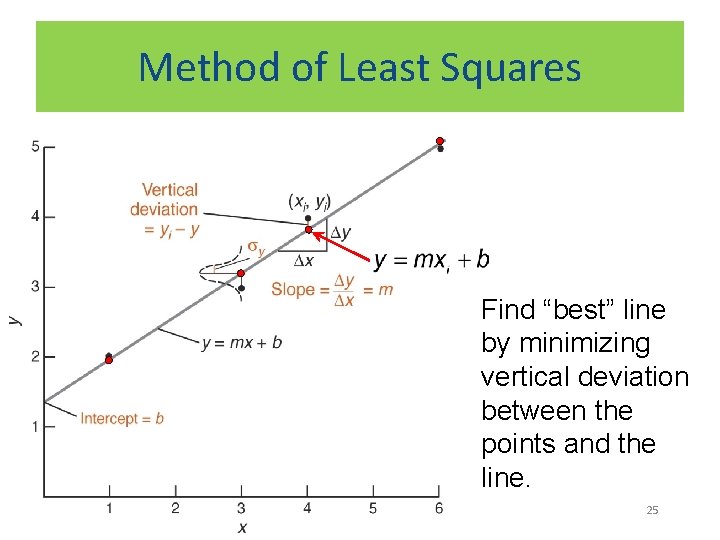
Method of Least Squares Find “best” line by minimizing vertical deviation between the points and the line. Chemistry 215 Copyright D Sharma 25
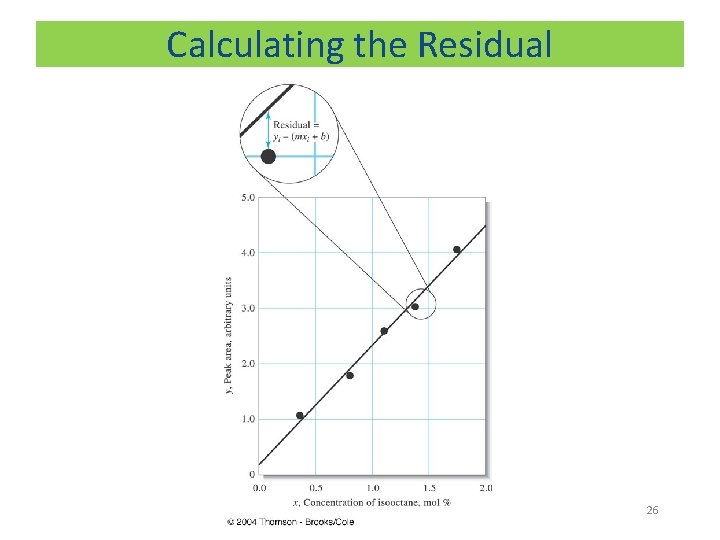
Calculating the Residual 26
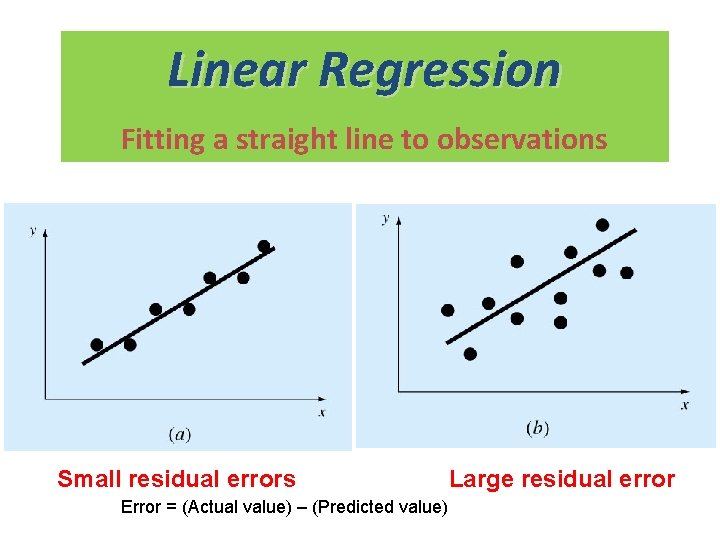
Linear Regression Fitting a straight line to observations Small residual errors Error = (Actual value) – (Predicted value) Large residual error
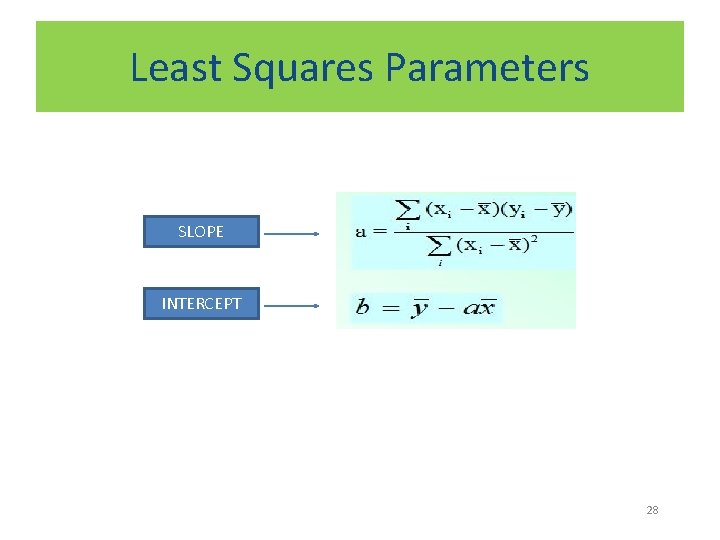
Least Squares Parameters SLOPE INTERCEPT 28
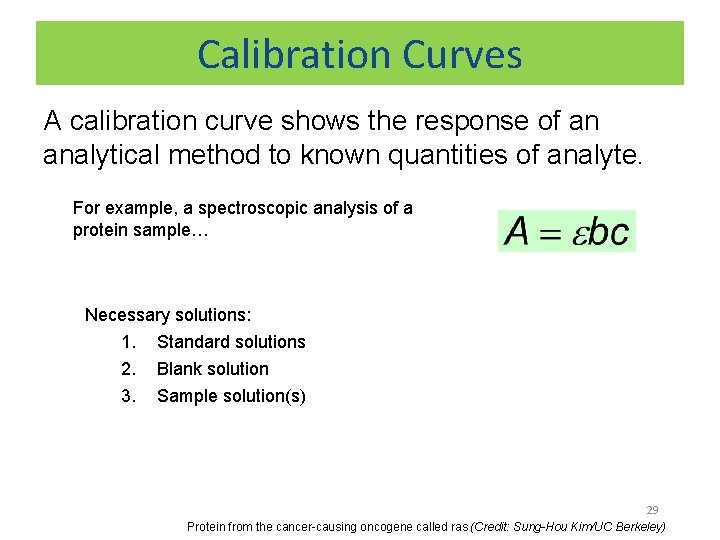
Calibration Curves A calibration curve shows the response of an analytical method to known quantities of analyte. For example, a spectroscopic analysis of a protein sample… Necessary solutions: 1. 2. 3. Standard solutions Blank solution Sample solution(s) 29 Protein from the cancer-causing oncogene called ras (Credit: Sung-Hou Kim/UC Berkeley)
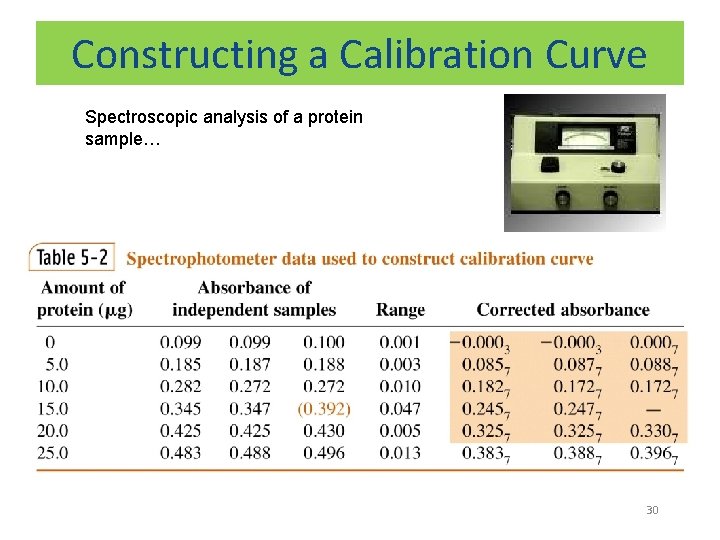
Constructing a Calibration Curve Spectroscopic analysis of a protein sample… 30
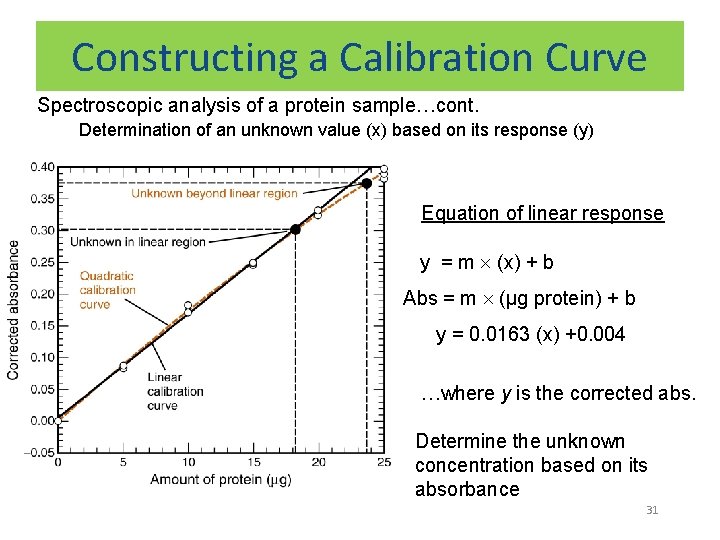
Constructing a Calibration Curve Spectroscopic analysis of a protein sample…cont. Determination of an unknown value (x) based on its response (y) Equation of linear response y = m (x) + b Abs = m (µg protein) + b y = 0. 0163 (x) +0. 004 …where y is the corrected abs. Determine the unknown concentration based on its absorbance 31
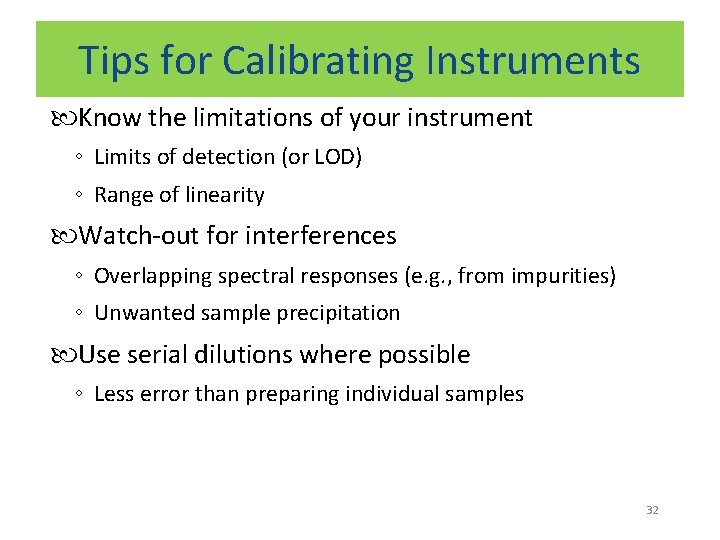
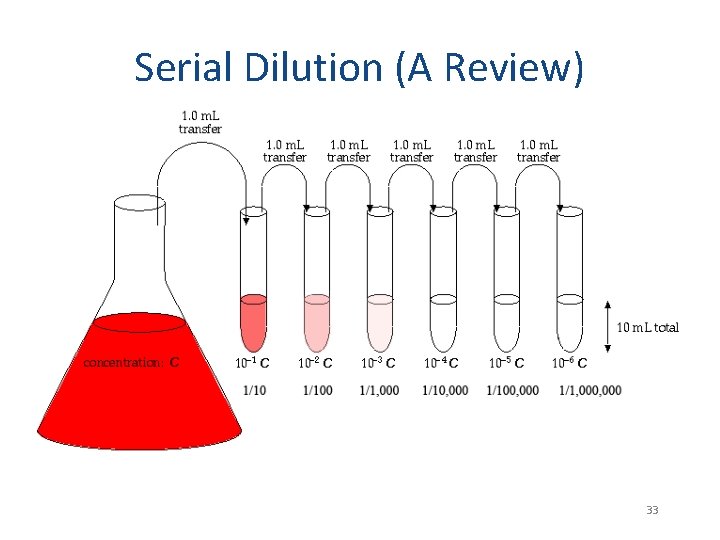
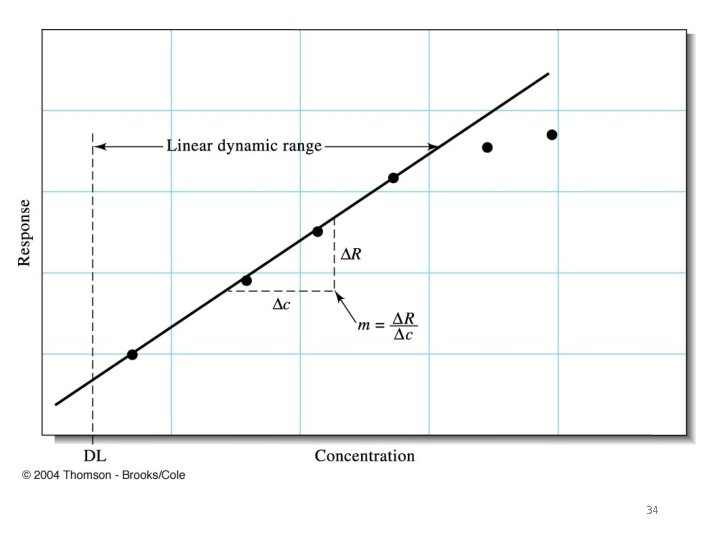
Tips for Calibrating Instruments Know the limitations of your instrument ◦ Limits of detection (or LOD) ◦ Range of linearity Watch-out for interferences ◦ Overlapping spectral responses (e. g. , from impurities) ◦ Unwanted sample precipitation Use serial dilutions where possible ◦ Less error than preparing individual samples 32
Serial Dilution (A Review) 33
34
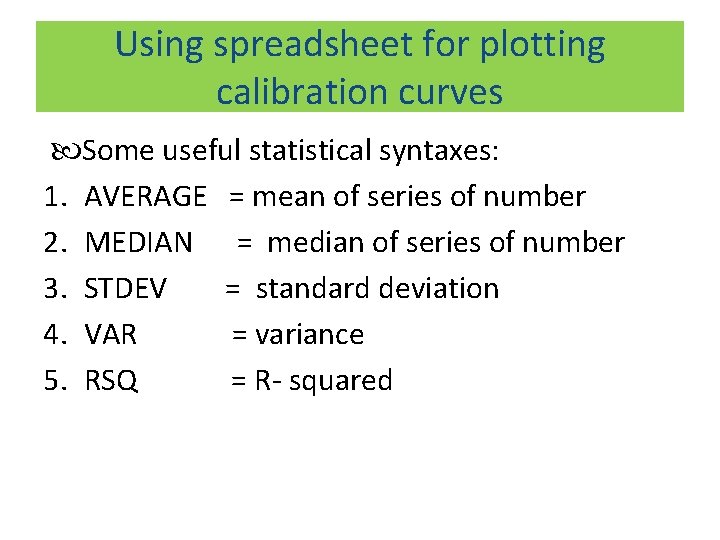
Using spreadsheet for plotting calibration curves Some useful statistical syntaxes: 1. AVERAGE = mean of series of number 2. MEDIAN = median of series of number 3. STDEV = standard deviation 4. VAR = variance 5. RSQ = R- squared
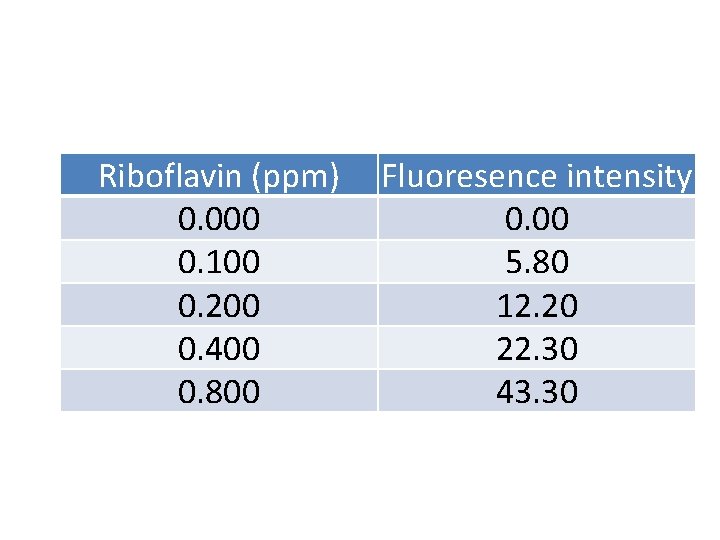
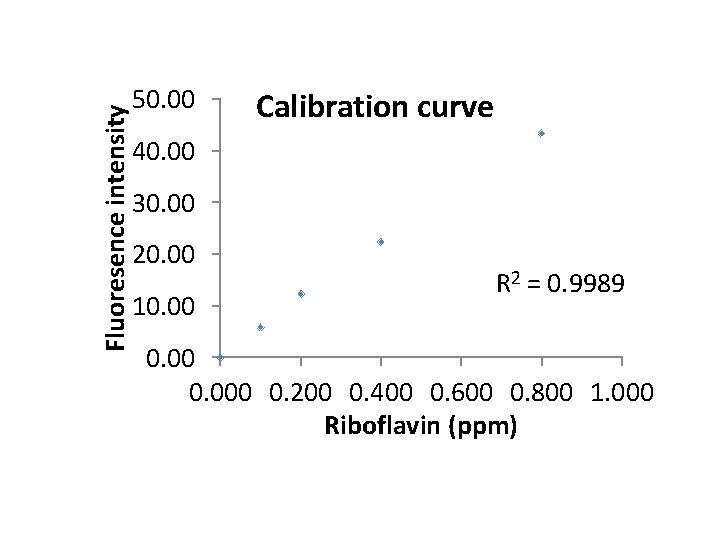
Riboflavin (ppm) 0. 000 0. 100 0. 200 0. 400 0. 800 Fluoresence intensity 0. 00 5. 80 12. 20 22. 30 43. 30
Fluoresence intensity 50. 00 Calibration curve 40. 00 30. 00 20. 00 10. 00 R 2 = 0. 9989 0. 000 0. 200 0. 400 0. 600 0. 800 1. 000 Riboflavin (ppm)
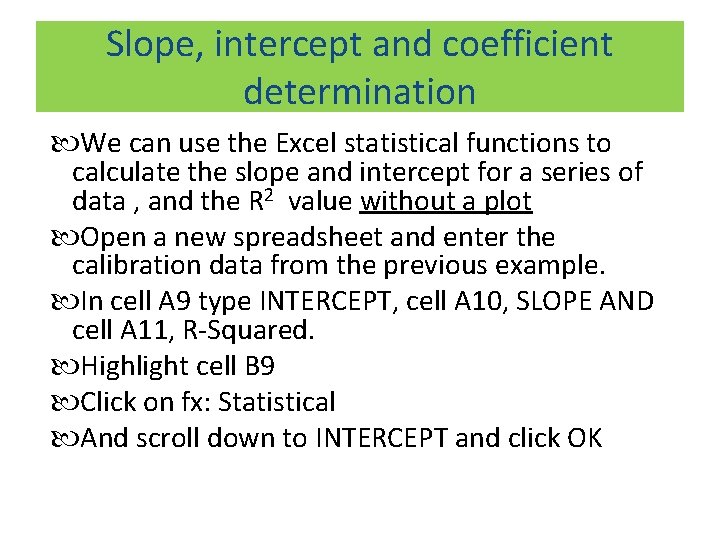
Slope, intercept and coefficient determination We can use the Excel statistical functions to calculate the slope and intercept for a series of data , and the R 2 value without a plot Open a new spreadsheet and enter the calibration data from the previous example. In cell A 9 type INTERCEPT, cell A 10, SLOPE AND cell A 11, R-Squared. Highlight cell B 9 Click on fx: Statistical And scroll down to INTERCEPT and click OK
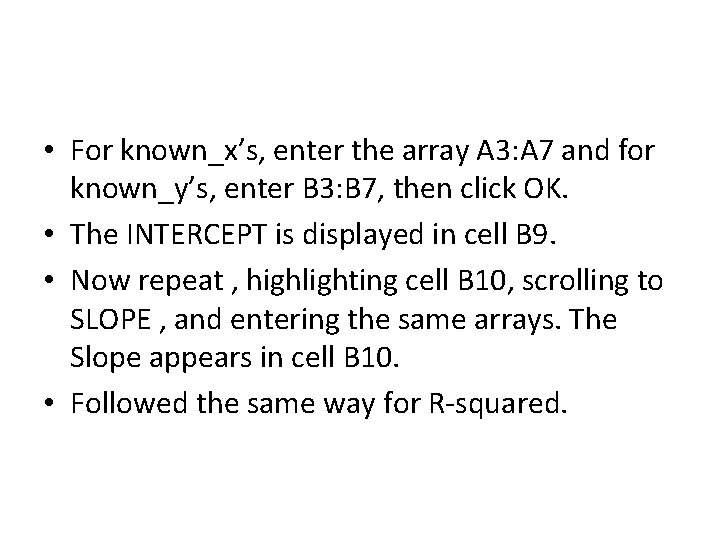
• For known_x’s, enter the array A 3: A 7 and for known_y’s, enter B 3: B 7, then click OK. • The INTERCEPT is displayed in cell B 9. • Now repeat , highlighting cell B 10, scrolling to SLOPE , and entering the same arrays. The Slope appears in cell B 10. • Followed the same way for R-squared.
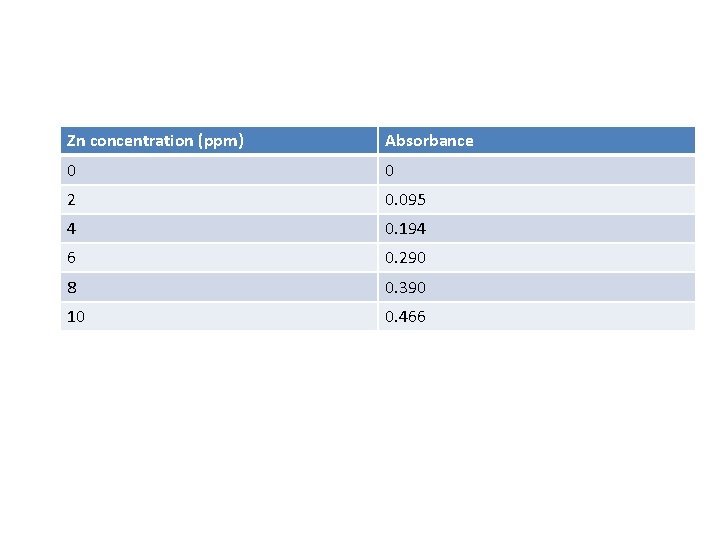
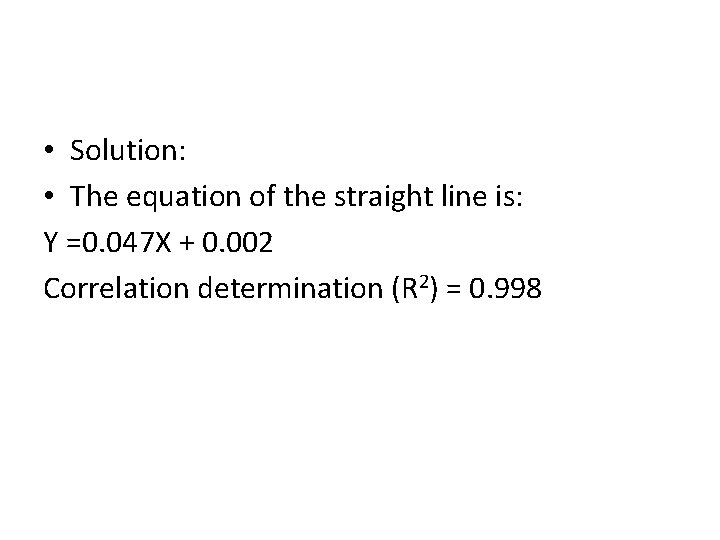
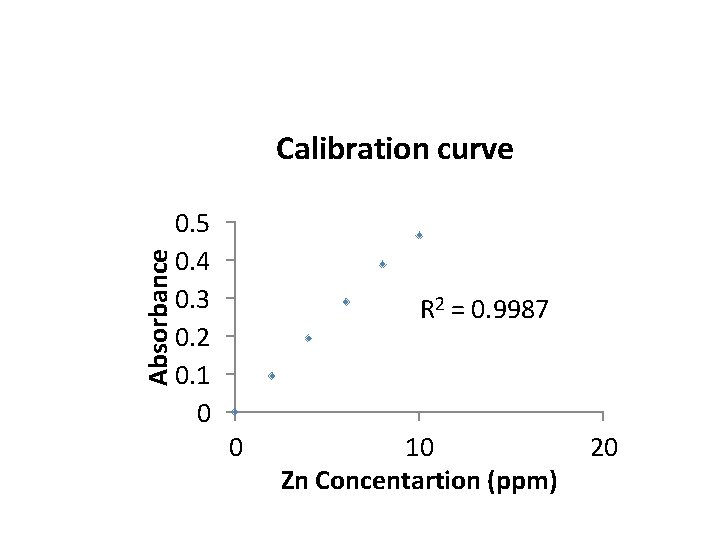
Exercise • The following data were obtained to get a calibration curve for the determination of Zn in the wastewater by using atomic absorption spectrometry (AAS). Using calculator or computer, plot the data and find the best straight line equation and correlation determination.
Zn concentration (ppm) Absorbance 0 0 2 0. 095 4 0. 194 6 0. 290 8 0. 390 10 0. 466
• Solution: • The equation of the straight line is: Y =0. 047 X + 0. 002 Correlation determination (R 2) = 0. 998
Absorbance Calibration curve 0. 5 0. 4 0. 3 0. 2 0. 1 0 R 2 = 0. 9987 0 10 Zn Concentartion (ppm) 20