Correlation Coefficient Using Technology Remember Correlation Coefficient indicates

Correlation Coefficient Using Technology

Remember: Correlation Coefficient= indicates how closely data points are to forming a straight line (shows the strength of correlation). • “r” represents the correlation coefficient • Only for scatter plots that appears to have a linear association • The value of the correlation coefficient is -1 ≤ r ≤ 1 • +1 is perfect positive correlation, very strong (an actual line) • 0 is no correlation • -1 is perfect negative correlation, very strong (an actual line with negative slope).

Perfect straight decreasing line Perfect straight increasing line

r can be calculated by a formula, using a graphing calculator, or an Excel spreadsheet. Example: How strong of a relationship is there between the length of your forearm and the length of your foot in centimeters? Enter the data into a graphing calculator. Forearm Length (cm) Foot Length (cm) 22 24 20 19 24 24 21 23 25 23 18 18 20 21 23 23 24 25 20 22 19 19 25 25 23 22 22 23 24 24 20 21 18 19 24 23 24 27 21 24 22 22

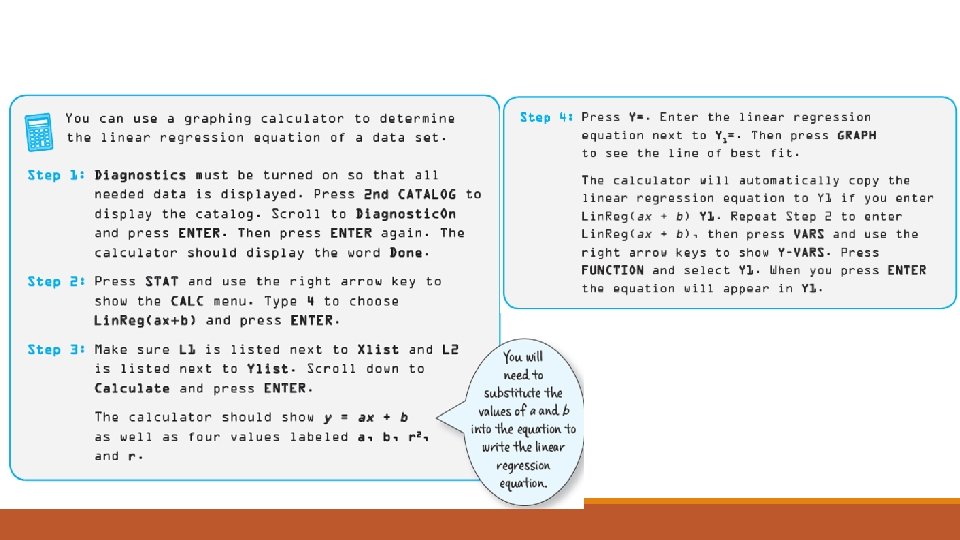
How do you calculate r with a graphing calculator?

How do you calculate r in Excel or a Google Sheet? Where your data starts in the first column. Where your data ends in the first column. r can be calculated by a formula, using a graphing calculator, or an Excel spreadsheet. Step 1: Enter data into two columns on the spreadsheet. Where your Step 2: Highlight or click on the box where you want the data starts in the correlation coefficient displayed. second Step 3: In Google Sheets type in the formula column. ◦ =CORREL(A____: A____, B____: B______) ◦ Click enter. ◦ Reformat your correlation coefficient to the number of decimal places you desire. Where your data ends in the second column.

Google Sheet The correlation coefficient is calculated. Type in formula with correct cell ranges. Reduce the number of decimal places. Is this a strong, moderate or weak correlation?
- Slides: 8