
Analyze Scatterplots CORRELATION COEFFICIENT Learning Goal 2 for


- Slides: 17
Analyze Scatterplots CORRELATION COEFFICIENT
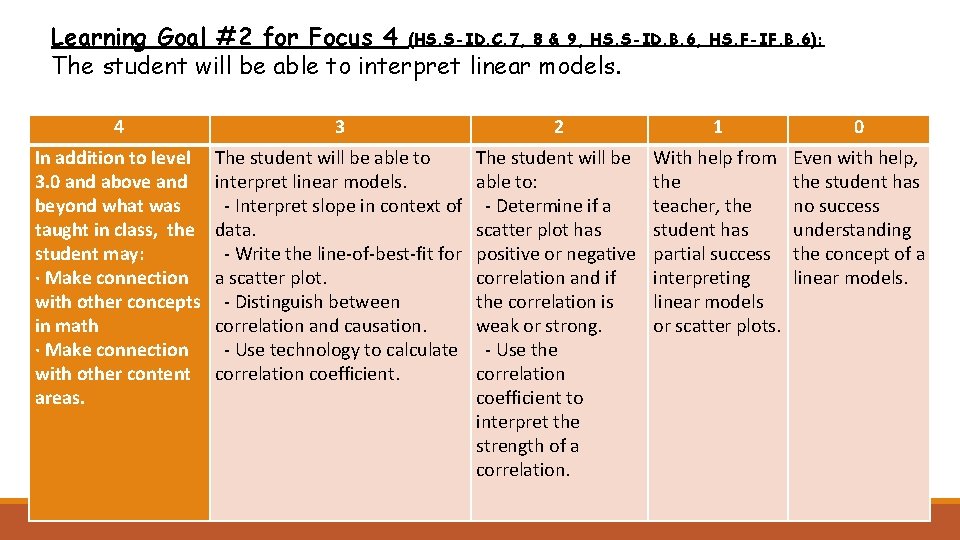
Learning Goal #2 for Focus 4 (HS. S-ID. C. 7, 8 & 9, HS. S-ID. B. 6, HS. F-IF. B. 6): The student will be able to interpret linear models. 4 3 2 1 0 In addition to level 3. 0 and above and beyond what was taught in class, the student may: · Make connection with other concepts in math · Make connection with other content areas. The student will be able to interpret linear models. - Interpret slope in context of data. - Write the line-of-best-fit for a scatter plot. - Distinguish between correlation and causation. - Use technology to calculate correlation coefficient. The student will be able to: - Determine if a scatter plot has positive or negative correlation and if the correlation is weak or strong. - Use the correlation coefficient to interpret the strength of a correlation. With help from the teacher, the student has partial success interpreting linear models or scatter plots. Even with help, the student has no success understanding the concept of a linear models.
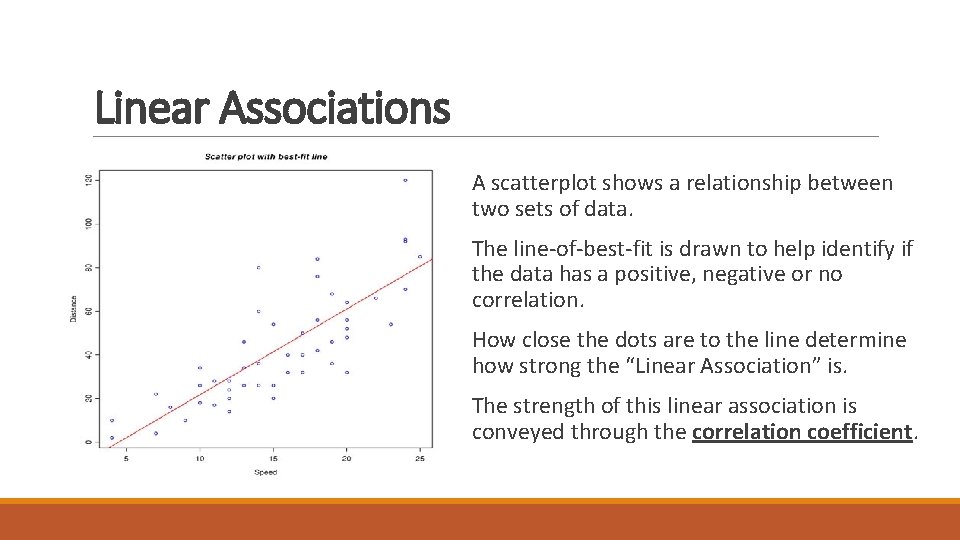
Linear Associations A scatterplot shows a relationship between two sets of data. The line-of-best-fit is drawn to help identify if the data has a positive, negative or no correlation. How close the dots are to the line determine how strong the “Linear Association” is. The strength of this linear association is conveyed through the correlation coefficient.
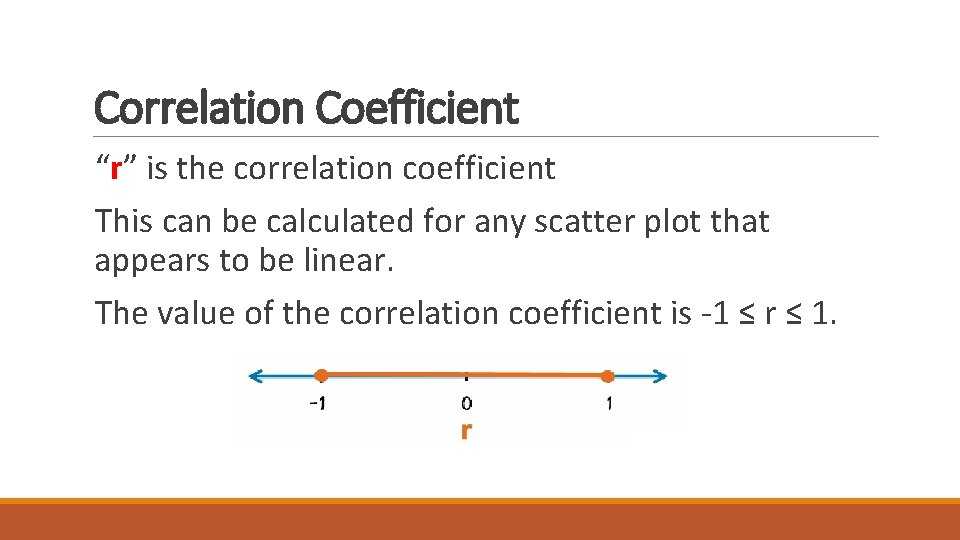
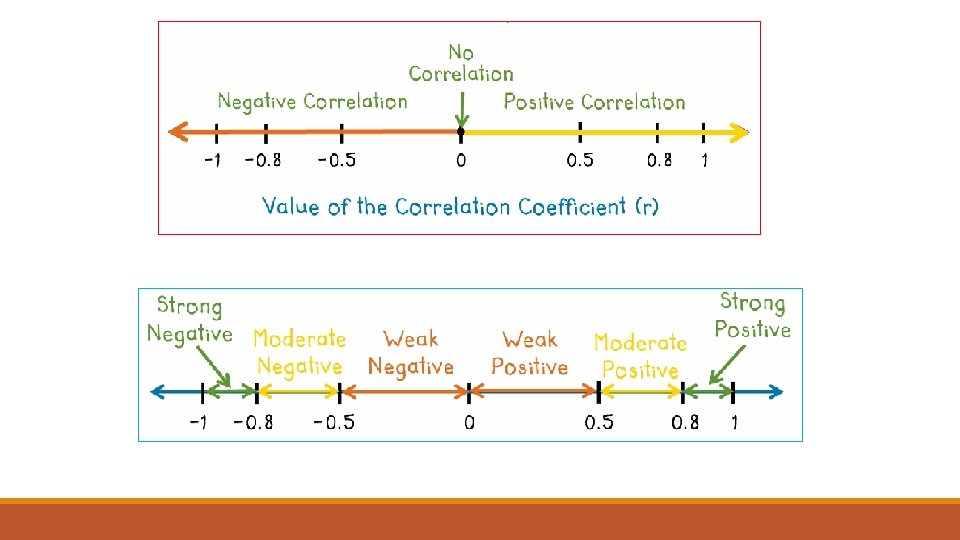
Correlation Coefficient “r” is the correlation coefficient This can be calculated for any scatter plot that appears to be linear. The value of the correlation coefficient is -1 ≤ r ≤ 1.
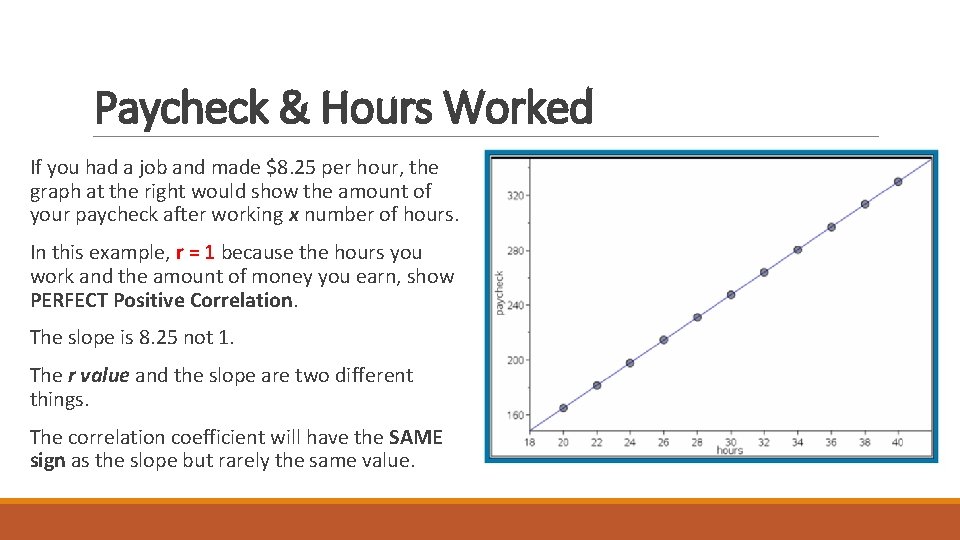
Paycheck & Hours Worked If you had a job and made $8. 25 per hour, the graph at the right would show the amount of your paycheck after working x number of hours. In this example, r = 1 because the hours you work and the amount of money you earn, show PERFECT Positive Correlation. The slope is 8. 25 not 1. The r value and the slope are two different things. The correlation coefficient will have the SAME sign as the slope but rarely the same value.
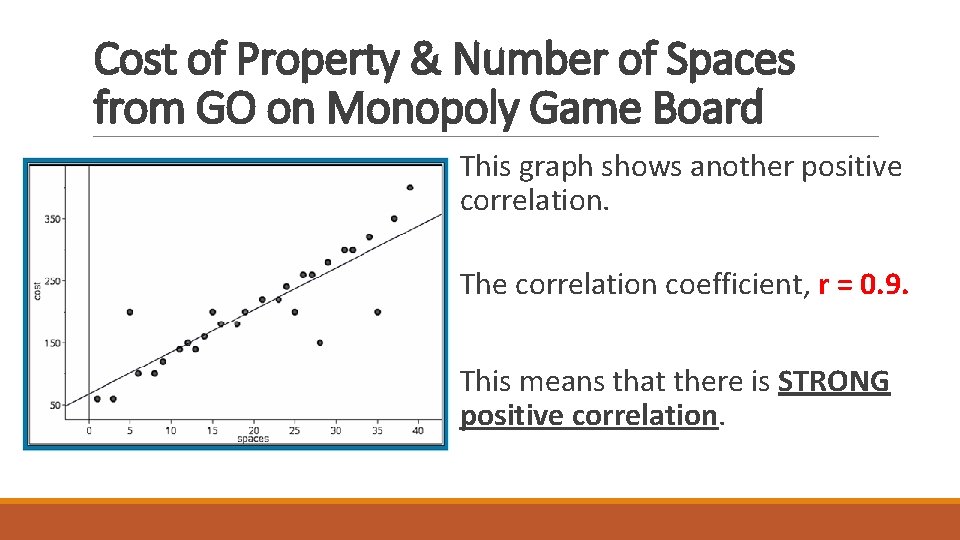
Cost of Property & Number of Spaces from GO on Monopoly Game Board This graph shows another positive correlation. The correlation coefficient, r = 0. 9. This means that there is STRONG positive correlation.
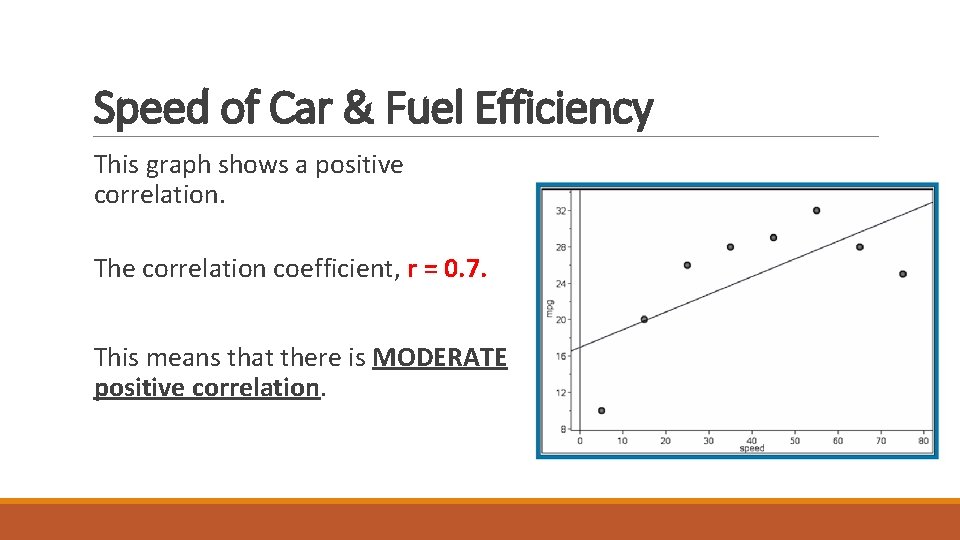
Speed of Car & Fuel Efficiency This graph shows a positive correlation. The correlation coefficient, r = 0. 7. This means that there is MODERATE positive correlation.
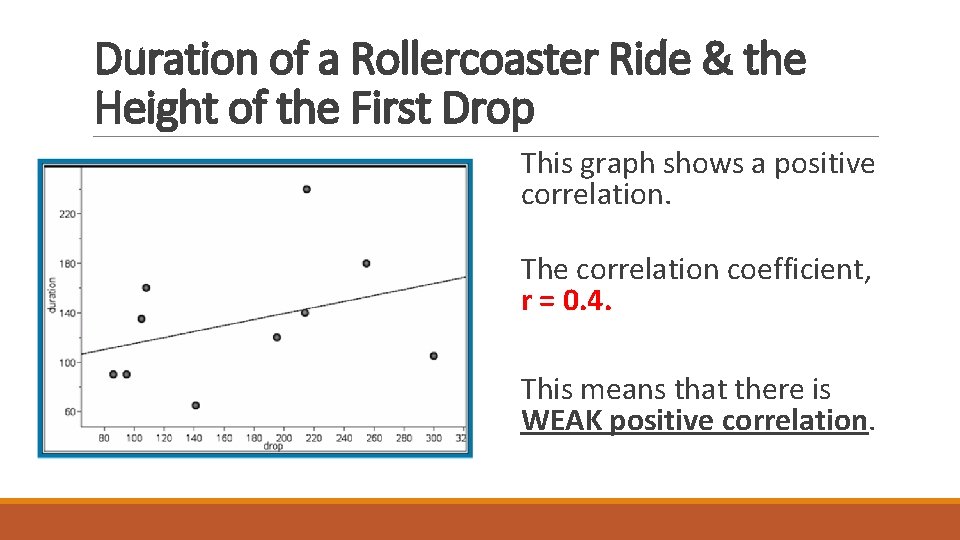
Duration of a Rollercoaster Ride & the Height of the First Drop This graph shows a positive correlation. The correlation coefficient, r = 0. 4. This means that there is WEAK positive correlation.
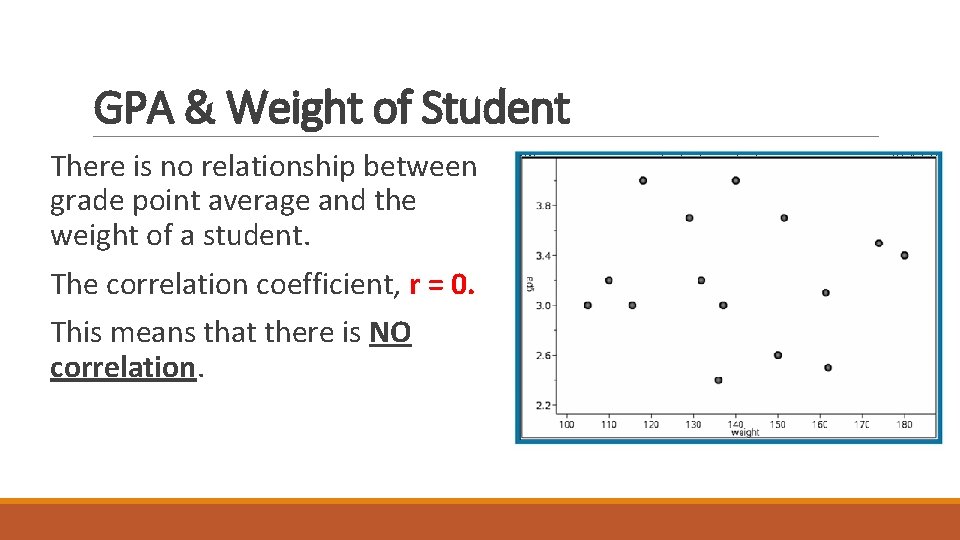
GPA & Weight of Student There is no relationship between grade point average and the weight of a student. The correlation coefficient, r = 0. This means that there is NO correlation.
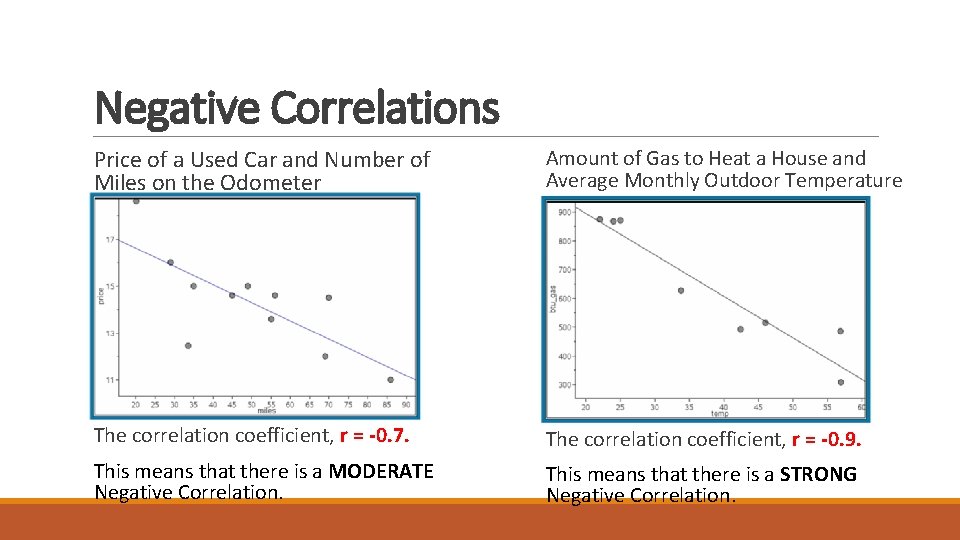
Negative Correlations Price of a Used Car and Number of Miles on the Odometer Amount of Gas to Heat a House and Average Monthly Outdoor Temperature The correlation coefficient, r = -0. 7. The correlation coefficient, r = -0. 9. This means that there is a MODERATE Negative Correlation. This means that there is a STRONG Negative Correlation.
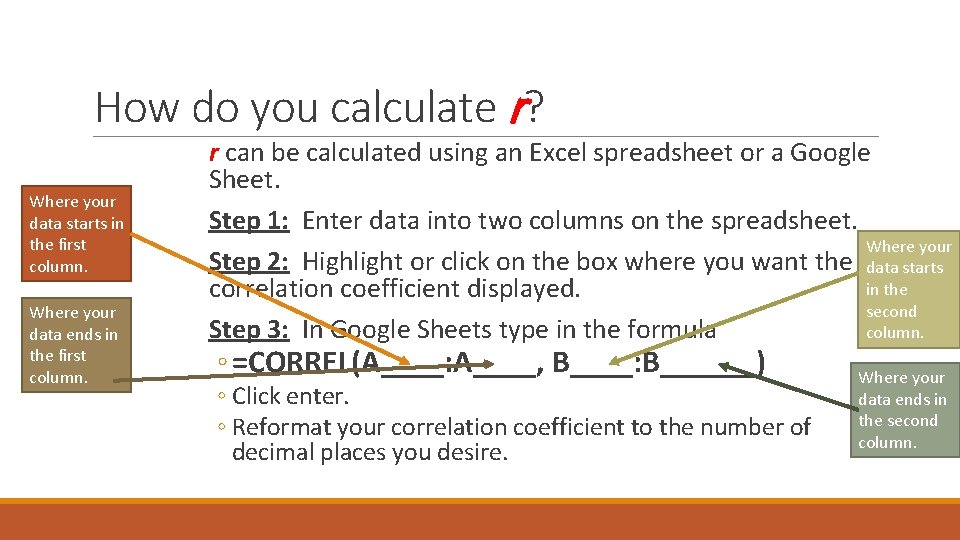
How do you calculate r? Where your data starts in the first column. Where your data ends in the first column. r can be calculated using an Excel spreadsheet or a Google Sheet. Step 1: Enter data into two columns on the spreadsheet. Where your Step 2: Highlight or click on the box where you want the data starts in the correlation coefficient displayed. second Step 3: In Google Sheets type in the formula column. ◦ =CORREL(A____: A____, B____: B______) ◦ Click enter. ◦ Reformat your correlation coefficient to the number of decimal places you desire. Where your data ends in the second column.
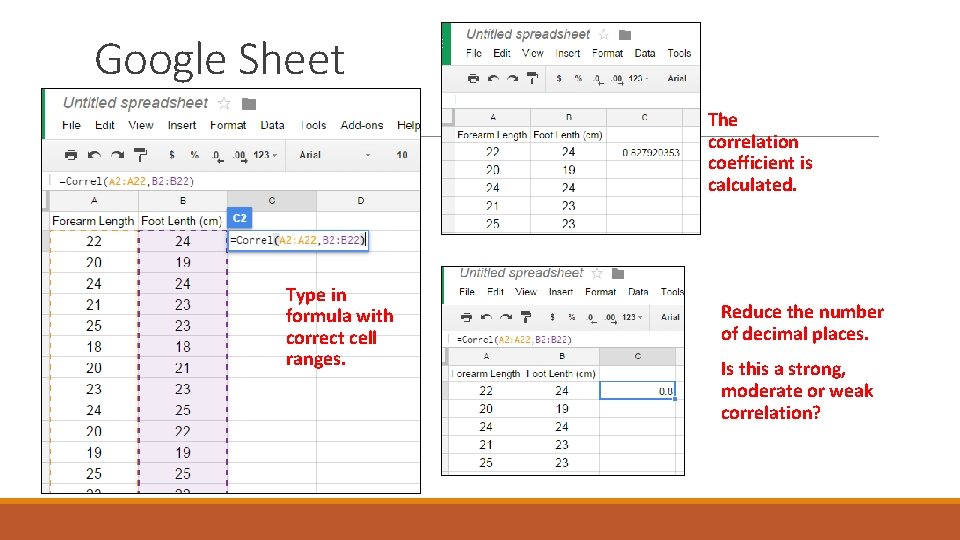
Example: How strong of a relationship is there between the length of your forearm and the length of your foot in centimeters? Forearm Length (cm) Foot Length (cm) 22 24 20 19 24 24 21 23 25 23 18 18 20 21 23 23 24 25 20 22 19 19 25 25 23 22 22 23 24 24 20 21 18 19 24 23 24 27 21 24 22 22 Enter the data into a Google Sheet.
Google Sheet The correlation coefficient is calculated. Type in formula with correct cell ranges. Reduce the number of decimal places. Is this a strong, moderate or weak correlation?
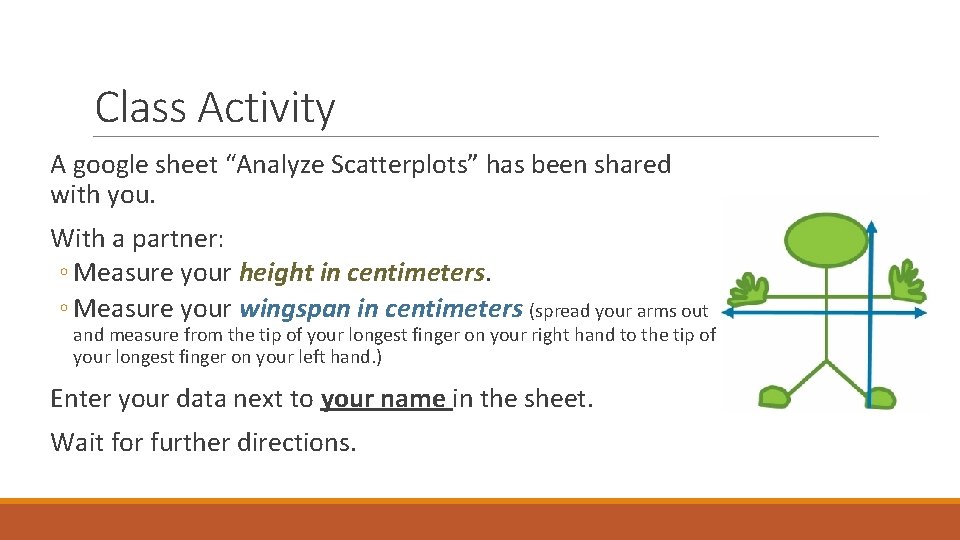
Class Activity A google sheet “Analyze Scatterplots” has been shared with you. With a partner: ◦ Measure your height in centimeters. ◦ Measure your wingspan in centimeters (spread your arms out and measure from the tip of your longest finger on your right hand to the tip of your longest finger on your left hand. ) Enter your data next to your name in the sheet. Wait for further directions.
Class Activity (continued) After all the data has been entered… Save a copy of the spreadsheet to your Google Drive. Calculate the correlation coefficient. Was the correlation coefficient strong, moderate or weak? Positive or negative?
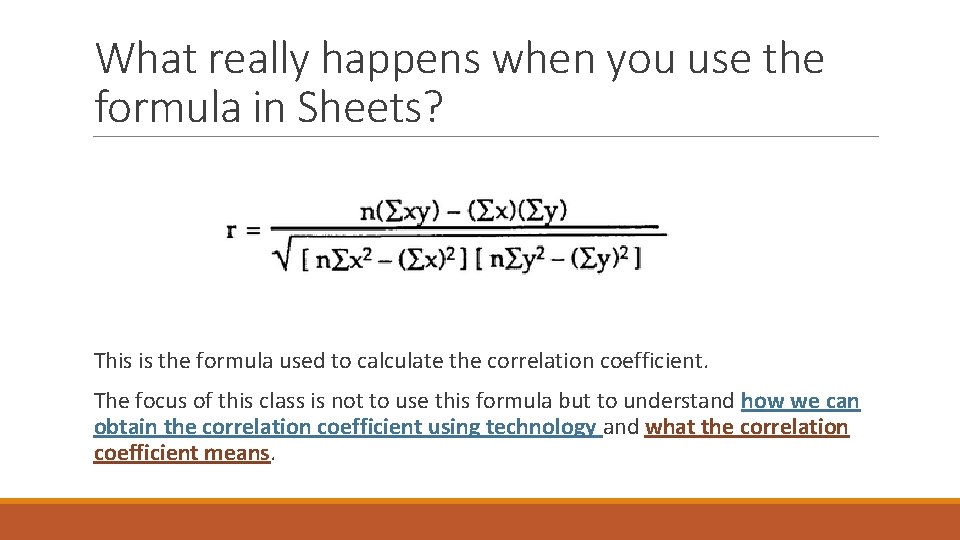
What really happens when you use the formula in Sheets? This is the formula used to calculate the correlation coefficient. The focus of this class is not to use this formula but to understand how we can obtain the correlation coefficient using technology and what the correlation coefficient means.