Unit 5 Spectroscopic Techniques Unit 5 Spectroscopic Techniques

![Unit 5: Spectroscopic Techniques A] UV-Visible Spectroscopy ■ Introduction, ■ Interaction of electromagnetic radiation](https://slidetodoc.com/presentation_image_h2/cf5830f5d900f348ca82ea09149189d0/image-2.jpg "Unit 5: Spectroscopic Techniques A] UV-Visible Spectroscopy ■ Introduction, ■ Interaction of electromagnetic radiation")

 in a wide variety of ways.")


 Chromophore 2) Auxochrome 3) Bathochromic Shift 4)")

 Non conjugated alkene shows an intense absorption below 200")

Bathochromic shift (Red Shift) • When absorption maxima (λmax ) of a compound shifts")
 • When absorption maxima (λmax ) of a compound shifts")
 Hyperchromic Effect • When absorption intensity (ε) of a compound is increased, it")
 Hypochromic Effect • When absorption intensity (ε) of a compound is decreased, it")
 Red shift i ax Wavelength (A )")

 a orbital (c) (T* orbital (b) n orbital (d)")

 are")


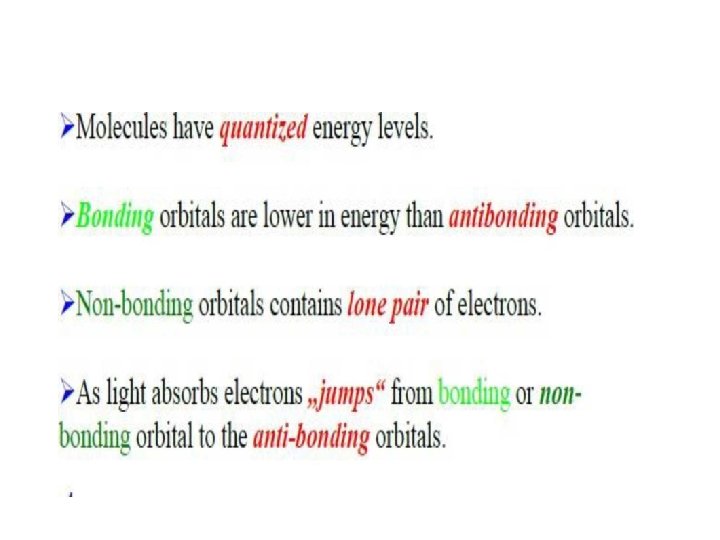
 p* (anti-bonding) n (non-bonding) p (bonding) s (bonding)")
 Qualitative Analysis - the UV- Visible spectrum of an")
 Chemical kinetics - as Absorbance is directly proportional to concentration of reactant or")
 light organic molecule (excited state) relaxation")
 Spectroscopy □ IR deals with the interaction of infrared radiation with matter.")

12800 -4000 cm-1 (0. 8 to 2. 5µ) •")

 Stretching vibrations: these are characterized by change in inter-nuclear distance. The distance between")
 Bending Vibrations These are characterized by a change in the angle betweentwo covalent")
 scissoring rocking stretching (valence bond vibrations) symmetrical asymmetrical")


 Determination of structure & functional groupa) b) Determination of")
 Study of kinetics of chemical reaction - a comparison between IR spectra of")
 Distinction between intermolecular and intramolecular hydrogen bonding- IR spectroscopy can also intermolecular and")
 Study of Isomerism : Keto-enol tautomerism can be studied by IR spectra shows")
 Determination of size of ring of ketones : Ring strains in cyclic ketones")


:")
- Slides: 66
Unit 5: Spectroscopic Techniques
Unit 5: Spectroscopic Techniques A] UV-Visible Spectroscopy ■ Introduction, ■ Interaction of electromagnetic radiation with matter ■ Statement of Beer’s law and Lambert’s law, ■ Absorption of UV radiation by organic molecule leading to different electronic transitions, ■ Terms involved in UV-visible spectroscopychromophore, auxochrome, bathochromic shift, hypsochromic shift, hyperchromic shift and hypochromic shift, ■ Instrumentation and basic principle of single beam spectrophotometer, ■ Applications of UV-visible spectroscopy. B] Infra red Spectroscopy: • Introduction, • Principle of IR Spectroscopy, • Types of vibrations: Stretching (symmetric & asymmetric) and bending (scissoring, rocking, wagging and twisting), Conditions of absorption of IR radiations, Instrumentation with block diagram Applications of IR spectroscopy • • •
• Spectroscopy is the branch of science that deals with the study of interaction of electromagnetic radiation with matter. • Spectroscopic methods of analysis are based on measurement of the electromagnetic radiation emitted or absorbed by the sample. • Therefore the physical and chemical properties of the substance directly related with their structure. • Electromagnetic radiation consists of discrete packets of energy which is called Photon.
Atoms and molecules interact with electromagnetic radiation (EMR) in a wide variety of ways. Atoms and molecules may absorb and/or emit EMR. Absorption of EMR stimulates different types of motion in atoms and/or molecules. The patterns of absorption (wavelengths absorbed and to what extent) and/or emission (wavelengths emitted and their respective intensities) are called 'spectra'. Spectroscopy is the interaction of EMR with matters to get spectra , which gives information like, bond length, bond angle, geometry and molecular structure.
Electromagnetic radiation displays the properties of both particles and waves. The particle component is called a photon. The term "photon" is implied to mean a small, massless particle that contains a small wavepacket of EM radiation/light. The energy (E) component of a photon is proportional to the frequency. Where h is Planck's constant and u is the frequency in Hertz (cycles per second). E = hʋ λ= distance of between two crests or peaks (A/ nm) ʋ= frequency: waves per unit time (sec-1, Hz) c = speed of light (3. 0 x 108 m • sec-1) h = Plank's constant (6. 63 x 10 -34 J • sec)
Because the speed of light, c, is constant, the frequency, n, (number of cycles of the wave per second) can complete in the same time, must be inversely proportional to how long the oscillation is, or wavelength: Because the atomic particles in matter also exhibit wave and particle properties, EM radiation can interact with matter in two ways: • Collision - particle-to-particle - energy is lost as heat and movement. • Coupling - the wave property of the radiation matches the wave property of the particle and "couple" to the next higher quantum mechanical energy level
Electromagnetic spectrum
UV-Visible Spectroscopy • Principle of UV-Visible spectroscopy • UV-Visible radiations are energetic electromagnetic radiations, that brings about electronic excitations. Therefore UV-Visible spectroscopy is also known as electronic spectroscopy. • Electronic excitations are accompanied by vibrational and rotational changes that results in relatively broad spectra. • Absorption spectra is a graph of absorption i. e. amount of light absorbed verses wave length of light. • Information derived from absorption spectra is useful in determination of structure of molecule • Principle of UV-Visible spectroscopy is based on Lambert's and Beer’s law.
Lambert's law. The rate of decrease in intensity of incident light is directly proportional to the thickness of solution when concentration is kept constant. Mathematical Expression is, -d. I/Io ἀ dx Beer, s law. The rate of decrease in intensity of incident light is directly proportional to the concentration of the solution when thickness of solution is kept constant. Mathematical Expression is, -d. I/Io ἀ dc
Types of Spectroscopy • 1. Absorption spectroscopy • 2. Emission spectroscopy • Solvent used in Spectroscopy - ethyl alcohol, hexane, water as these solvents do not absorb UV region Beckman DU 640 UV/Visible spectrophotometer. wm*'-
UV Spectroscopy- Principle, Instrumentation, Applications Spectroscopy is the measurement and interpretation of electromagnetic radiation absorbed or emitted when the molecules or atoms or ions of a sample moves from one energy state to another energy state. UV spectroscopy is type of absorption spectroscopy in which light of ultra-violet region (200 -400 nm) is absorbed by the molecule which results in the excitation of the electrons from the ground state to higher energy state. Principle of UV Spectroscopy Basically, spectroscopy is related to the interaction of light with matter. As light is absorbed by matter, the result is an increase in the energy content of the atoms or molecules. When ultraviolet radiations are absorbed, this results in the excitation of the electrons from the ground state towards a higher energy state. Molecules containing π-electrons or non-bonding electrons (n-electrons) can absorb energy in the form of ultraviolet light to excite these electrons to higher anti-bonding molecular orbitals. The more easily excited the electrons, the longer the wavelength of light it can absorb. There are four possible types of transitions (π–π*, n–π*, σ–σ*, and n–σ*), and they can be ordered as follows: σ–σ* > n–σ* > π–π* > n–π* The absorption of ultraviolet light by a chemical compound will produce a distinct spectrum which aids in the identification of the compound.
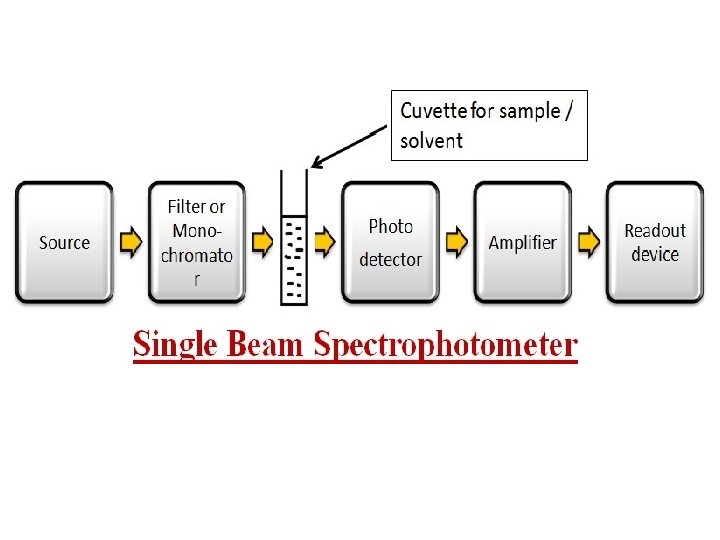
Instrumentation of UV Spectroscopy Light Source Tungsten filament lamps and Hydrogen-Deuterium lamps are most widely used and suitable light source as they cover the whole UV region. Tungsten filament lamps are rich in red radiations; more specifically they emit the radiations of 375 nm, while the intensity of Hydrogen-Deuterium lamps falls below 375 nm. Monochromators generally is composed of prisms and slits. Most of the spectrophotometers are double beam spectrophotometers. The radiation emitted from the primary source is dispersed with the help of rotating prisms. Sample and reference cells One of the two divided beams is passed through the sample solution and second beam is passé through the reference solution. Both sample and reference solution are contained in the cells. These cells are made of either silica or quartz. Glass can’t be used for the cells as it also absorbs light in the UV region.
Detector Generally two photocells serve the purpose of detector in UV spectroscopy. One of the photocell receives the beam from sample cell and second detector receives the beam from the reference. The intensity of the radiation from the reference cell is stronger than the beam of sample cell. This results in the generation of pulsating or alternating currents in the photocells. Amplifier The amplifier is used if signal is weak. Recording devices It records the results in the form of graph. Most of the time amplifier is coupled to a pen recorder which is connected to the computer. Computer stores all the data generated and produces the spectrum of the desired compound.
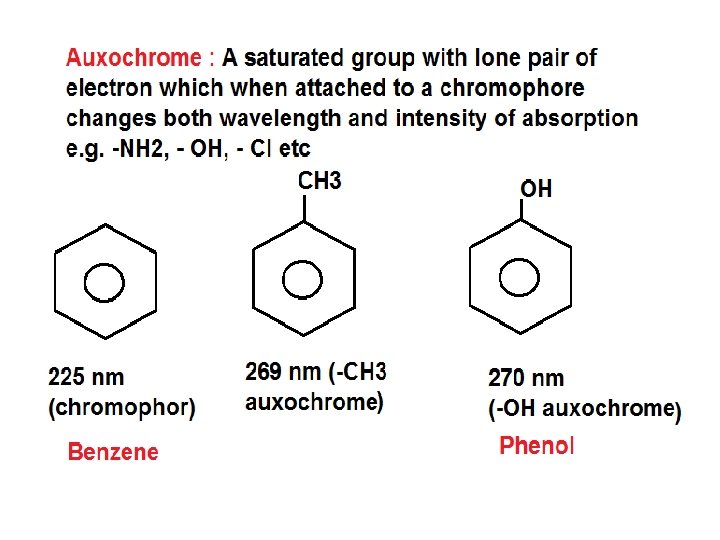
• Terms in UV-Visible spectroscopy: 1) Chromophore 2) Auxochrome 3) Bathochromic Shift 4) Hypsochromic Shift 5) Hyperchromic Shift 6) Hypo. Chromic Shift 1) Chromophore • A chromophore is the part of a molecule responsible for its color. The color arises when a molecule absorbs certain wavelengths of visible light and transmits or reflects others. • A covalently unsaturated group responsible for electronic absorption in UV-visible region is called chromophore. • E. g. C=C, C=O, N=O etc • Compounds containing chromophore are called chromogen
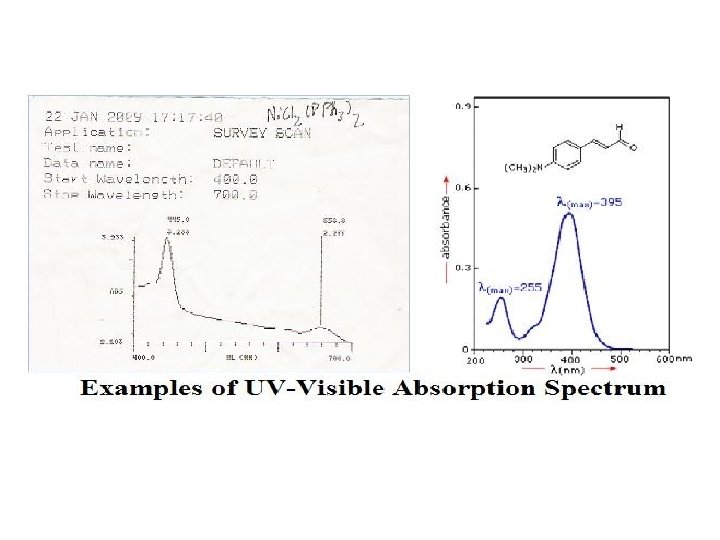
Examples of Chromophore Xmax = 497 nm |. -cnrotenc Endo P- Carotene Xmax = 505 nm
• • • 1) Non conjugated alkene shows an intense absorption below 200 nm and therefore inaccessible to UV spectrum e. g. ethylene (CH 2=CH 2 ) is 171 nm. 2) Non conjugated carbonyl group of compound gives weak absorption band in the 200 to 300 nm region. E. g. Acetone Xmax = 279 nm ; cyclohexanone Xmax = 291 nm. 3) double bonds in conjugation, Xmax shifted to longer wave length. E. g. 1, 5 hexadiene Xmax = 178 nm ; CH 2=CH-CH 2 -CH=CH 2 2, 4 hexadiene Xmax = 227 nm , CH 3 -CH=CH- CH 3 4) conjugation of C=C and carbonyl group shifts the max of both groups to longer wavelength. e. g.
3)Bathochromic shift (Red Shift) • When absorption maxima (λmax ) of a compound shifts to longer wavelength it is known as bathochromic shift or red shift. • This is due to the presence of auxochrome or change of solvent. • E. g. auxochrome group like -OH, -OCH 3
Hypsochromic Shift (Blue Shift) • When absorption maxima (λmax ) of a compound shifts to shorter wavelength it is known as hypsochromic shift or blue shift. • Aniline shows blue shift in acidic medium, it loses conjugation.
4) Hyperchromic Effect • When absorption intensity (ε) of a compound is increased, it is known as hyperchromic shift. • If auxochrome introduces to the compound, the intensity of absorption increases.
5) Hypochromic Effect • When absorption intensity (ε) of a compound is decreased, it is known as hypochromic shift. Naphthalene ε = 19000 2 -methyl naphthalene ε = 10250
Shifts and Effects Hyperchromic shift Absorbance (A) Red shift i ax Wavelength (A )
Electronic Transitions • When energy is absorbed by a molecule in UVVisible region, it brings changes in electronic energy of molecule because of transition of valence electrons from lower energy to higher energy. Three types of electrons are involved in organic molecule. σ - electron– from σ Bond π - electron – from π bond n – electron - lone pair of electron
Sigma and Pi orbitals (a) a orbital (c) (T* orbital (b) n orbital (d) n * orbital
s ® s* Transitions An electron in a bonding s orbital is excited to corresponding antibonding orbital. The energy required is large. For example, methane (which has only C-H bonds, and can only undergo s ® s* transitions) shows an absorbance maximum at 125 nm. Absorption maxima due to s ® s* transitions are not seen in typical UV-VIS spectra (200 700 nm)
n ® s* Transitions Saturated compounds containing atoms with lone pairs (non-bonding electrons) are capable of n ® s* transitions. These transitions usually need less energy than s ® s * transitions. They can be initiated by light whose wavelength is in the range 150 - 250 nm. The number of organic functional groups with n ® s* peaks in the UV region is small.
n ® p* and p ® p* Transitions Most absorption spectroscopy of organic compounds is based on transitions of n or p electrons to the p* excited state. These transitions fall in an experimentally convenient region of the spectrum (200 - 700 nm). These transitions need an unsaturated group in the molecule to provide the p electrons.
The order of energy required for electronic transition is s ® s* > π → π* > n →σ* > n → π* σ → π* and π →σ* transitions are forbidden s ® s* shows absorption at near UV
s* (anti-bonding) p* (anti-bonding) n (non-bonding) p (bonding) s (bonding)
APPLICATIONS OF UV-VISIBLE SPECTROPHOTOMETRY 1) Qualitative Analysis - the UV- Visible spectrum of an unknown organic compound is compared with the spectra of various known compounds for identification of that compound. 2) Quantitative Analysis - based on Beer’s law A α C
3) Chemical kinetics - as Absorbance is directly proportional to concentration of reactant or product, with the progress of reaction the change in extent of absorption per minute can help to study the kinetics of the chemical reactions. 4) Structural Information - As λmax is the characteristic value for different chromophores and chromophore-auxochrome the structural parts in organic molecules, spectrum gives the structural information of the unknown compound. 5) Dissociation constant of Weak Acid or Weak base 6) Detection of impurities 7) Food safety analysis 8) Blood analysis 9) DNA/RNA Conc. analysis 10) Residual Pesticide analysis 11) Residual chlorine analysis
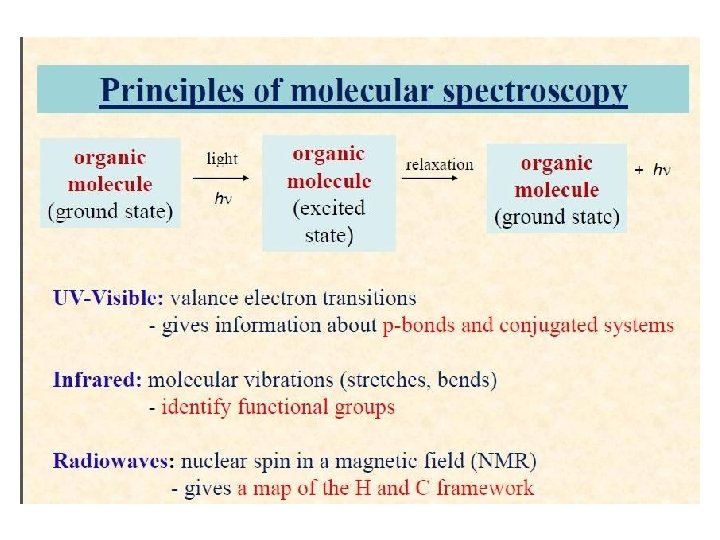
Principles of molecular spectroscopy organic molecule (ground state) light organic molecule (excited state) relaxation -► organic + molecule (ground state) hv UV-Visible: valance electron transitions gives information about p-bonds and conjugated systems Infrared: molecular vibrations (stretches, bends) - identify functional groups Radiowaves: nuclear spin in a magnetic field (NMR) - gives a map of the H and C framework
Infrared (IR) Spectroscopy □ IR deals with the interaction of infrared radiation with matter. The IR spectrum of a compound can provide important information about its chemical nature and molecular structure. □ Most commonly, the spectrum is obtained by measuring the absorption of IR radiation, although infrared emission and reflection are also used. □Widely applied in the analysis of organic materials, also useful for polyatomic inorganic molecules and for organometallic compounds.
Principle of IR spectroscopy ■ Molecules has number of vibrational energy levels. Atoms in the molecule vibrate in different ways when molecule interact with IR radiation. ■ If molecule absorbs IR radiation, it gets excited to higher vibrational energy level. ■ The type of IR wavelength absorbed by the molecule depends on type of atoms and chemical bonds in the molecule and accordingly, IR spectrum is obtained.
• Near IR Region: 1)12800 -4000 cm-1 (0. 8 to 2. 5µ) • Middle IR Region: 1)4000 - 667 cm-1 (2. 5 to 15µ) • Far IR Region: • 667 - 50 cm-1 ( 15 to 200µ)
Types of vibrations: Molecule consisting of atoms that are bonded by covalent bonds which is not rigid. Covalent bonds between atoms are elastic and behave like a spring. several covalent bonds in the molecule behave as molecular spring and are constantly vibrating with certain frequency. All vibrations fall into two basic categories 1) Stretching vibrations 2) Bending vibrations 1) Stretching vibrations: i. Symmetric stretching ii. Asymmetric stretching 2) Bending vibrations: i. Scissoring ii. Rocking iii. Wagging iv. Twisting
1) Stretching vibrations: these are characterized by change in inter-nuclear distance. The distance between two atoms increase or decrease but atoms remain in the same plane. i) Symmetric stretching vibration- These involve the movement of the atom with respect to a particular atom in a molecule in the same direction. ii) Asymmetric stretching vibrations - These involve the movement of the atom with respect to a particular atom in a molecule in the same plane but not in the same direction. stretching (valence bond vibrations): symmetrical stretching asymmetrical stretching
2) Bending Vibrations These are characterized by a change in the angle betweentwo covalent bonds, due to the change in the position of the atoms relative to the original band axis. These vibrations are four types : 1) Scissoring 2) Rocking 3) Wagging 4) Twisting The first two vibrations scissoring and rocking, occur in the plane while other two i. e. wagging and twisting, occur of the plane. i) Scissoring vibrations - These involve movement of two atoms in opposite directions i. e. towards each other or away from each other in the same plane. ii) Rocking vibrations: - These involve movement of the atoms in the same direction in the same plane. iii) Wagging vibrations : - These involve movement of atoms up the plane or below the plane with respect to central atom. These movements occur of plane. iv) Twisting vibrations : - These involve movement of one atom up and the other atom down the plane with respect to central atom. These movements also occur out of plane.
in-plane: molecular vibrations bending (deformation vibrations) scissoring rocking stretching (valence bond vibrations) symmetrical asymmetrical stretching out-of-plane: wagging twisting
Conditions of absorption of IR radiations: ■ Correct frequency of radiation: • Energy of IR radiation is insufficient to cause electronic excitation but can cause vibrational or rotational excitations in molecule. • When frequency of vibration of a bond and frequency of IR radiation used for excitation matches perfectly then only IR energy is absorbed. ■ Electric dipole: • A molecule can only absorbed IR radiation when its absorption causes a change in electric dipole moment. • Molecule must give rise to change in dipole moment due to absorption of IR radiation.
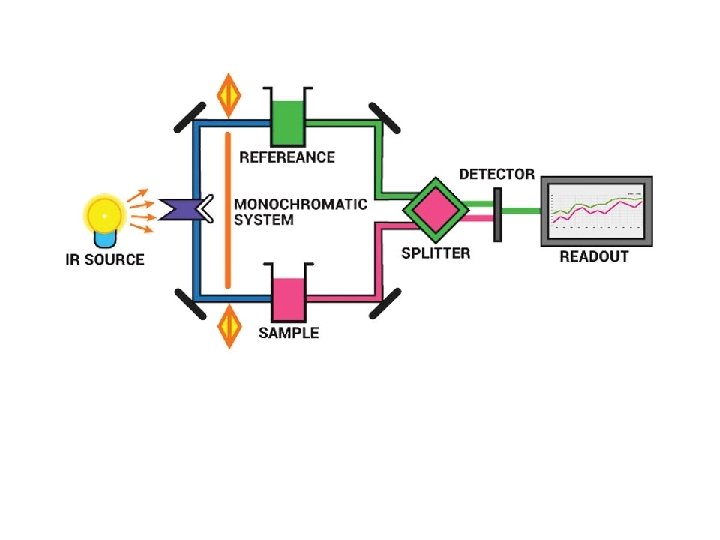
Instrumentation of IR spectroscopy: ■ ■ ■ Source Monochromator Sample cell Detector Amplifier & recorder
Source – IR instruments require a source of radiant energy which emit IR radiation which must be steady, intense enough for detection and extend over the desired wavelength. Various sources of IR radiations are as follows. Nernst glower Incandescent lamp Mercury arc Tungsten lamp Glober source Nichrome wire Sample Cell IR spectroscopy has been used for the characterization of solid, liquid or gas samples. i. Solid – Various techniques are used for preparing solid samples such as pressed pellet technique, solid run in solution, solid films, mull technique etc. ii. Liquid – Samples can be held using a liquid sample cell made of alkali halides. Aqueous solvents cannot be used as they will dissolve alkali halides. Only organic solvents like chloroform can be used. iii. Gas– Sampling of gas is similar to the sampling of liquids.
Monochromators – Various types of monochromators are prism, gratings and filters. Prisms are made of Potassium bromide, Sodium chloride or Caesium iodide. Filters are made up of Lithium Fluoride and Diffraction gratings are made up of alkali halides. Detectors are used to measure the intensity of unabsorbed infrared radiation. Detectors like thermocouples, Bolometers, thermisters, Golay cell, and pyroelectric detectors are used. Recordes. Recorders are used to record the IR spectrum.
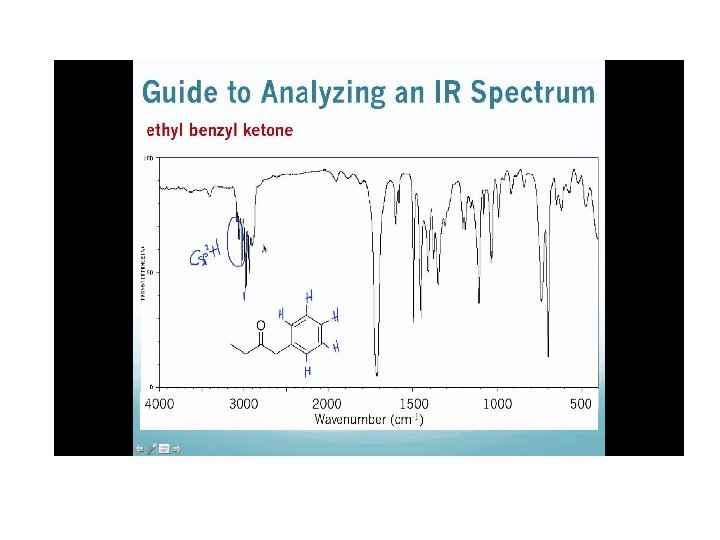
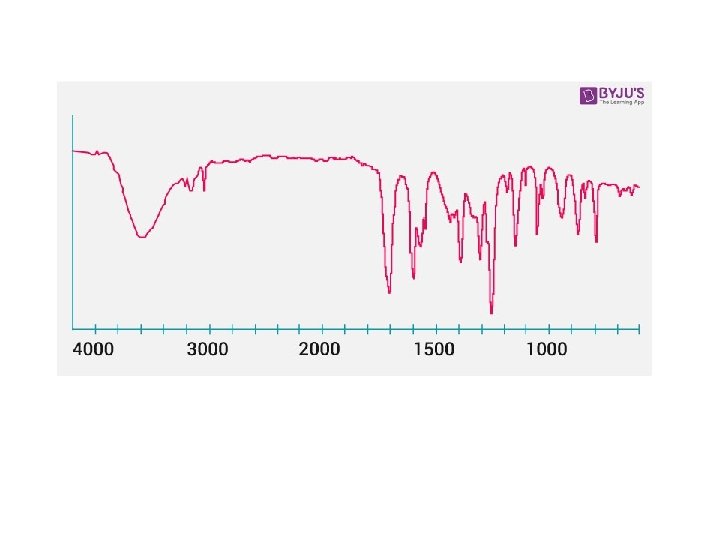
Parts of IR spectrum ■ The IR spectrum is basically a plot of transmitted (or absorbed) frequencies vs. intensity of the transmission (or absorption). ■ Frequencies appear on the x-axis in units of inverse centimetres i. e. cm-1 (wave numbers), and intensities are plotted on the y-axis in percentage units. ■ IR is most useful in providing information about the presence or absence of specific functional groups. ■ IR can provide a molecular fingerprint that can be used while comparing samples. ■ IR can provide information about aromatic substitution pattern.
Regions in IR spectrum • Middle IR Region • 4000 - 667 cm-1 (2. 5 to 15µ) • Divided into three sub regions as I. Functional group region: 4000 - 1500 cm-1 (2. 5 to 6. 5µ) II. Finger print region: 1500 - 909 cm-1 (6. 5 to 11µ) III. Aromatic region: 909 - 667 cm-1 (11 to 15µ)
Functional group region: ■ The region extends from: 4000 -1500 cm-1 ■ It contains absorption bands due to stretching vibrations of functional groups such as O-H, N-H, C-H etc.
Fingerprint region: ■ The region extends from: 1500 -909 cm-1 ■ It is the most complex part of IR spectrum. ■ The absorption bands in this region are due to stretching as well as bending vibrations. ■ This region is not useful for interpretation but can be used for identification of compounds.
Aromatic Region: ■ This region is useful for determination of aromatic character. ■ The absorption bands in this region provides information about aromatic substitution pattern such as ortho, meta and para substitution. ■ The absorption bands in this region are due to bending vibrations.
Applications of IR spectroscopy: I. Determination of structure & functional group. II. Study of kinetics of chemical reaction. III. Distinction between intra & inter molecular hydrogen bonding. IV. Detection of impurities. V. Study of isomerism. VI. Detection of size of ring ketones.
Application of IR Spectroscopy 1) Determination of structure & functional groupa) b) Determination of structure- In IR spectroscopy, almost all functional groups absorbs characteristic radiations within definite range. E. g. Strong absorption band between 1600 to 1900 cm-1 indicates the presence of carbonyl group. Further study of spectra decide whether it is aldehyde/ketone/ester/amide etc. Identification of functional structure- can be done by comparison with fingerprint region. Fingerprint region is below 1500 cm-1, which is reach in many absorptions which are cause by stretching and bending vibrations. Some molecules containing same functional group may show similar absorption above 1500 cm-1 in functional group region but their spectra differ in fingerprint region. The identity of compound can be done by comparing spectra of known compound.
2) Study of kinetics of chemical reaction - a comparison between IR spectra of reactants and products can help to determine the course of reaction. IR spectrum of cyclohexanol shows a strong band at about 3550 cm-1 which is characteristic of alcoholic OH group. For product cyclohexanone, this band disappears and a new band appears at 1710 cm-1 which is characteristic of ketone group. 3) Hydrogen Bonding- IR spectroscopy gives information regarding the hydrogen bonding. Bands due to hydrogen bonding appears at lower frequency. Eg: Aliphatic - OH free : 3650 cm-1 Aliphatic. OH hydrogen bonded : 3350 cm-1
4) Distinction between intermolecular and intramolecular hydrogen bonding- IR spectroscopy can also intermolecular and intramolecular hydrogen bonding. This is done by taking series of IR spectra of a compound at different dilutions. As dilution increases the absorption band due to intermolecular hydrogen bonding disappears while that of intramolecular hydrogen bonding remain unchanged. 5) Detection of impurities - IR spectra of impure sample will show extra absorption bands. By comparing IR spectra of pure compound, presence of impurities can be detected. Eg: Presence of cyclohexanone in cyclohexanol can be detected by presence of carbonyl absorption band.
6) Study of Isomerism : Keto-enol tautomerism can be studied by IR spectra shows characteristic absorption of carbonyl group for keto form whereas a broad -OH and C=C stretching frequencies for enol form.
7) Determination of size of ring of ketones : Ring strains in cyclic ketones shifts the carbonyl group stretching frequency to higher wavelength. Angle strain in rings causes carbonyl group to have more electron density and stiffer bonds. This enables to differentiate ring ketones. o o o II II II 1818 cm' ^ o o 1775 cm , -1 1740 cm , -1 1710 cm" 8) Miscellaneous application : i. Identification of atmospheric pollution. ii. Measurement of ethanol in breath can be detected by IR spectroscopy by a device called an intoximeter. iii. Measurements of paints and varnishes can be done by reflectance method where sample is irradiated by IR and reflected light is detected. This technique is used to identify the paints on appliances or automobiles without destroying surface. The technique can be used for identifying old paints and fake masterpieces. iv. In industry IR is used to determine impurity in raw material.
Questions: 7 M Question 1 2 3 Marks 7 Give principle of IR spectroscopy. Explain modes of vibrations with stretching and bending vibrations. Give principle of IR spectroscopy. Calculate possible number 7 of fundamental vibrations in CO 2, CH 4, H 2 O, C 6 H 6, NO, NH 3 ' What are the conditions of absorption of IR radiations by the molecule? Draw a block diagram of IR spectrophotometer. Explain any 4 components of IR spectrophotometer with their functions. 7 Blooms Level BL 2 BL 3 BL 2
Questions: 6 M Q. No. Question 1 Explain fundamental modes of vibrations with stretching and bending vibrations. 2 3 Explain how fundamental modes of vibrations of linear and non - linear molecules are calculated with examples. Give reasons: a) Methane does not absorb IR radiation b) HCl can undergo stretching vibrations only whereas CO 2 undergoes stretching as well as bending vibrations c) Fundamental modes of vibration for H 2 O are 3 Marks 6 Blooms Level BL 2 6 BL 3
Questions: 5 M Q. No. Question Marks Blooms Level 1 2 Explain any 5 applications of IR spectroscopy. 5 5 BL 1 BL 2 3 Give principle of IR spectroscopy. Explain Functional group 5 region and finger print region in IR spectrum. BL 2 What are the conditions of absorption of IR radiations by the molecule? Calculate possible number of fundamental vibrations in CH 4, H 2 O, C 6 H 6
List of reference books ✓ Basic Concepts of Analytical Chemistry (2 nd Ed. ): S. M. Khopkar : New Age- international Publisher. ✓ Instrumental Methods of Chemical analysis: G. R. Chatwal & S. K. Aanand: Himalaya Publication House. ✓ Spectroscopy of Organic compounds (2 nd Ed. ): P. S. Kalsi, New Age- international Publisher.