
Descriptive Epidemiology Dr KANUPRIYA CHATURVEDI How we view




- Slides: 89
Descriptive Epidemiology Dr. KANUPRIYA CHATURVEDI
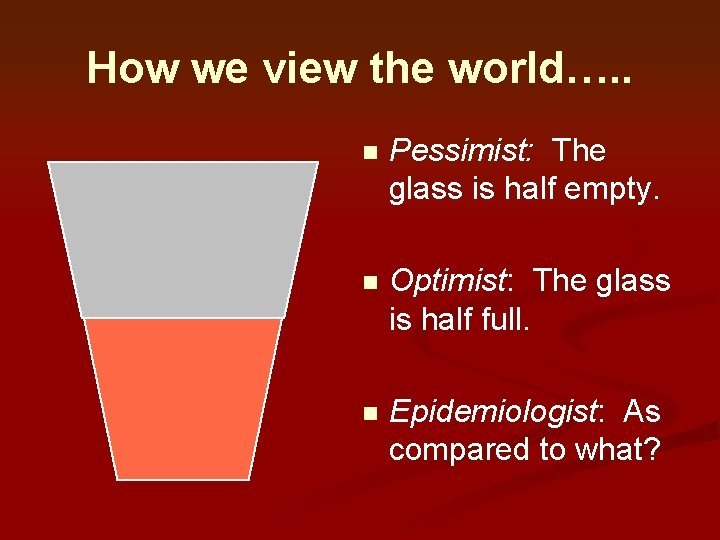
How we view the world…. . n Pessimist: The glass is half empty. n Optimist: The glass is half full. n Epidemiologist: As compared to what?
Epidemiology is. . .
Epidemiology is. . . n "The worst taught course in Medical school. " n Medical Student
Epidemiology is. . . n "The science of making the obvious obscure. " n Clinical Professor
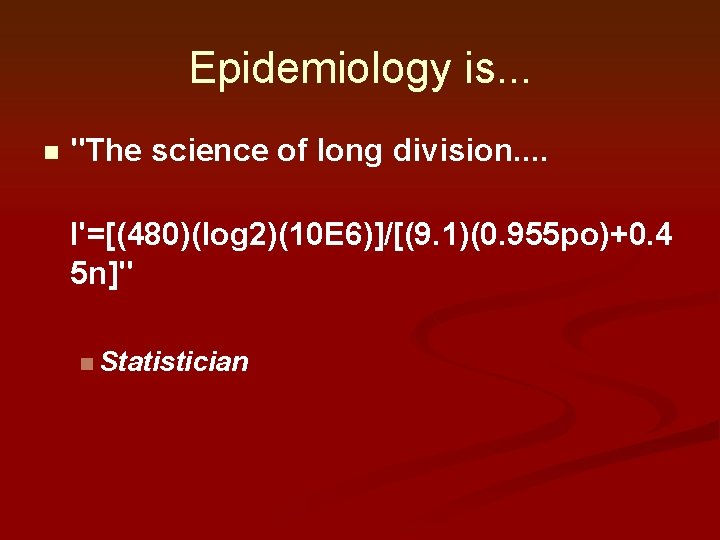
Epidemiology is. . . n "The science of long division. . I'=[(480)(log 2)(10 E 6)]/[(9. 1)(0. 955 po)+0. 4 5 n]" n Statistician
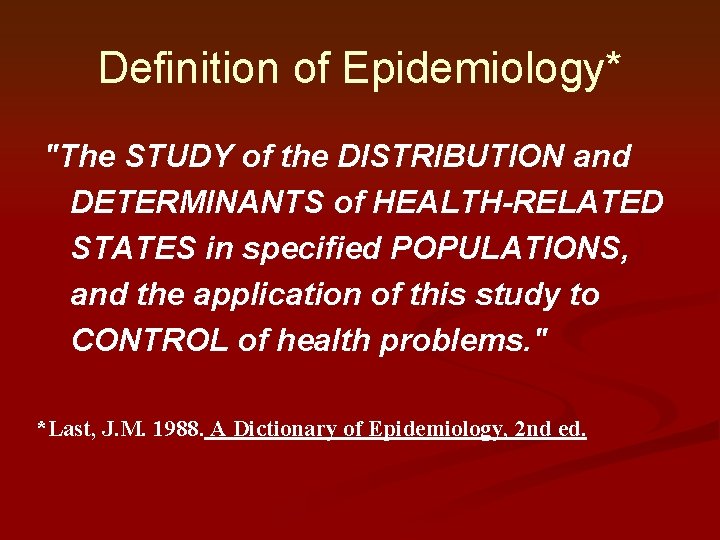
Definition of Epidemiology* "The STUDY of the DISTRIBUTION and DETERMINANTS of HEALTH-RELATED STATES in specified POPULATIONS, and the application of this study to CONTROL of health problems. " *Last, J. M. 1988. A Dictionary of Epidemiology, 2 nd ed.
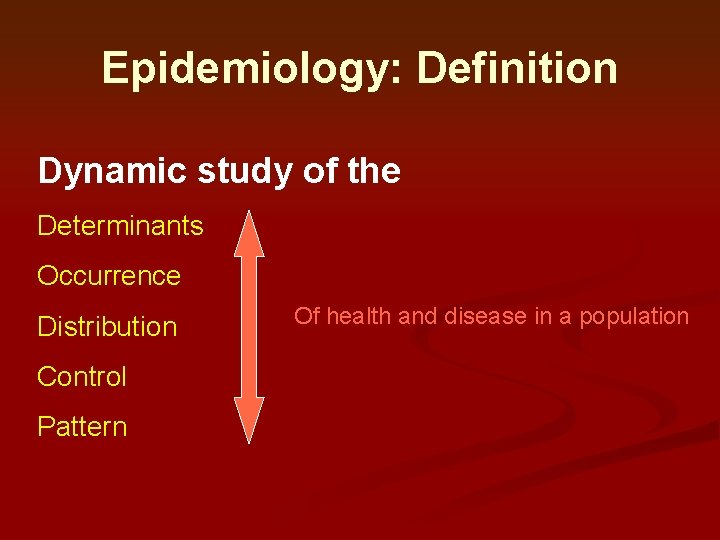
Epidemiology: Definition Dynamic study of the Determinants Occurrence Distribution Control Pattern Of health and disease in a population
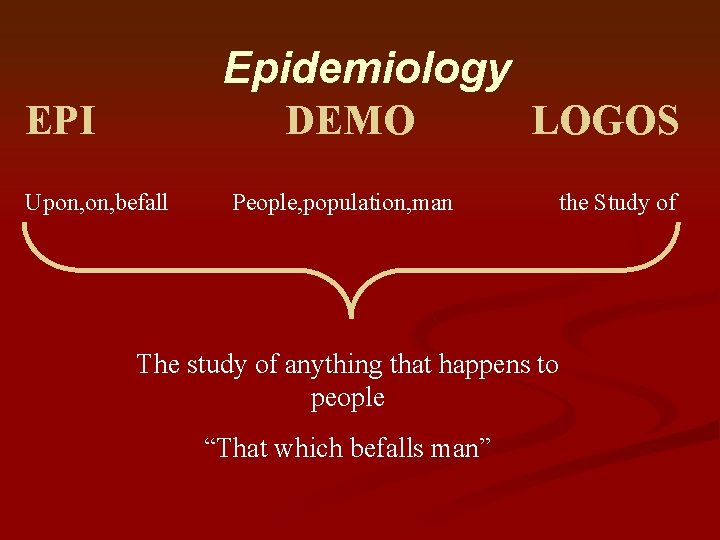
Epidemiology DEMO LOGOS EPI Upon, befall People, population, man the Study of The study of anything that happens to people “That which befalls man”
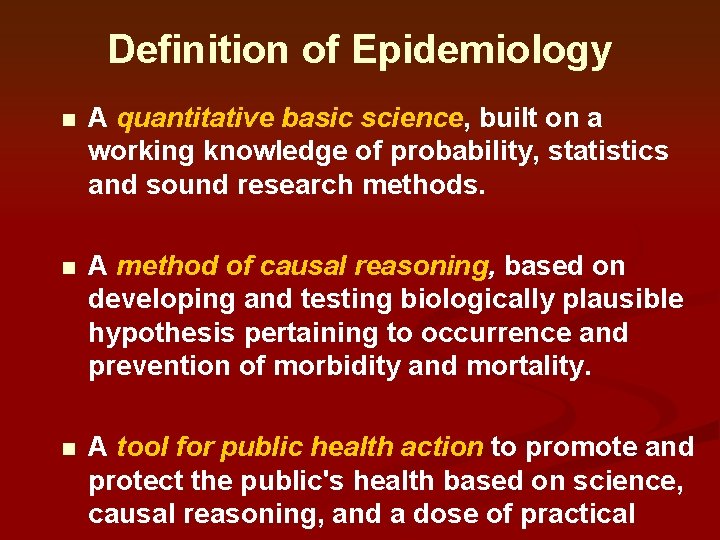
Definition of Epidemiology n A quantitative basic science, built on a working knowledge of probability, statistics and sound research methods. n A method of causal reasoning, based on developing and testing biologically plausible hypothesis pertaining to occurrence and prevention of morbidity and mortality. n A tool for public health action to promote and protect the public's health based on science, causal reasoning, and a dose of practical
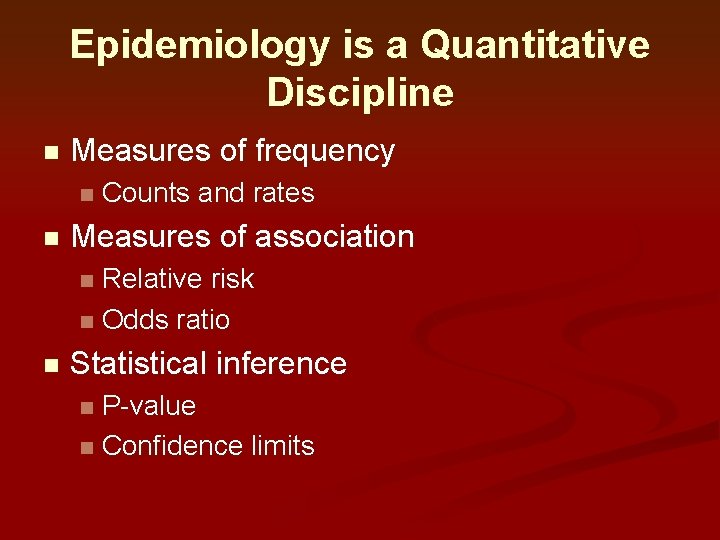
Epidemiology is a Quantitative Discipline n Measures of frequency n n Counts and rates Measures of association Relative risk n Odds ratio n n Statistical inference P-value n Confidence limits n
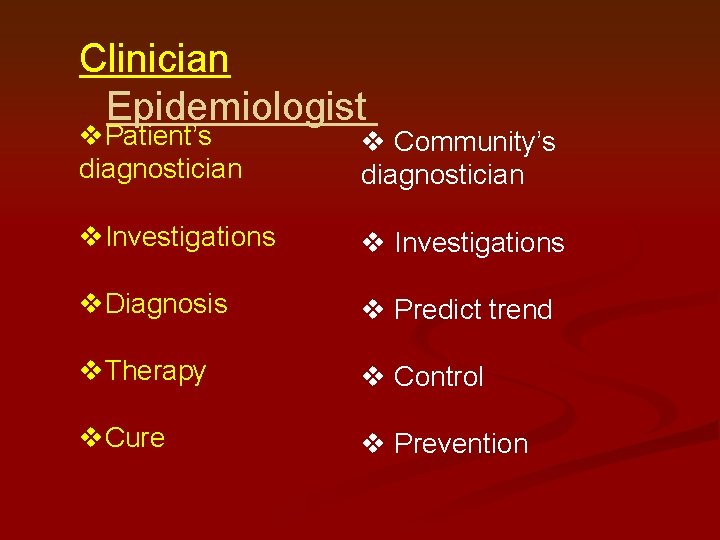
Clinician Epidemiologist v. Patient’s diagnostician v Community’s diagnostician v. Investigations v. Diagnosis v Predict trend v. Therapy v Control v. Cure v Prevention
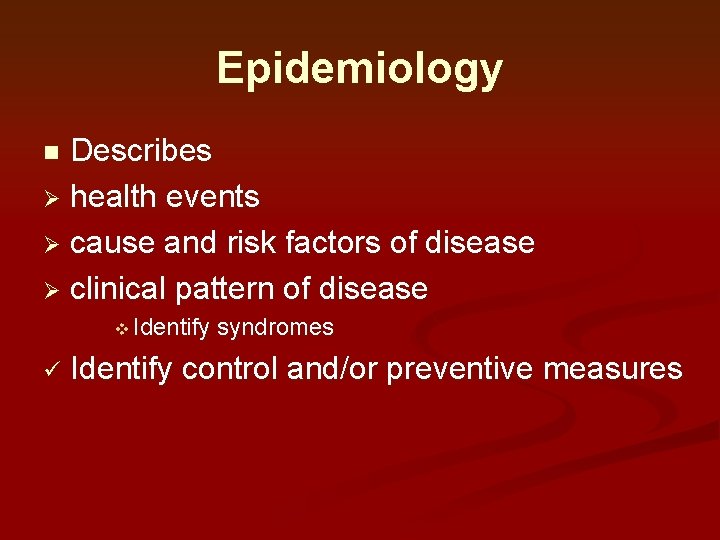
Epidemiology Describes Ø health events Ø cause and risk factors of disease Ø clinical pattern of disease n v Identify ü syndromes Identify control and/or preventive measures
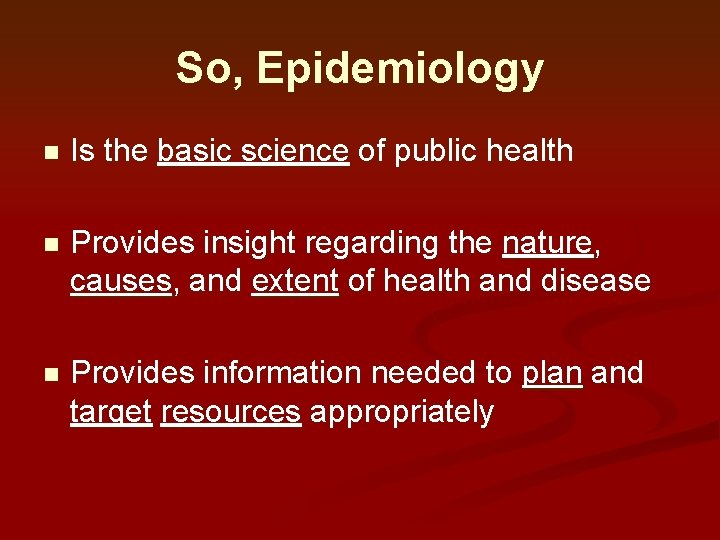
So, Epidemiology n Is the basic science of public health n Provides insight regarding the nature, causes, and extent of health and disease n Provides information needed to plan and target resources appropriately
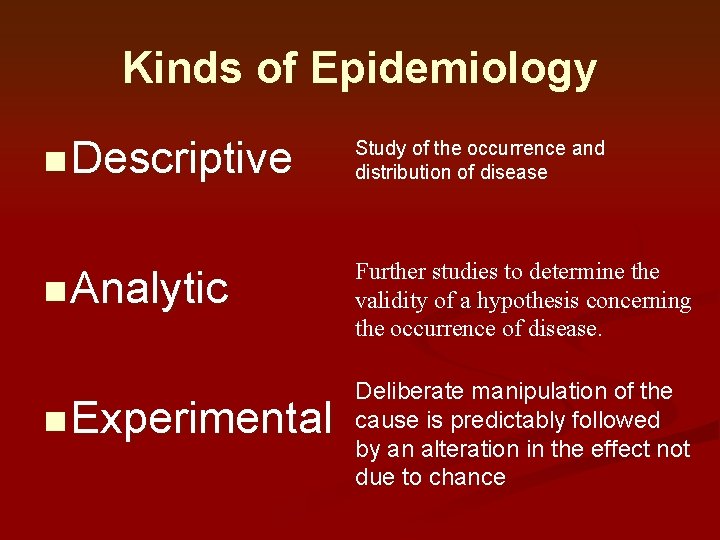
Kinds of Epidemiology n Descriptive Study of the occurrence and distribution of disease n Analytic Further studies to determine the validity of a hypothesis concerning the occurrence of disease. n Experimental Deliberate manipulation of the cause is predictably followed by an alteration in the effect not due to chance
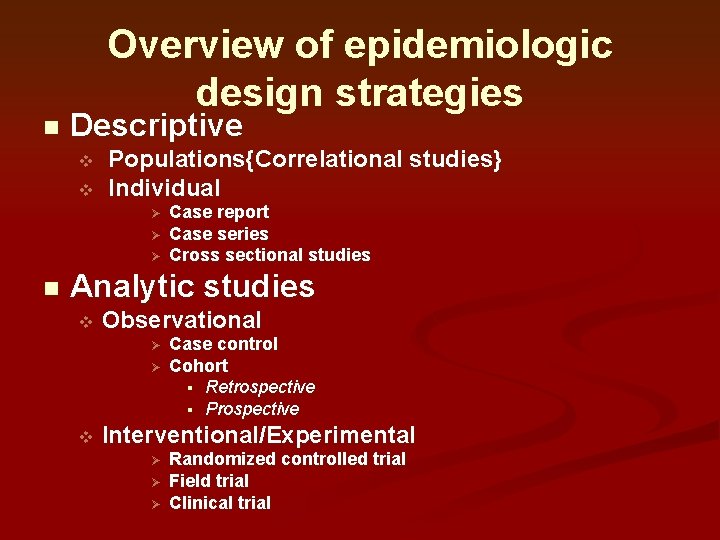
Overview of epidemiologic design strategies n Descriptive v v Populations{Correlational studies} Individual Ø Ø Ø n Case report Case series Cross sectional studies Analytic studies v Observational Ø Ø v Case control Cohort § Retrospective § Prospective Interventional/Experimental Ø Ø Ø Randomized controlled trial Field trial Clinical trial
Descriptive vs. Analytic Epidemiology e n n Descriptiv Analytic n Used when insight about various aspects of disease is available n Rely on development of new data n Why n Evaluates the causality of associations Used when little is known about the disease Rely on preexisting data n Who, where, when n Illustrates potential associations. Both are important!
Descriptive Studies n Relatively inexpensive and less timeconsuming than analytic studies, they describe, n Patterns of disease occurrence, in terms of, n n Who gets sick and/or who does not Where rates are highest and lowest Temporal patterns of disease Data provided are useful for, n n Public health administrators (for allocation of resources) Epidemiologists (first step in risk factor determination)
Descriptive Epidemiology n Correlational studies n Case reports n Case series n Cross sectional studies
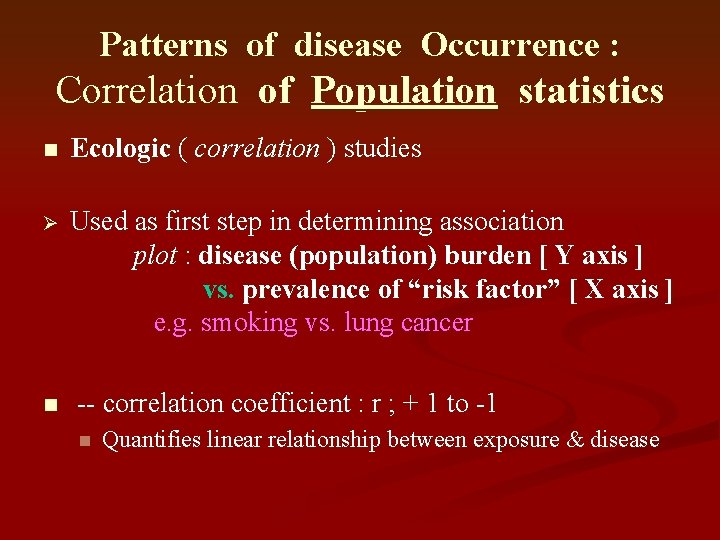
Correlational Studies (Ecological Studies) n n n Uses measures that represent characteristics of entire populations It describes outcomes in relation to age, time, utilization of services, or exposures ADVANTAGES n n We can generate hypotheses for case-control studies and environmental studies We can target high-risk populations, time-periods, or geographic regions for future studies
Correlational Studies n LIMITATIONS n Because data are for groups, we cannot link disease and exposure in individual n We cannot control for potential confounders n Data represent average exposures rather than individual exposures, so we cannot determine a dose -response relationship n Caution must be taken to avoid drawing inappropriate conclusions, or ecological fallacy
Patterns of disease Occurrence : Correlation of Population statistics n Ecologic ( correlation ) studies Ø Used as first step in determining association plot : disease (population) burden [ Y axis ] vs. prevalence of “risk factor” [ X axis ] e. g. smoking vs. lung cancer n -- correlation coefficient : r ; + 1 to -1 n Quantifies linear relationship between exposure & disease
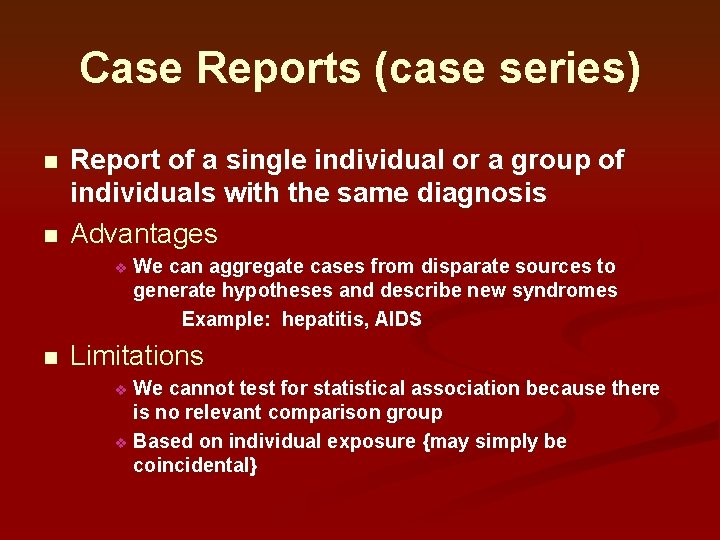
Case Reports (case series) n n Report of a single individual or a group of individuals with the same diagnosis Advantages v n We can aggregate cases from disparate sources to generate hypotheses and describe new syndromes Example: hepatitis, AIDS Limitations We cannot test for statistical association because there is no relevant comparison group v Based on individual exposure {may simply be coincidental} v
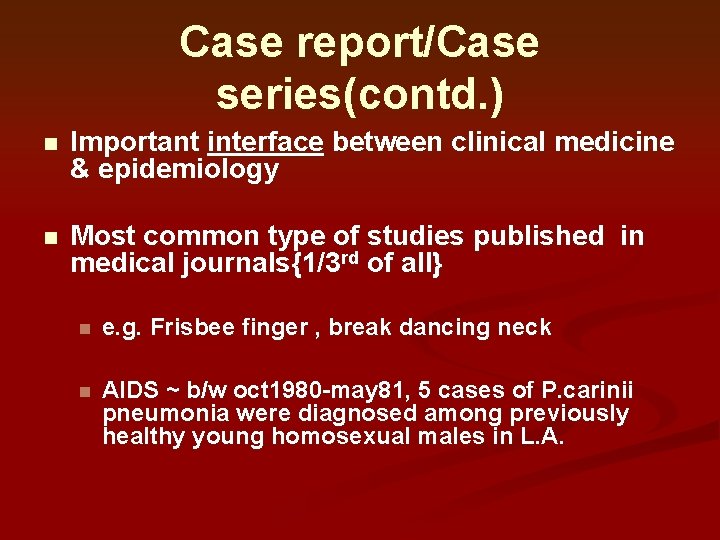
Case report/Case series(contd. ) n Important interface between clinical medicine & epidemiology n Most common type of studies published in medical journals{1/3 rd of all} n e. g. Frisbee finger , break dancing neck n AIDS ~ b/w oct 1980 -may 81, 5 cases of P. carinii pneumonia were diagnosed among previously healthy young homosexual males in L. A.
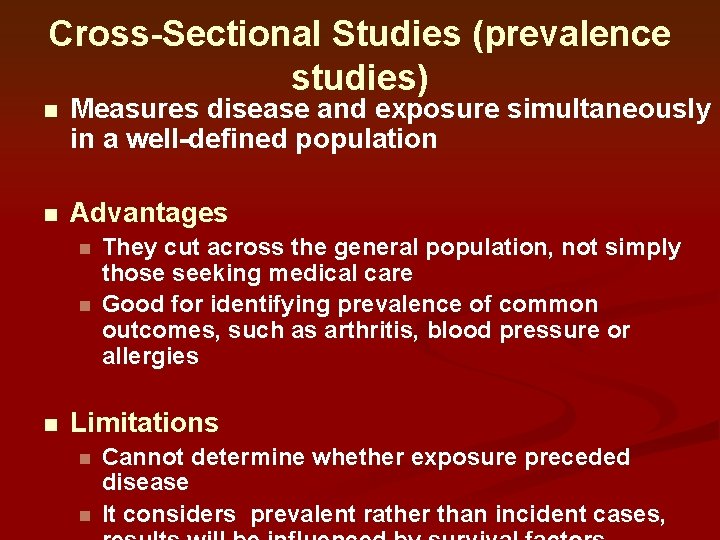
Cross-Sectional Studies (prevalence studies) n Measures disease and exposure simultaneously in a well-defined population n Advantages n n n They cut across the general population, not simply those seeking medical care Good for identifying prevalence of common outcomes, such as arthritis, blood pressure or allergies Limitations n n Cannot determine whether exposure preceded disease It considers prevalent rather than incident cases,
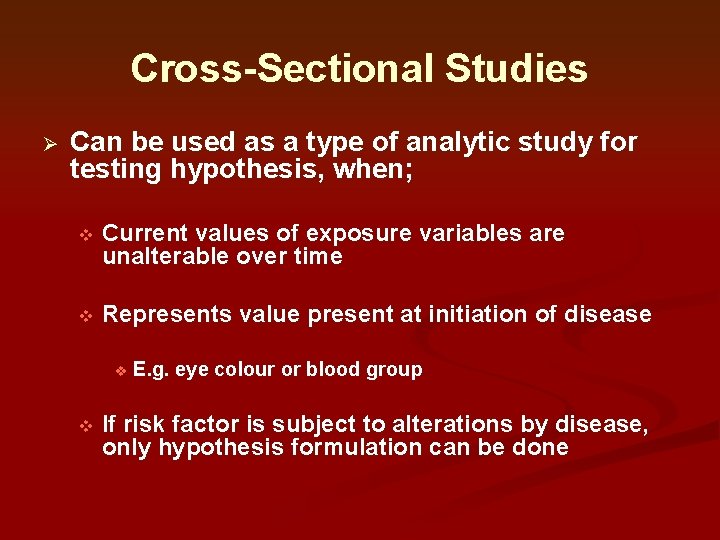
Cross-Sectional Studies Ø Can be used as a type of analytic study for testing hypothesis, when; v Current values of exposure variables are unalterable over time v Represents value present at initiation of disease v v E. g. eye colour or blood group If risk factor is subject to alterations by disease, only hypothesis formulation can be done
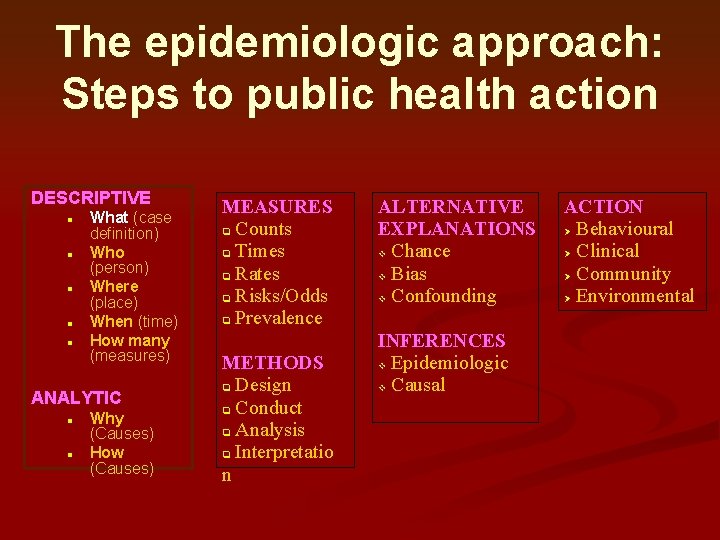
The epidemiologic approach: Steps to public health action DESCRIPTIVE n n n What (case definition) Who (person) Where (place) When (time) How many (measures) ANALYTIC n n Why (Causes) How (Causes) MEASURES q Counts q Times q Rates q Risks/Odds q Prevalence METHODS q Design q Conduct q Analysis q Interpretatio n ALTERNATIVE EXPLANATIONS v Chance v Bias v Confounding INFERENCES v Epidemiologic v Causal ACTION Ø Behavioural Ø Clinical Ø Community Ø Environmental
Key questions Why now? n Why here? n Why in this group? n
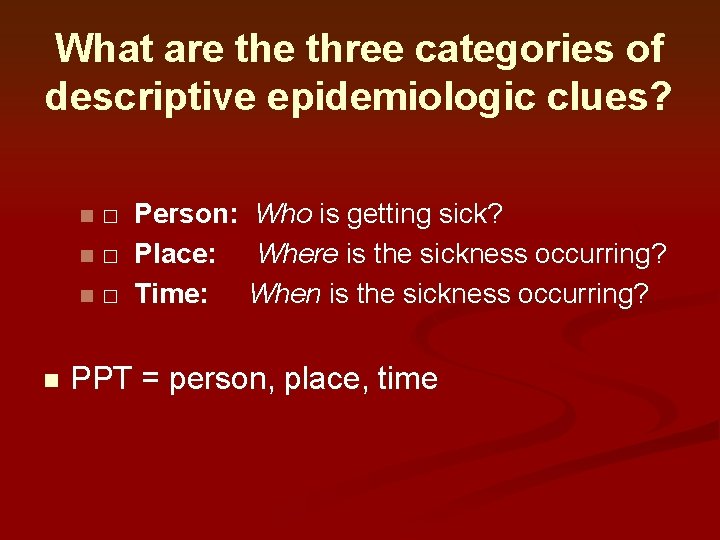
Descriptive Epidemiology Study of the occurrence and distribution of disease n Terms: Ø Time Ø Place Ø Person n
What are three categories of descriptive epidemiologic clues? □ n□ n□ n n Person: Who is getting sick? Place: Where is the sickness occurring? Time: When is the sickness occurring? PPT = person, place, time
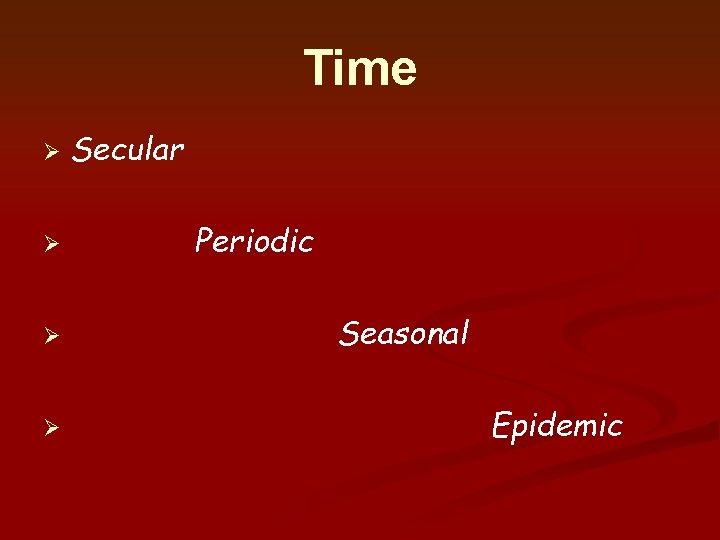
Time Ø Ø Secular Periodic Seasonal Epidemic
Secular Trend The long-time trend of disease occurrence
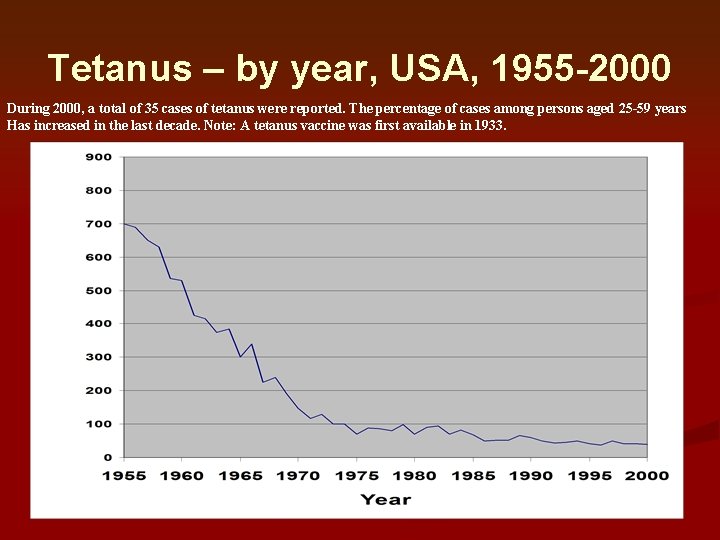
Tetanus – by year, USA, 1955 -2000 During 2000, a total of 35 cases of tetanus were reported. The percentage of cases among persons aged 25 -59 years Has increased in the last decade. Note: A tetanus vaccine was first available in 1933.
Possible Reasons for Changes in Trends n Artifactual n Errors in numerator due to n. Changes in the recognition of disease n. Changes in the rules and procedures for classification of causes of death n. Changes in the classification code of causes of death n. Changes in accuracy of reporting age at death n. Errors in the denominator due to error in the enumeration of the population
Possible Reasons for Changes in Trends (cont. ) n Real n n n Changes in age distribution of the population Changes in survivorship Changes in incidence of disease resulting from n n Genetic factors Environmental factors
Other phrases ü Cyclic trends ~ recurrent alterations in occurrence , interval or frequency of disease v Secular cyclicity Ø Levels of immunizations Ø Build up of susceptibles ü e. g. v Short Hep A-7 yr cycle, Measles-2 yr cycle term cyclicity ü Chickenpox, salmonella(yearly basis)
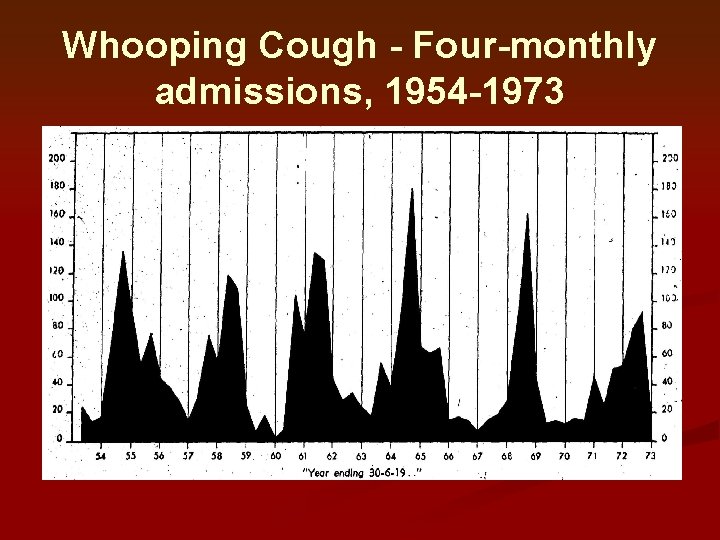
Periodic Trend Temporal interruption of the general trend of secular variation
Whooping Cough - Four-monthly admissions, 1954 -1973
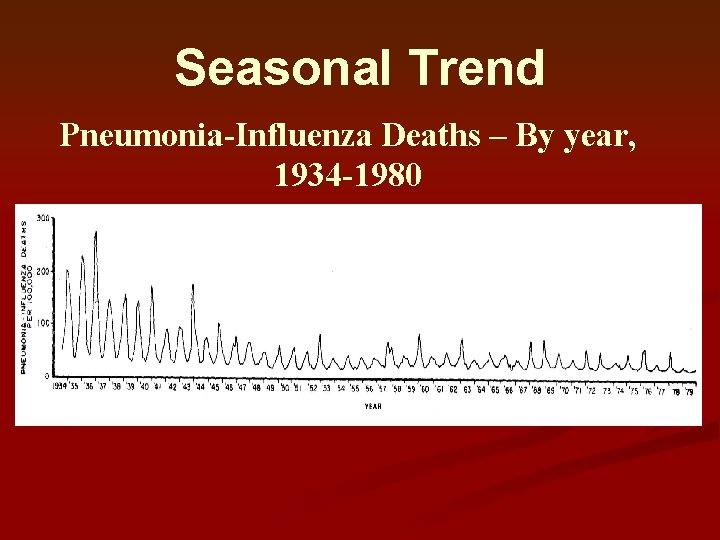
Seasonal n. A cyclic variation in disease frequency by time of year & season. ØSeasonal fluctuations in, v. Environmental factors v. Occupational activities v. Recreational activities
Seasonal Trend Pneumonia-Influenza Deaths – By year, 1934 -1980
Epidemic An increase in incidence above the expected in a defined geographic area within a defined time period
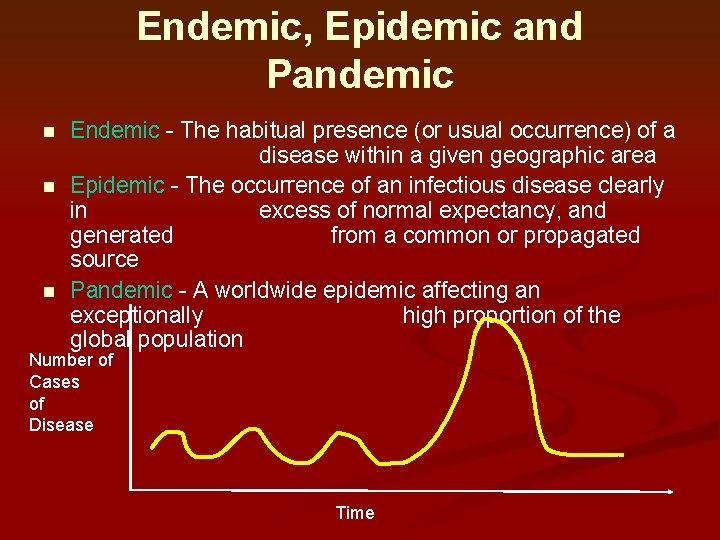
Endemic, Epidemic and Pandemic n n n Endemic - The habitual presence (or usual occurrence) of a disease within a given geographic area Epidemic - The occurrence of an infectious disease clearly in excess of normal expectancy, and generated from a common or propagated source Pandemic - A worldwide epidemic affecting an exceptionally high proportion of the global population Number of Cases of Disease Time
Time clustering Time Place Cluster/disease cluster n. A group of cases occur close together & have a well aligned distribution pattern {in terms of time and place} n Cluster analysis-used for rare or special disease events.
Time/Place clustering analysis using the Poisson model {Poisson spatial/nearest neighbor distribution} n Poisson probability distribution is an inferential statistics probability measure. n Describes objects/events as they are distributed geographically. n Geographical area divided into a series of equal square areas. n Randomization i. e. each case has equal probability of falling into each square. n If clustering occurs, probability of cause-effect relationship goes up & vice versa.
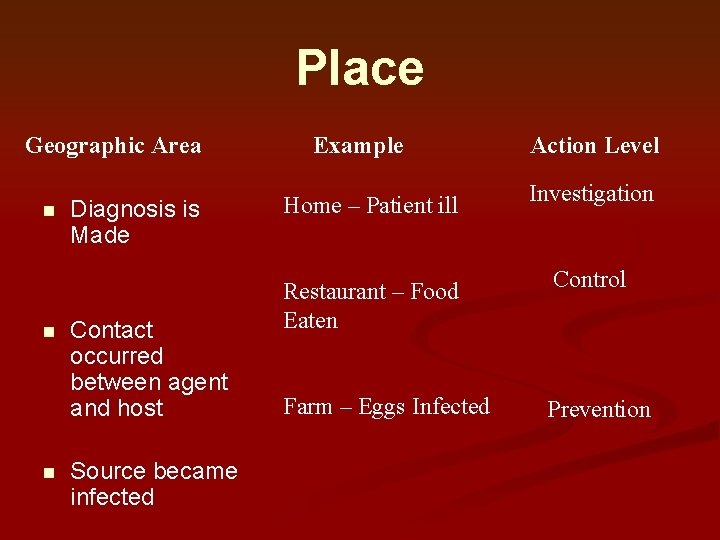
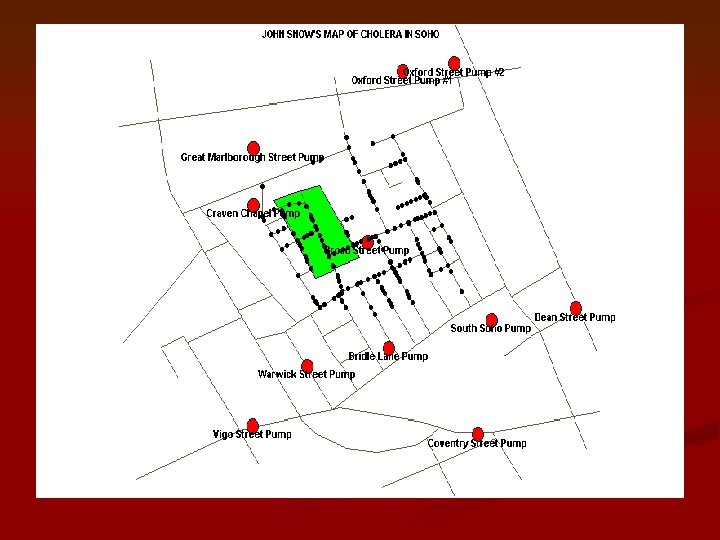
Place Geographic Area n n n Diagnosis is Made Contact occurred between agent and host Source became infected Example Action Level Home – Patient ill Investigation Restaurant – Food Eaten Control Farm – Eggs Infected Prevention
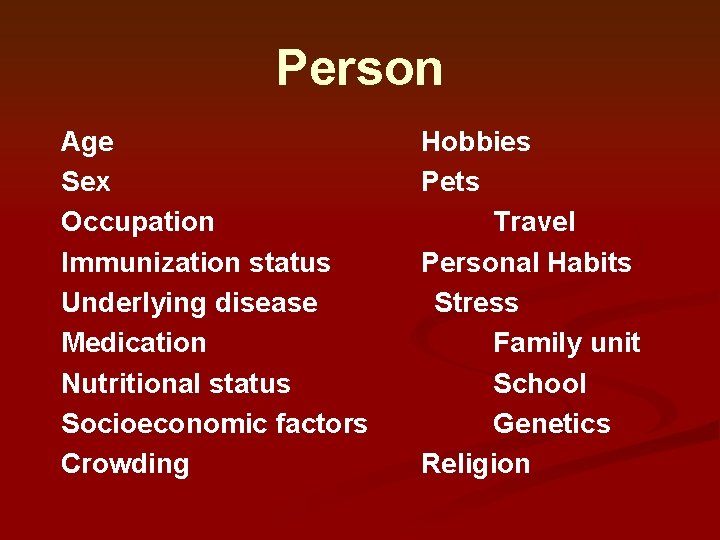
Person Age Sex Occupation Immunization status Underlying disease Medication Nutritional status Socioeconomic factors Crowding Hobbies Pets Travel Personal Habits Stress Family unit School Genetics Religion
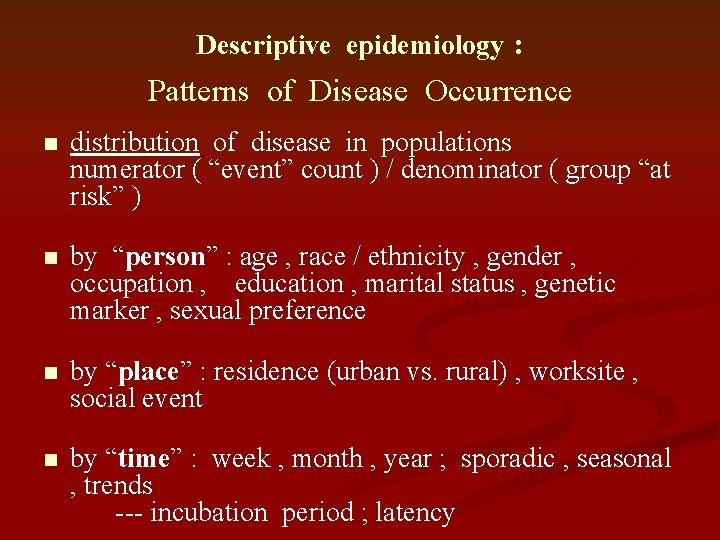
Descriptive epidemiology : Patterns of Disease Occurrence n distribution of disease in populations numerator ( “event” count ) / denominator ( group “at risk” ) n by “person” : age , race / ethnicity , gender , occupation , education , marital status , genetic marker , sexual preference n by “place” : residence (urban vs. rural) , worksite , social event n by “time” : week , month , year ; sporadic , seasonal , trends --- incubation period ; latency
Sources of information Census data n Vital statistical records n Employment health examinations n Clinical records from hospitals n National figures on food consumption , medications, health events etc n
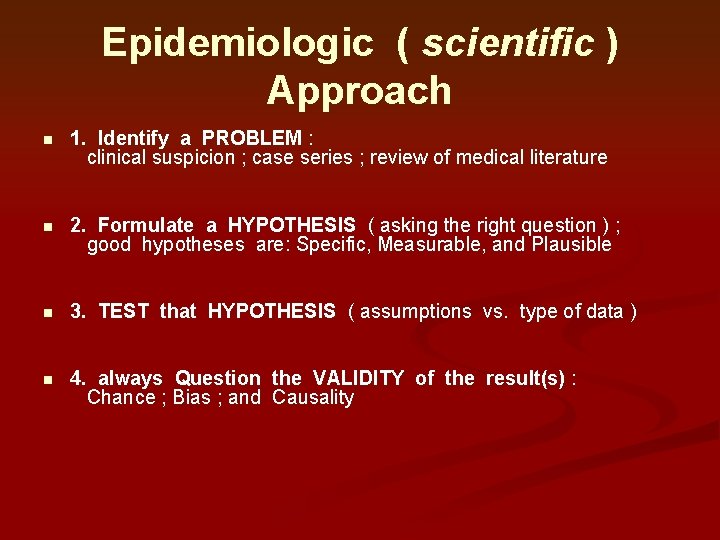
Epidemiologic ( scientific ) Approach n 1. Identify a PROBLEM : clinical suspicion ; case series ; review of medical literature n 2. Formulate a HYPOTHESIS ( asking the right question ) ; good hypotheses are: Specific, Measurable, and Plausible n 3. TEST that HYPOTHESIS ( assumptions vs. type of data ) n 4. always Question the VALIDITY of the result(s) : Chance ; Bias ; and Causality
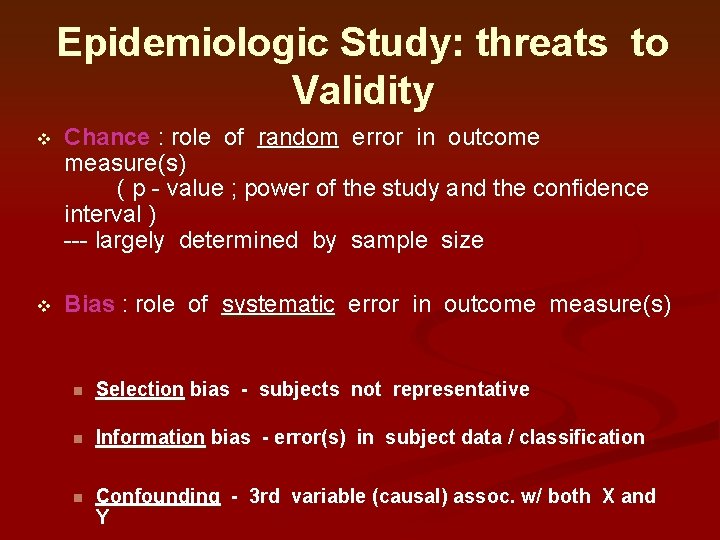
Epidemiologic Study: threats to Validity v Chance : role of random error in outcome measure(s) ( p - value ; power of the study and the confidence interval ) --- largely determined by sample size v Bias : role of systematic error in outcome measure(s) n Selection bias - subjects not representative n Information bias - error(s) in subject data / classification n Confounding - 3 rd variable (causal) assoc. w/ both X and Y
What is a hypothesis? n An educated guess n an unproven idea n based on observation or reasoning, that can be proven or disproven through investigation.
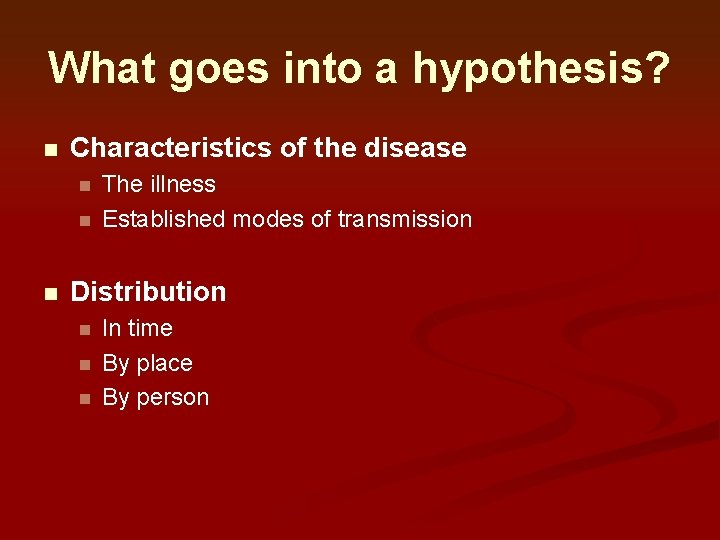
What goes into a hypothesis? n Characteristics of the disease n n n The illness Established modes of transmission Distribution n In time By place By person
Hypothesis formulation n 4 methods {derived from 5 canons of inductive reasoning by John Stuart Mill} v Method of difference v Method of agreement v Method of concomitant variation v Method of analogy
Measures n Morbidity: Refers to the presence of disease in a population n Mortality: Refers to the occurrence of death in a population
Methods for Measuring How do we determine disease frequency for a population? n Rate = Frequency of defined events in specified population for given time period n Rates allow comparisons between two or more populations of different sizes or of a population over time
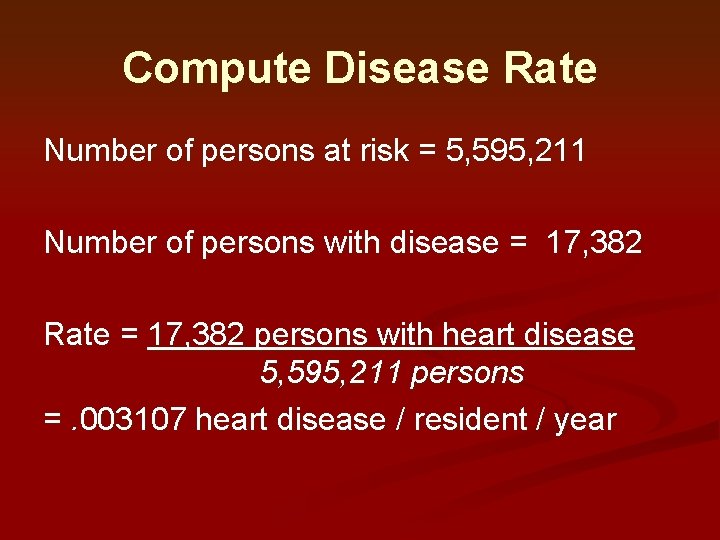
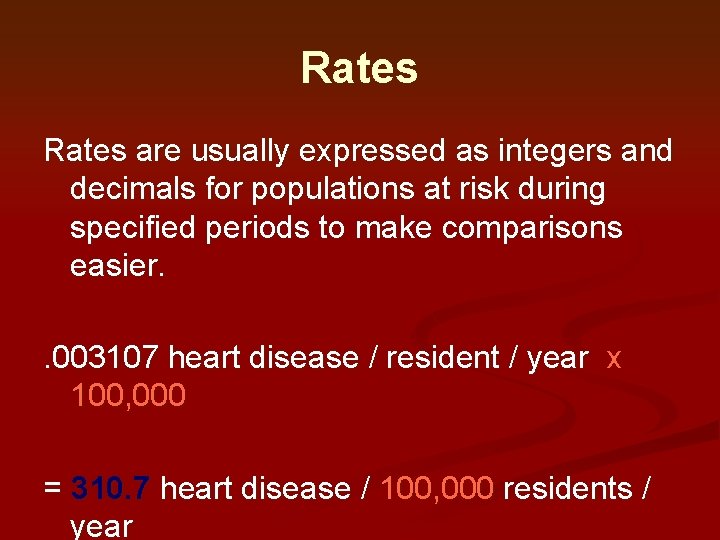
Compute Disease Rate Number of persons at risk = 5, 595, 211 Number of persons with disease = 17, 382 Rate = 17, 382 persons with heart disease 5, 595, 211 persons =. 003107 heart disease / resident / year
Rates are usually expressed as integers and decimals for populations at risk during specified periods to make comparisons easier. . 003107 heart disease / resident / year x 100, 000 = 310. 7 heart disease / 100, 000 residents / year
Prevalence vs. Incidence n Prevalence is the number of existing cases of disease in the population during a defined period. n Incidence is the number of new cases of disease that develop in the population during a defined period.
Incidence n Incidence rate is a measure of the probability of the event among persons at risk.
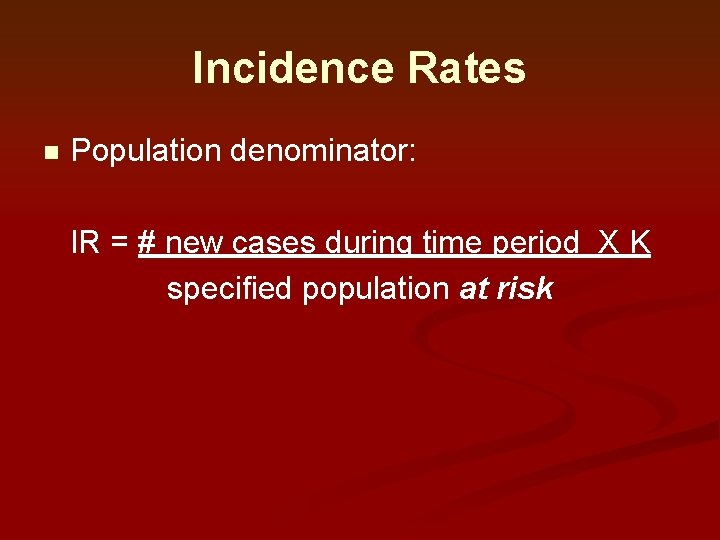
Incidence Rates n Population denominator: IR = # new cases during time period X K specified population at risk
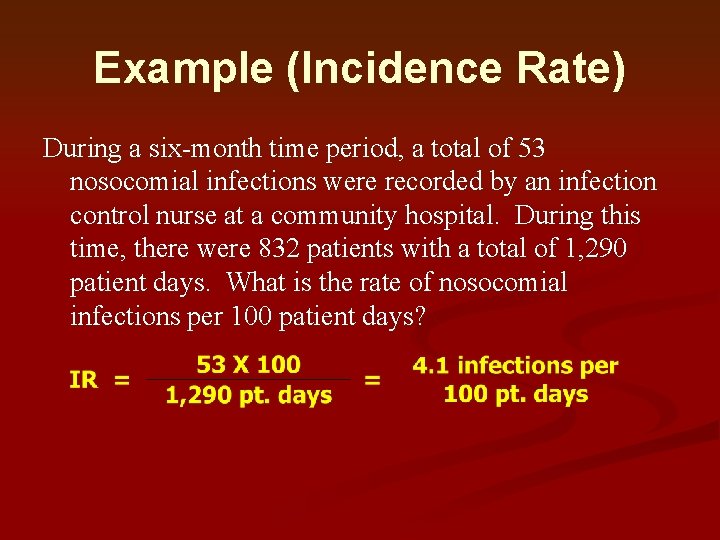
Example (Incidence Rate) During a six-month time period, a total of 53 nosocomial infections were recorded by an infection control nurse at a community hospital. During this time, there were 832 patients with a total of 1, 290 patient days. What is the rate of nosocomial infections per 100 patient days?
Mortality Rates n A special type of incidence rate n Number of deaths occurring in a specified population in a given time period
Use of Mortality rates n Mortality rates are used to estimate disease frequency when… n incidence data are not available, n case-fatality rates are high, n goal is to reduce mortality among screened or targeted populations
Mortality Rates: Examples n Crude mortality: death rate in an entire population n n Rates can also be calculated for sub-groups within the population Cause-specific mortality: rate at which deaths occur for a specific cause
Mortality Rates: Examples n Case-fatality: Rate at which deaths occur from a disease among those with the disease n Maternal mortality: Ratio of death from childbearing for a given time period per number of live births during same time period
Mortality Rates: Examples n Infant mortality: Rate of death for children less than 1 year per number of live births n Neonatal mortality: Rate of death for children less than 28 days of age per number of live births
Prevalence n Prevalence: Existing cases in a specified population during a specified time period (both new and ongoing cases) n Prevalence is a measure of burden of disease or health problem in a population
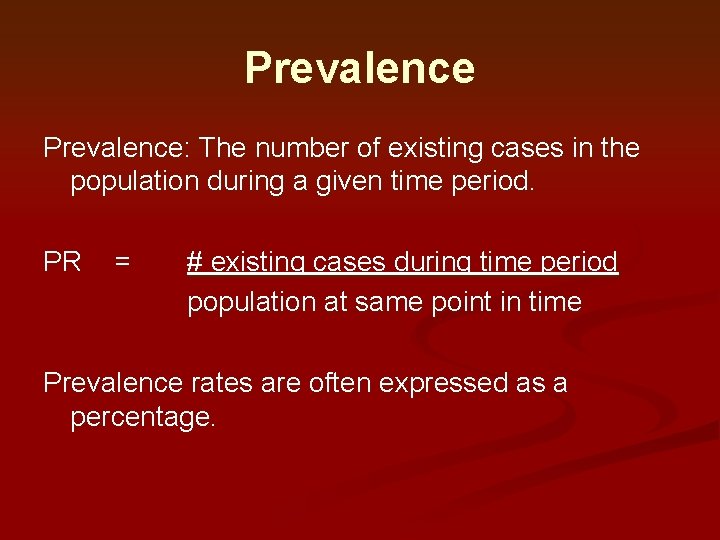
Prevalence: The number of existing cases in the population during a given time period. PR = # existing cases during time period population at same point in time Prevalence rates are often expressed as a percentage.
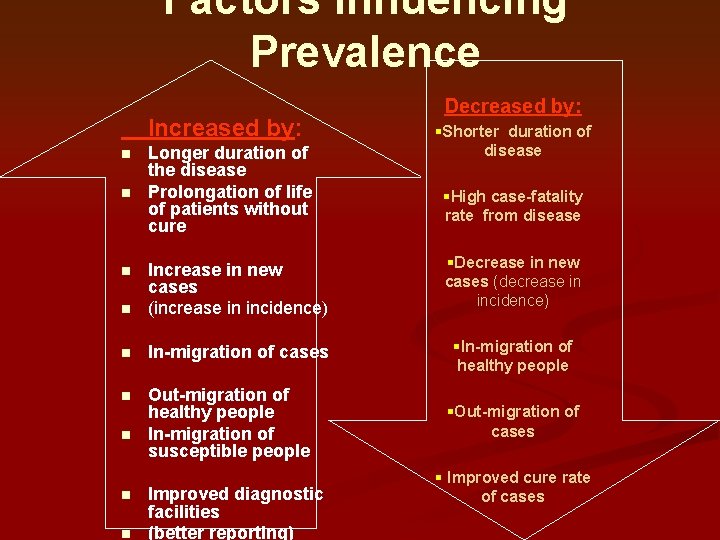
Factors Influencing Prevalence Increased by: n n Longer duration of the disease Prolongation of life of patients without cure Decreased by: §Shorter duration of disease §High case-fatality rate from disease n Increase in new cases (increase in incidence) §Decrease in new cases (decrease in incidence) n In-migration of cases §In-migration of healthy people n Out-migration of healthy people In-migration of susceptible people n n Improved diagnostic facilities (better reporting) §Out-migration of cases § Improved cure rate of cases
Basic Measures of Association n Relative risk& odds ratio n We often need to know the relationship between an outcome and certain factors (e. g. , age, sex, race, smoking status, etc. ) n Used to guide planning and intervention strategies
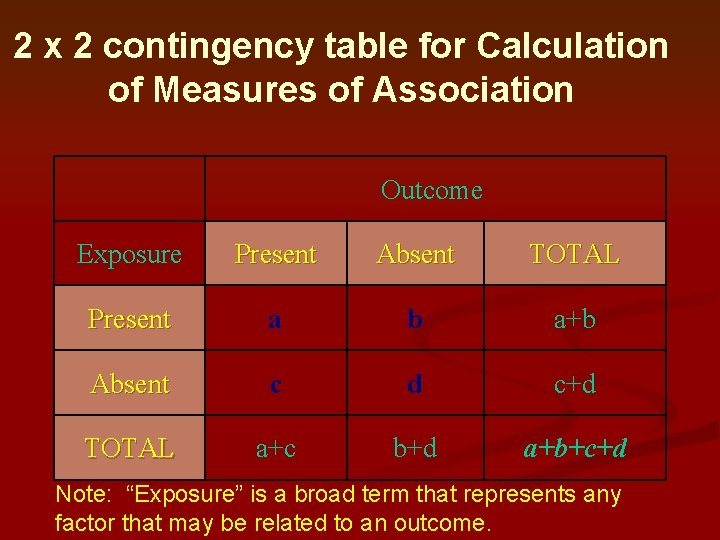
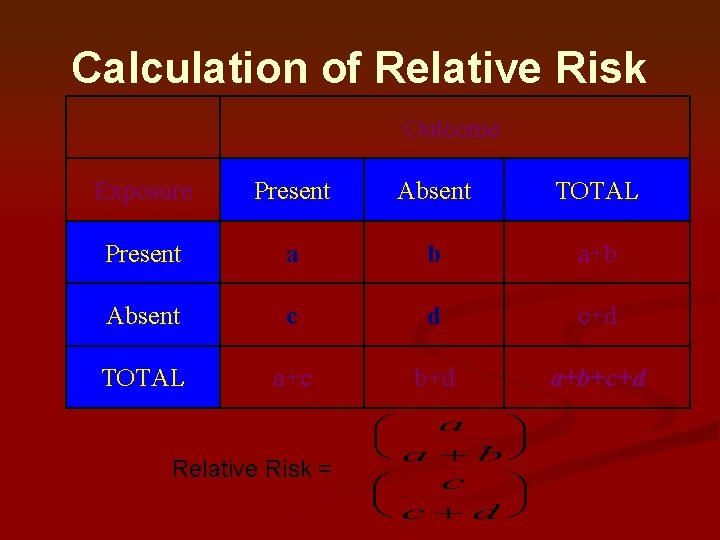
2 x 2 contingency table for Calculation of Measures of Association Outcome Exposure Present Absent TOTAL Present a b a+b Absent c d c+d TOTAL a+c b+d a+b+c+d Note: “Exposure” is a broad term that represents any factor that may be related to an outcome.
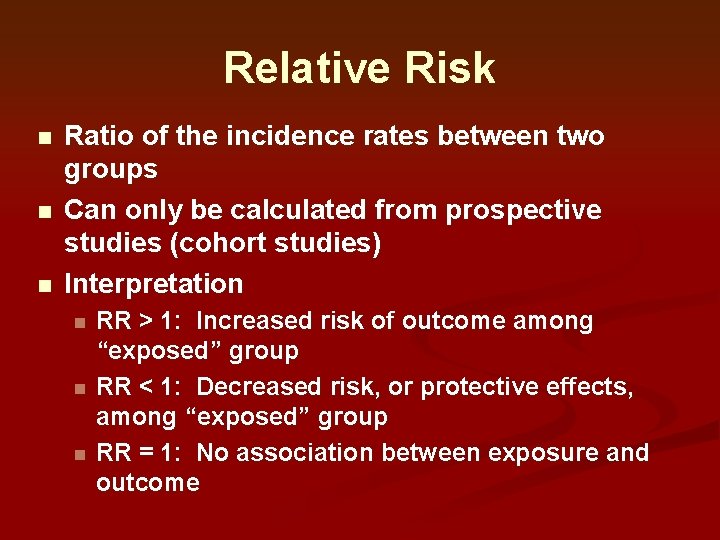
Relative Risk n n n Ratio of the incidence rates between two groups Can only be calculated from prospective studies (cohort studies) Interpretation n RR > 1: Increased risk of outcome among “exposed” group RR < 1: Decreased risk, or protective effects, among “exposed” group RR = 1: No association between exposure and outcome
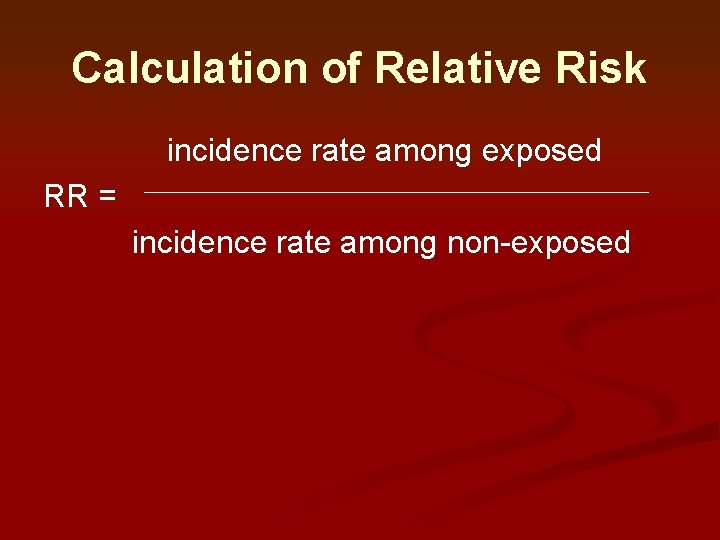
Calculation of Relative Risk incidence rate among exposed RR = incidence rate among non-exposed
Calculation of Relative Risk Outcome Exposure Present Absent TOTAL Present a b a+b Absent c d c+d TOTAL a+c b+d a+b+c+d Relative Risk =
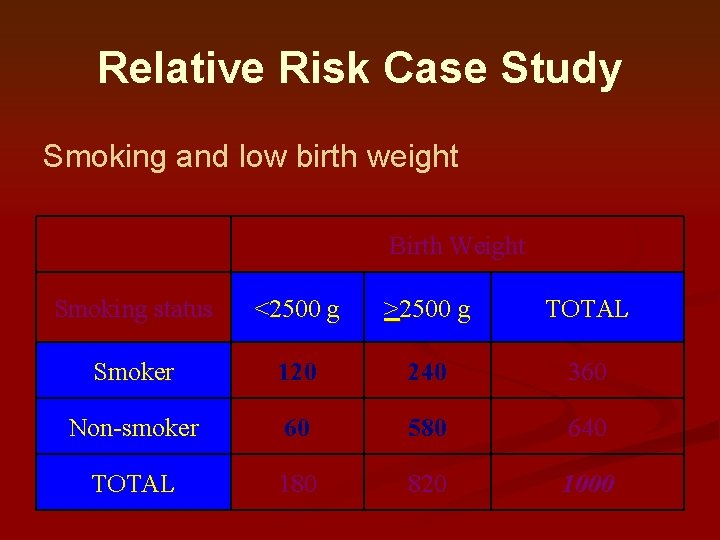
Relative Risk Case Study Smoking and low birth weight Birth Weight Smoking status <2500 g >2500 g TOTAL Smoker 120 240 360 Non-smoker 60 580 640 TOTAL 180 820 1000
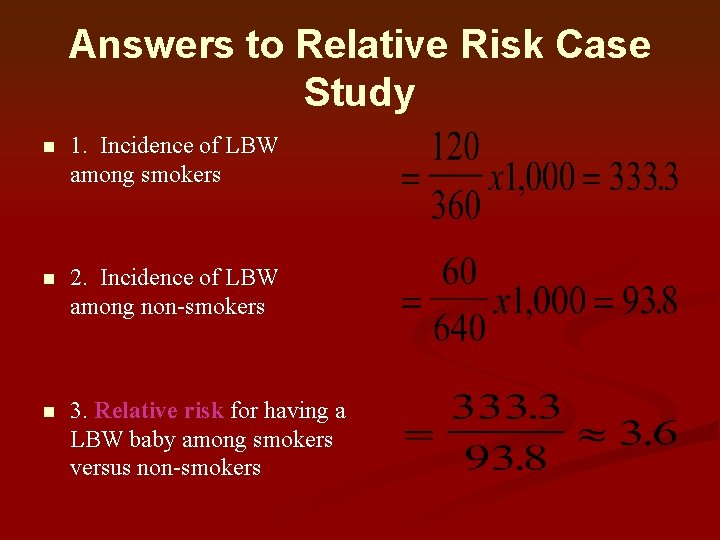
Answers to Relative Risk Case Study n 1. Incidence of LBW among smokers n 2. Incidence of LBW among non-smokers n 3. Relative risk for having a LBW baby among smokers versus non-smokers
Understanding Probability and Odds n Probability: Chance or risk of an event occurring (a proportion) n Probability= no. of times an event occurs no. of times an event can occur n Odds: ratio of the probability of an event occurring to the probability of an event not occurring n Odds = P/(1 -P)
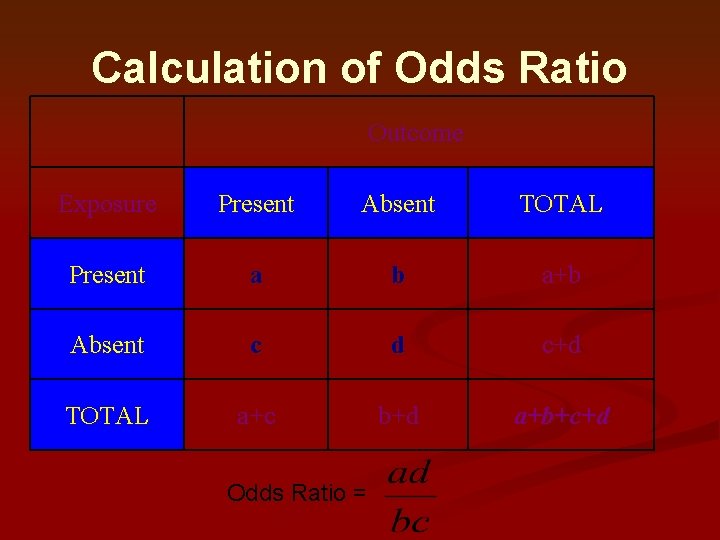
Calculation of Odds Ratio Outcome Exposure Present Absent TOTAL Present a b a+b Absent c d c+d TOTAL a+c b+d a+b+c+d Odds Ratio =
Odds Ratio n The odds ratio (OR) is a ratio of two odds. The OR can be calculated for all three study designs Ø Cross-sectional Ø Case-control Ø Cohort. n
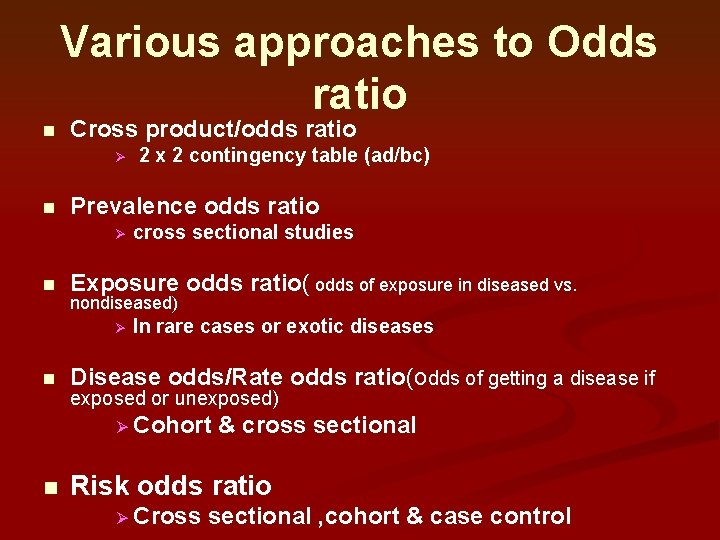
Various approaches to Odds ratio n Cross product/odds ratio Ø n Prevalence odds ratio Ø n cross sectional studies Exposure odds ratio( odds of exposure in diseased vs. nondiseased) Ø n 2 x 2 contingency table (ad/bc) In rare cases or exotic diseases Disease odds/Rate odds ratio(odds of getting a disease if exposed or unexposed) Ø Cohort n & cross sectional Risk odds ratio Ø Cross sectional , cohort & case control
Odds Ratio n For cohort & cross sectional studies: OR is a ratio of the odds of the outcome in exposed persons to the odds of the outcome in non-exposed persons. n For case-control studies: OR is a ratio of the odds of exposure in cases to the odds of exposure in controls. n Provides an estimate of the relative risk when the outcome is rare
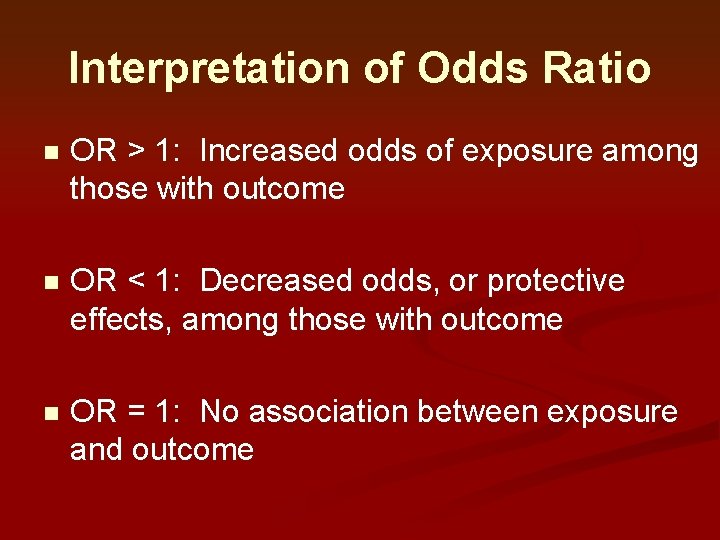
Interpretation of Odds Ratio n OR > 1: Increased odds of exposure among those with outcome n OR < 1: Decreased odds, or protective effects, among those with outcome n OR = 1: No association between exposure and outcome
Keeping the Terms Straight n “Risk ratio” = “relative risk” n “Relative odds” = “odds ratio” n Remember – the key is recognizing the terms “risk” and “odds”
Appropriateness of Measures n Remember that the relative risk can only be calculated in prospective studies n Odds ratio can be calculated for any design Cohort / prospective n Case-control n Cross-sectional n
Inference n The relative risk and odds ratio provide the magnitude of difference between some factor and an outcome n How do we know if the magnitude is statistically significant?
Confidence Intervals n A confidence interval is a range of values that is likely (e. g. , 95%) to contain the true value in the underlying population
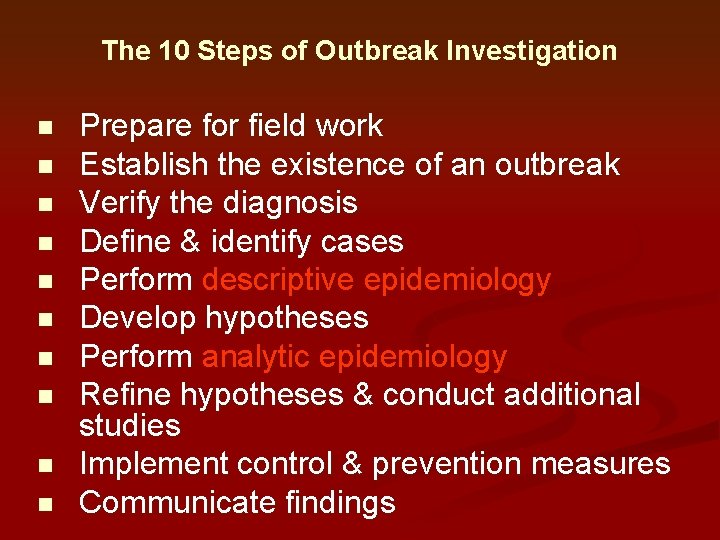
The 10 Steps of Outbreak Investigation n n Prepare for field work Establish the existence of an outbreak Verify the diagnosis Define & identify cases Perform descriptive epidemiology Develop hypotheses Perform analytic epidemiology Refine hypotheses & conduct additional studies Implement control & prevention measures Communicate findings
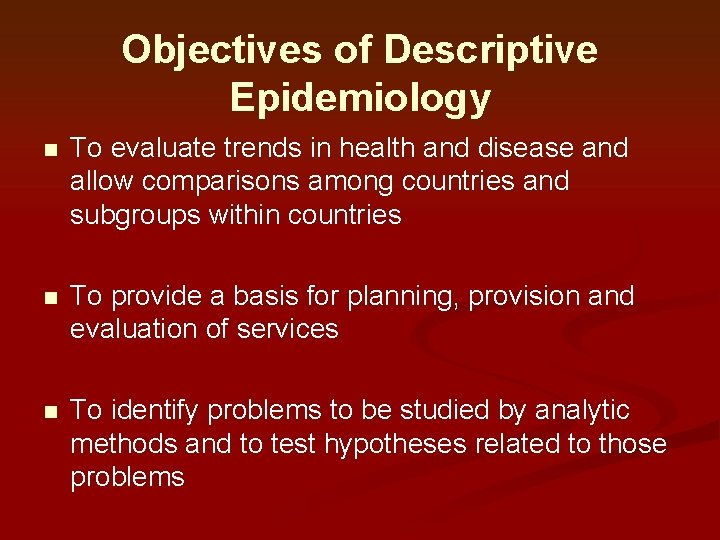
Objectives of Descriptive Epidemiology n To evaluate trends in health and disease and allow comparisons among countries and subgroups within countries n To provide a basis for planning, provision and evaluation of services n To identify problems to be studied by analytic methods and to test hypotheses related to those problems